. 2019 Jun 20;10(1):2718.
doi: 10.1038/s41467-019-10772-2.

Simultaneous motor preparation and execution in a last-moment reach correction task

Affiliations

Simultaneous motor preparation and execution in a last-moment reach correction task

K Cora Ames et al. Nat Commun. .

Abstract

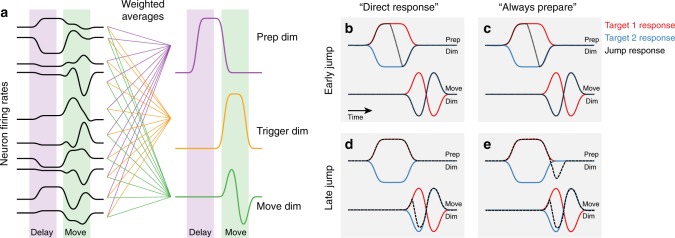
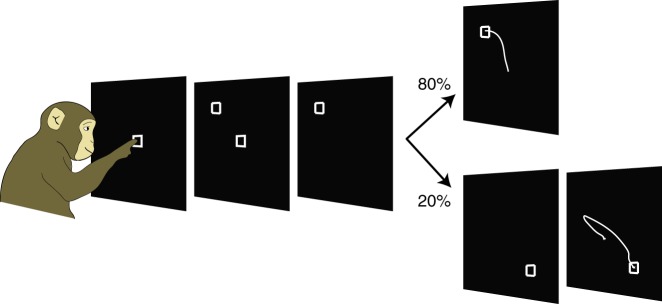
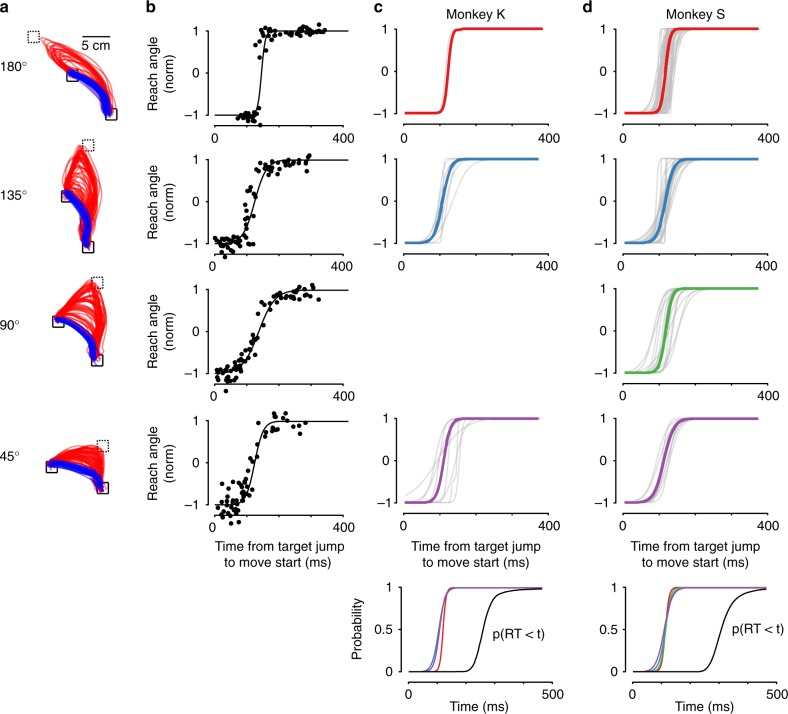
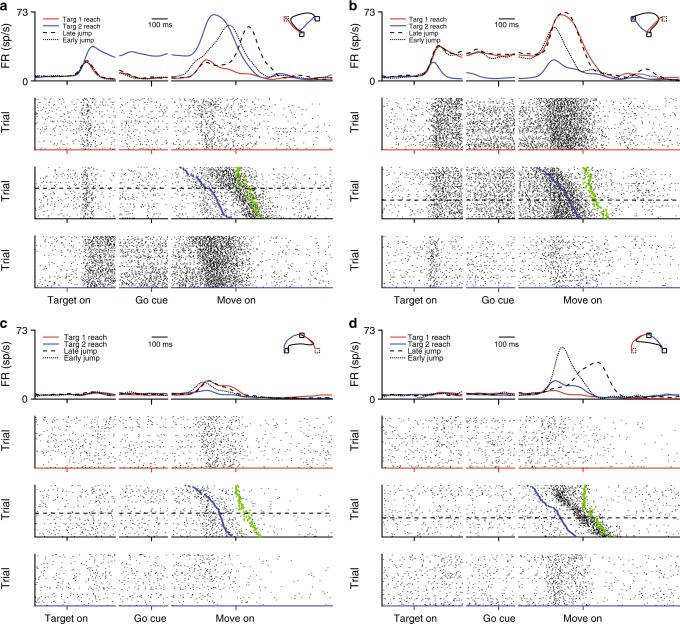
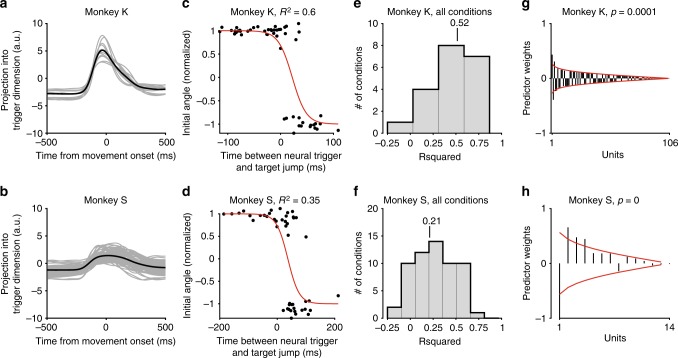
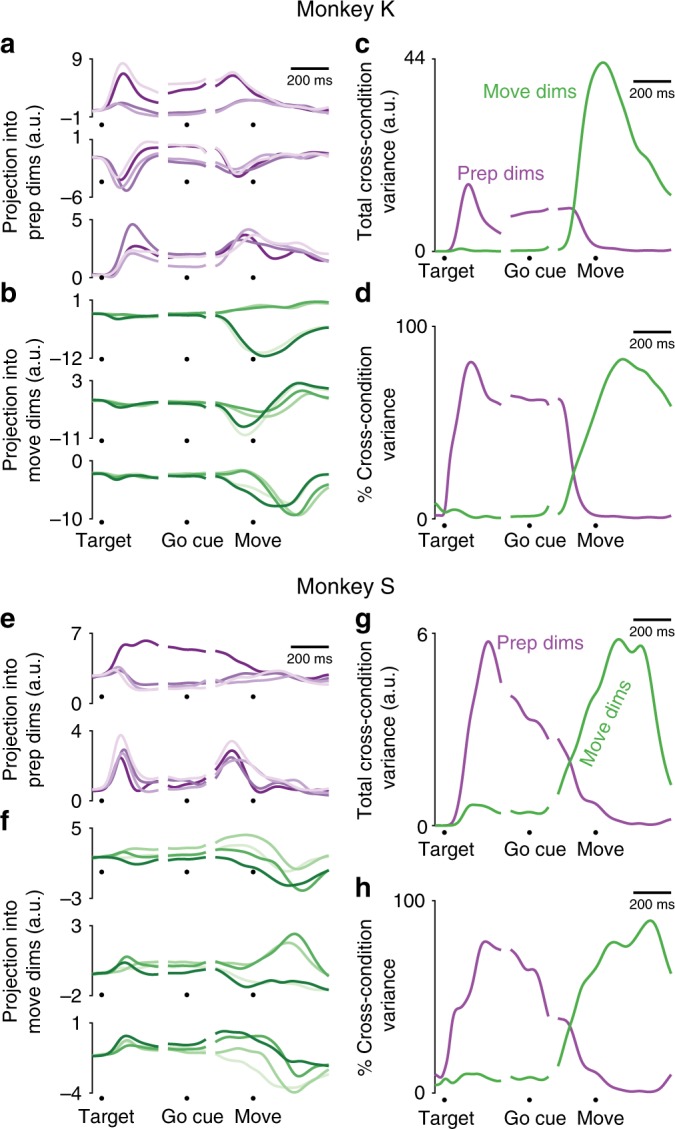
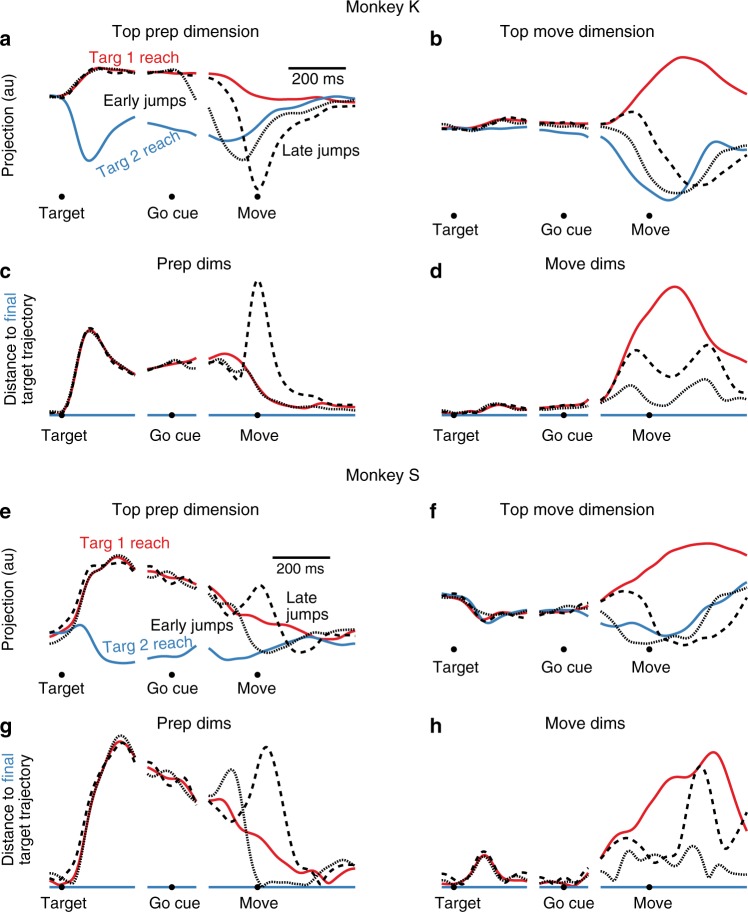
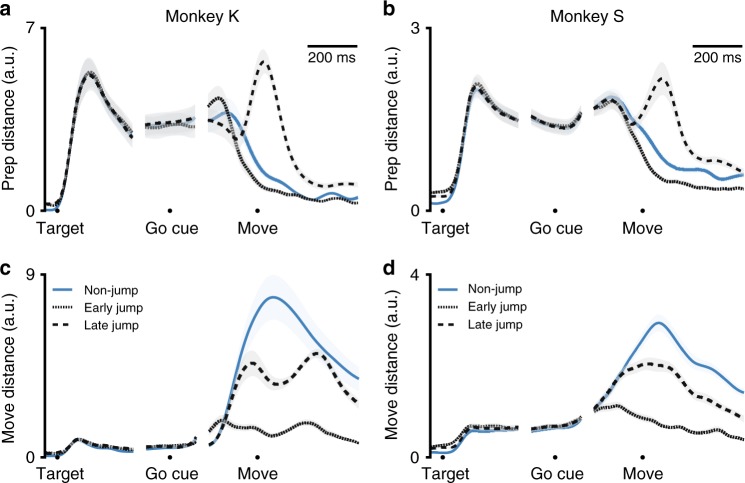
Motor preparation typically precedes movement and is thought to determine properties of upcoming movements. However, preparation has mostly been studied in point-to-point delayed reaching tasks. Here, we ask whether preparation is engaged during mid-reach modifications. Monkeys reach to targets that occasionally jump locations prior to movement onset, requiring a mid-reach correction. In motor cortex and dorsal premotor cortex, we find that the neural activity that signals when to reach predicts monkeys' jump responses on a trial-by-trial basis. We further identify neural patterns that signal where to reach, either during motor preparation or during motor execution. After a target jump, neural activity responds in both preparatory and movement-related dimensions, even though error in preparatory dimensions can be small at that time. This suggests that the same preparatory process used in delayed reaching is also involved in reach correction. Furthermore, it indicates that motor preparation and execution can be performed simultaneously.


Conflict of interest statement

The authors declare no competing interests.

Figures

Fig. 1
Fig. 1
Cartoon of neural hypotheses. a To identify important signals in the neural population, we can project them into new dimensions. Activity in each dimension is calculated as a weighted average of the firing rates of all neurons. In motor cortex, there tend to be separate dimensions active during movement preparation and movement generation (which tend to have different firing rates across different reaching directions), as well as a trigger dimension which changes in a consistent manner prior to movement for all reach directions. b Direct Response Hypothesis, early jumps: For jumps which occur while the motor cortex is still in the preparatory period (before or just after the go cue), neural activity after a jump (dotted black) should transition from preparing a reach to the first target (red) to preparing a reach to the final target (blue). Because the neural correction to the target jump is completed before movement onset, target-jump activity in movement dimensions should be similar to a reach to the final target. c Always Prepare Hypothesis, early jumps: For jumps which occur while the motor cortex is still in the preparatory period (before or just after the go cue), the neural correction is in the preparatory dimensions, so the neural predictions of the direct response hypothesis and the always prepare hypothesis are the same. d Direct Response Hypothesis, late jumps: For target jumps which occur close to the onset of movement, there is no difference in the preparatory space between the pattern of activity for the first (red) and second jumps (blue). Under the Direct Response Hypothesis, we would therefore expect to see the response to the target jump occur exclusively in the movement-related neural dimensions. e Always Prepare Hypothesis, late jumps: Under the Always Prepare Hypothesis, motor preparation must be re-engaged following a target jump. We would thus expect to see a target jump response in the preparatory dimensions, even though these dimensions are not ordinarily active during movement
Fig. 2
Fig. 2
Target Jump Task. To initiate a trial, monkeys touched an illuminated center hold target projected on a vertical screen. After 500–700 ms, a final target appeared, indicating where the monkeys should reach next. After a delay period of 0–500 ms (S) or 0–900 ms (K), the center target disappeared, serving as a go cue. On 80% of trials, the monkeys would then reach to the cued target. On 20% of trials (jump trials), the first cued target changed locations at a random time after the go cue but before the monkeys began reaching. The monkeys needed to touch the final target to receive a juice reward
Fig. 3
Fig. 3
Initial reach angles after a target jump. a Reach paths after a target jump, for example conditions with a 180 degree, 135 degree, 90 degree, and 45 degree distance between targets. Red traces were initiated toward the first target location and corrected online, blue traces were initiated toward the final target location. b Initial reach angle as a function of time from the target jump to movement onset, for the example conditions shown in (a). Each dot shows one trial, lines show sigmoidal fit. c, d Sigmoidal fits for initial reach angles vs. time from target jump to movement onset, for all recorded conditions, for Monkey K (c) and Monkey S (d). Colored lines show average fits. Bottom row shows the overlap of average fits for each jump angle (scaled to go from 0 to 1), along with the cumulative RT distribution across all non-jump trials on all recording days. Note that Monkey K did not perform 90-degree target jump conditions, so that entry is left blank. For non-normalized angles, see Supplementary Fig. 2
Fig. 4
Fig. 4
Example single unit activity during jump and non-jump conditions. All examples are different jump conditions for the same unit. ad Different example jump conditions, with activity of jump trials shown together with non-jump conditions to the same targets. Top row: Average FR during non-jump reaches to the first target (red), non-jump reaches to the final target (blue), jump reaches which were initiated toward the final target (dotted line), and jump reaches which were initiated toward the first target (dashed line). Second row: Raster plot of spike times during non-jump reaches to the first target. Dimensions are times x trials. Third row: Raster plot of spike times during jumps from the first to the final target. Raster includes both trials in which the hand started toward the final target (above dashed line) and in which the hand started toward the first target and was corrected online (below dashed line). Blue dot indicates the time of target jump. Green dot indicates the time of first detected movement toward the final target. Fourth row: Raster plot of spike times during non-jump reaches to the final target
Fig. 5
Fig. 5
Trigger state at time of jump predicts subsequent behavior. a, b Average neural activity in the trigger dimension, during non-jump trials. Each individual condition is shown in gray, the average across conditions is shown in black. Shortly before movement onset, neural activity begins to change in this dimension. c, d Example conditions for Monkey K and S. Each dot shows, on the x-axis, the time between the target jump and the time that the trigger signal crosses zero: negative numbers imply that the jump preceded the neural trigger event, positive numbers indicate that the jump occurred after the neural trigger event. On the y-axis is shown the initial reach angle, normalized to range from negative one (first target) to one (final target). Best-fit sigmoidal line is shown in red. e, f Distributions of quality of sigmoid fit between the difference between neural trigger time and target jump time versus the distance reached to the wrong target, for each jump condition recorded for Monkey K and S. R2 values show generalization accuracy across n = 20 conditions (Monkey K) and n = 68 conditions (Monkey S). Line shows median accuracy. g, h Distribution of weights for each unit onto the trigger dimension, for an example dataset for each monkey. Black lines: the magnitude of contribution of each unit to the trigger dimension, ordered by absolute value. Red lines, average weight distributions for random projections
Fig. 6
Fig. 6
Separation of non-jump neural activity into preparatory and movement dimensions. a, b For an example dataset from Monkey K, projection of trial-averaged, non-jump reaching condition firing rates into a preparatory dimensions and b movement dimensions. Each trace is a different reach direction. c For the same dataset shown in A-B, the total cross-condition variance across all preparatory dimensions and movement dimensions, as a function of time. Purple: variance in preparatory dimensions. Green: variance in movement dimensions. d As in (c), but normalized by the total cross-condition variance at each time point. eh As in (ad), for Monkey S
Fig. 7
Fig. 7
Target jump response in preparatory and movement dimensions, example conditions. a For an example target jump condition for Monkey K, neural activity in one preparatory dimension. All traces show trial-averaged activity. Red: non-jump reaches to the first target. Blue: non-jump reaches to the final target. Dashed black: Jump trials initiated toward the first target. Dotted Black: Jump trials initiated toward the final target. b As in (a), but for an example movement dimension. c For Monkey K, the time-aligned neural distance to the non-jump reach trajectory to the final target, calculated across all preparatory dimensions. Note that the distance between a trajectory and itself is zero, so the blue line (Distance from a target 2 reach to itself) shows a zero distance. d As in (c), for distance in movement dimensions. eh As in (ad), for Monkey S
Fig. 8
Fig. 8
Target jump response in preparatory and movement dimensions, across datasets. a For Monkey K, neural distance to the neural trajectory for reaches to the final target in the preparatory space. Blue: Distance between neural trajectories for non-jump reaches to the first versus final target. Dotted line: Neural distance for jump reaches which were initiated toward the final target. Dashed line: Neural distance for jump reaches which were initiated toward the first target. All lines are mean ± s.e.m. across conditions. b As in (a), for Monkey S. c For Monkey K, distance to the neural trajectory for non-jump reaches to the final target in the movement space. Colors as in (a). d As in (c), for Monkey S. For conditions separated by reach angle, see Supplementary Fig. 6

References

    1. Tanji J, Evarts E. Anticipatory activity of motor cortex neurons in relation to direction of an intended movement. J. Neurophysiol. 1976;39:1062–1068. doi: 10.1152/jn.1976.39.5.1062. - DOI - PubMed
    1. Wise S, Mauritz K. Set-related neuronal activity in the premotor cortex of rhesus monkeys: effects of changes in motor set. Proc. R. Soc. Lond. Ser. B Biol. Sci. 1985;223:331–354. doi: 10.1098/rspb.1985.0005. - DOI - PubMed
    1. Mauritz -HK, Wise S. Premotor cortex of the rhesus monkey: neuronal activity in anticipation of predictable environmental events. Exp. Brain Res. 1986;61:229–244. doi: 10.1007/BF00239513. - DOI - PubMed
    1. Alexander G, Crutcher Preparation for movement: neural representations of intended direction in three motor areas of the monkey. J. Neurophysiol. 1990;64:133–150. doi: 10.1152/jn.1990.64.1.133. - DOI - PubMed
    1. Crammond D, Kalaska J. Modulation of preparatory neuronal activity in dorsal premotor cortex due to stimulus-response compatibility. J. Neurophysiol. 1994;71:1281–1284. doi: 10.1152/jn.1994.71.3.1281. - DOI - PubMed

Publication types