. 2019 Jun 20;10(7):487.
doi: 10.1038/s41419-019-1716-9.

Microglia-derived TNF-α mediates endothelial necroptosis aggravating blood brain-barrier disruption after ischemic stroke

Affiliations

Microglia-derived TNF-α mediates endothelial necroptosis aggravating blood brain-barrier disruption after ischemic stroke

An-Qi Chen et al. Cell Death Dis. .

Abstract

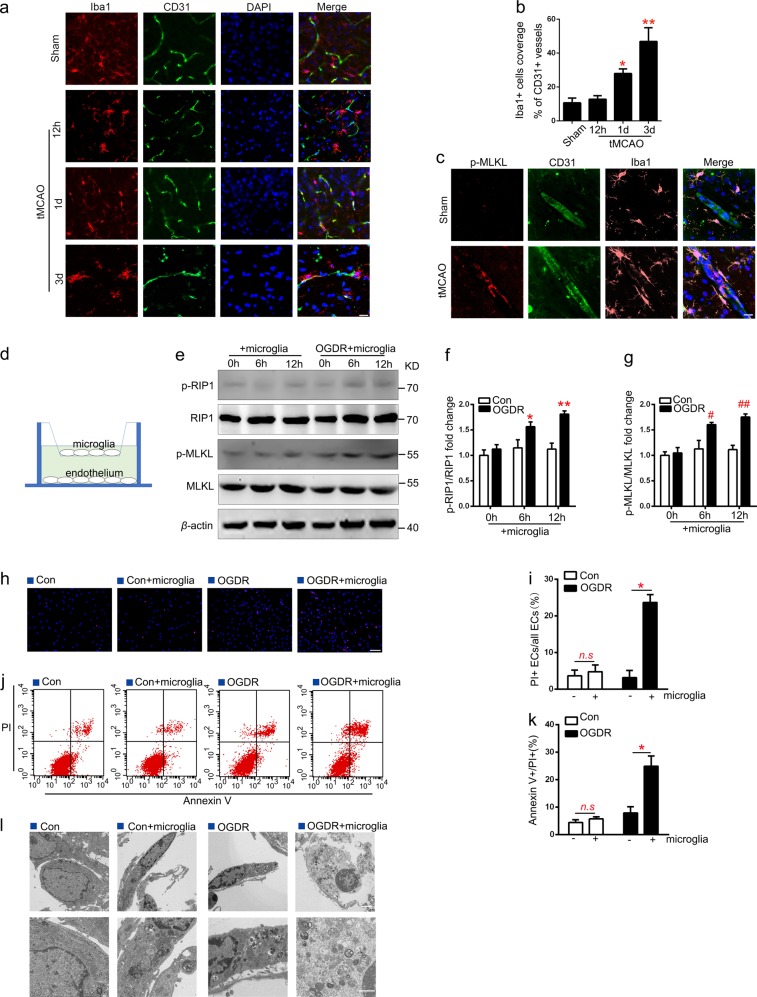
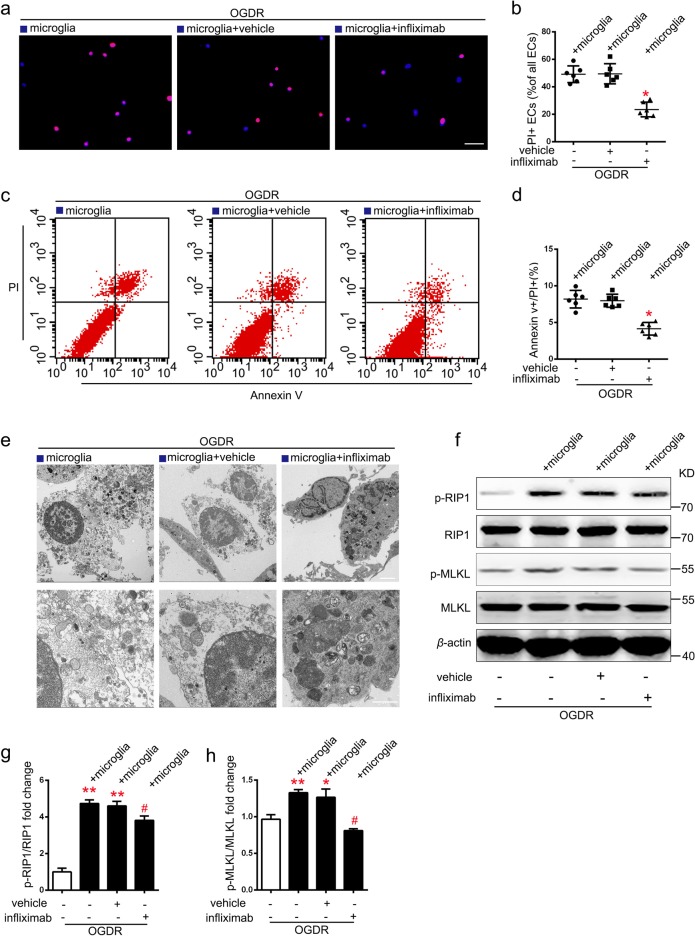
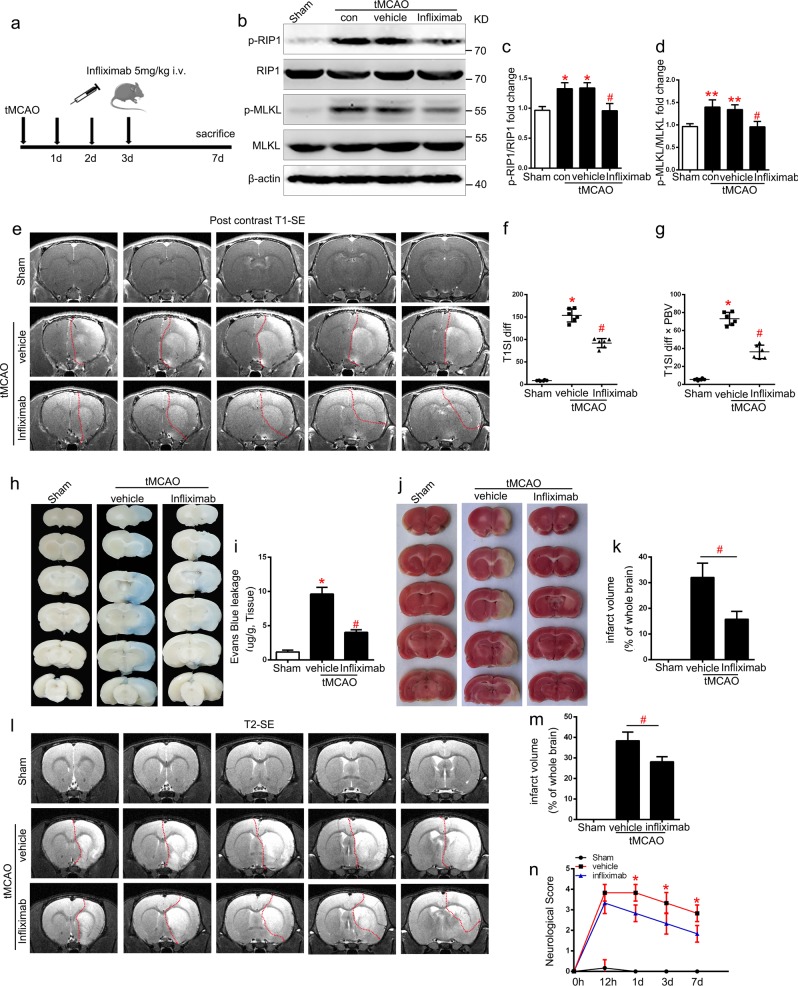
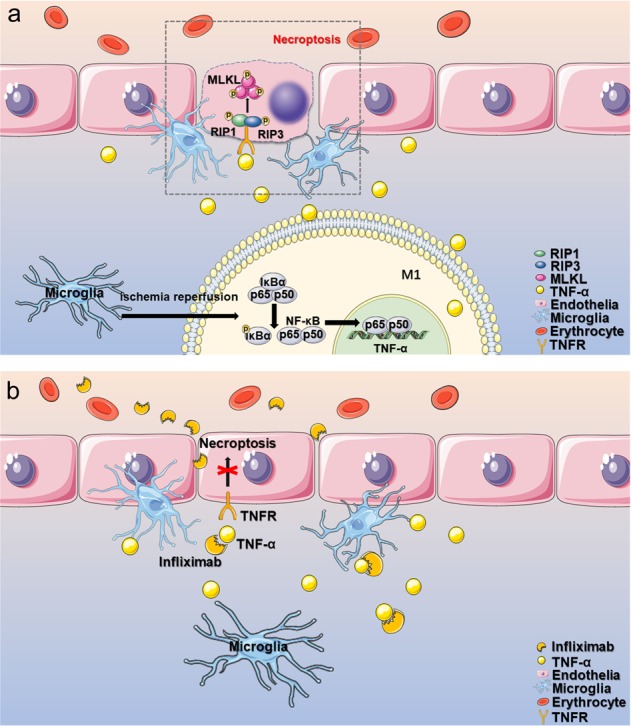
Endothelium (EC) is a key component of blood-brain barrier (BBB), and has an important position in the neurovascular unit. Its dysfunction and death after cerebral ischemic/reperfusion (I/R) injury not only promote evolution of neuroinflammation and brain edema, but also increase the risk of intracerebral hemorrhage of thrombolytic therapies. However, the mechanism and specific interventions of EC death after I/R injury are poorly understood. Here we showed that necroptosis was a mechanism underlying EC death, which promoted BBB breakdown after I/R injury. Treatment of rats with receptor interacting protein kinase 1 (RIPK1)-inhibitor, necrostatin-1 reduced endothelial necroptosis and BBB leakage. We furthermore showed that perivascular M1-like microglia-induced endothelial necroptosis leading to BBB disruption requires tumor necrosis factor-α (TNF-α) secreted by M1 type microglia and its receptor, TNF receptor 1 (TNFR1), on endothelium as the primary mediators of these effects. More importantly, anti-TNFα (infliximab, a potent clinically used drug) treatment significantly ameliorate endothelial necroptosis, BBB destruction and improve stroke outcomes. Our data identify a previously unexplored role for endothelial necroptosis in BBB disruption and suggest infliximab might serve as a potential drug for stroke therapy.


Conflict of interest statement

The authors declare that they have no conflict of interest.

Figures

Fig. 1
Fig. 1. Necroptosis activated after ischemic stroke in Endothelium.
a, b Representative images and statistical results of PI (red, represents necrosis)/TUNEL (green, represents apoptosis) staining of cerebral cortex at 6 h, 12 h, 1 day, 3 day, and 7 day after tMCAO. n = 5; *P< 0.01 vs. Sham group, **P< 0.0001 vs. Sham group; Scale bar: 100 μm. c, d Representative images and statistical results of CD31 (green) and PI (red) staining of rat brain sections from Sham and tMCAO (12 h, 1 day, 3 day, 7 day) groups. Arrows indicate the colocalization of CD31 and PI. n = 6; *P< 0.01 vs. Sham group, **P< 0.0001 vs. Sham group. Scale bar: 50 μm. ei Expression levels of p-RIP1/RIP1, p-MLKL/MLKL, Casp 3 and Casp 8 in lateral cortex tissues of the peri-infarct area after tMCAO (3 day). n = 6; *P< 0.05 vs. Sham group; **P < 0.01 vs. Sham group. j Representative electron microscopy images of EC from ischemic cortex after tMCAO (3 day). EC from ischemic cortex exhibited translucent cytoplasm, swelling mitochondria, and membrane breakdown. n = 3; Scale bar: 2 μm (merged pictures) and 1 μm (magnified pictures). k, i Representative images and statistical results of CD31 (green) and p-MLKL (red) staining of rat brain sections from Sham and tMCAO (3 day) groups. Arrows indicate the colocalization of CD31 and p-MLKL. Scale bar: 100 μm (merged pictures) and 50 μm (magnified pictures); n = 6; tMCAO group 26.50 ± 1.176% vs. Sham group 1.833 ± 0.3073%; **P< 0.001 (All values from three to six independent experiments are presented as mean ± S.E.M.)
Fig. 2
Fig. 2. Inhibition of necroptosis decreases BBB disruption after ischemia reperfusion.
a, b Representative images and statistical results of IgG (green, represents BBB leakage) and p-MLKL (red) staining of rat brain sections from Sham and tMCAO (3 day) groups. n = 3; *P < 0.005 as of p-MLKL in tMCAO group vs. Sham group; #P < 0.001 as of IgG in tMCAO group vs. Sham group; Scale bar: 100 μm. c Schematic diagram showing the lateral cerebral ventricle injection area in rat brain. d Experimental scheme. e–g Expression levels of p-RIP1/RIP1 and p-MLKL/MLKL proteins in ischemic lateral cortex after tMCAO (3 day). n = 6; *P < 0.005 vs. Sham group; **P < 0.0001 vs. Sham group; #P < 0.001 vs. vehicle group. h, i Representative images and statistical results of CD31 (green) and p-MLKL (red) staining of rat brain sections from tMCAO (3 day) and Nec-1-injected groups. Arrows indicate the colocalization of CD31 and p-MLKL. n = 6; vehicle group 41.17 ± 1.922 % vs. Sham group 4.33 ± 0.7149 %; *P < 0.001; Nec-1 injected group 41.17 ± 1.922 % vs. vehicle group 16.00 ± 0.6325 %; #P < 0.001; Scale bar: 100 μm. j–l Representative MRI post-contrast T1-SE images of rat brains from Sham, vehicle, and Nec-1-injected groups. BBB permeability was represented by T1SI-diff and T1SI-diff × PBV. n = 6; *P < 0.0001 vs. Sham group; #P < 0.005 vs. vehicle group; ##P < 0.001 vs. vehicle group. m, n Evans blue leakage of rat brains in coronal sections (m) and extravasation (μg/g tissue) (n) from Sham, vehicle, and Nec-1-injected groups. n = 6; *P < 0.001 vs. Sham group; **P < 0.0001 vs. Sham group; #P < 0.001 vs. vehicle group
Fig. 3
Fig. 3. Necroptosis of ECs increases when co-cultured with microglial under OGDR.
a, b Representative images and statistical results of Iba1+(red) cells coverage on CD31+ cells (green) in the peri-infarct area at 12 h, 1 and 3 day after tMCAO. n = 6; *P < 0.01 vs. Sham group; **P < 0.005 vs. Sham group; Scale bar: 20 μm. c Representative images of CD31 (green), Iba1(pink), and p-MLKL (red) staining of rat brain sections from Sham and tMCAO (3 day) groups. n = 3; scale bar: 20 μm. d Illustration of the in vitro co-culture system. e–g Expression levels of p-RIP1/RIP1 and p-MLKL/MLKL in ECs under different conditions. n = 6; *P < 0.05 vs. control 6 h group; **P < 0.001 vs. control 12 h group; #P < 0.01 vs. control 6 h group; ##P < 0.001 vs. control 12 h group. h, i Representative images of PI (red) and Hoechst (blue) of ECs (solo-cultured or co-cultured with microglia) subjected to normal condition (con) or 12 h OGDR. n = 3; *P = 0.0013 vs. solo-culture under OGDR conditions; Scale bar: 100 μm. j–k Representative flow cytometry images of ECs stained with PI/annexin V. The necroptosis activation was represented by ratio of PI + /annexin V + . n = 3; *P = 0.0091 vs. solo-culture under OGDR. l Representative electron microscopy images of ECs. ECs co-cultured with microglia under OGDR exhibited translucent cytoplasm, swelling mitochondria, and membrane disruption. n = 3; Scale bar: 2 μm (merged pictures) and 1 μm (magnified pictures)
Fig. 4
Fig. 4. Knockdown of TNF-α in M1 type microglia reduces EC necroptosis in co-culture system under OGDR.
a–f mRNA expression of M1 makers (TNF-α, IL-1β, iNOS, and IL-6) and M2 makers (Arg-1 and CD206) in microglia subjected to OGDR (0, 2, 6, and 12 h). n = 6; *P< 0.005 vs. control group; **P < 0.0001 vs. control group. g–l Expression levels of TNF-α, IL-1β, iNOS, and IL-6 protein in microglia pretreated with corresponding siRNAs. n = 6; *P < 0.001 vs. si-NC group; **P < 0.0001 vs. si-NC group. m–o Expression of p-RIP1/RIP1 and p-MLKL/MLKL in ECs co-cultured with different siRNA pretreated microglia under 12 h OGDR. n = 6; **P < 0.0001 vs. si-NC group. p ELISA analysis of TNF-α concentration in supernatants of microglia subjected to OGDR for 0, 2, 6, and 12 h. n = 6; *P< 0.005 vs. control group; **P< 0.0001 vs. control group. q Representative images of TNF-α (green) and Iba1(red) staining of rat brain sections from sham and tMCAO (12 h, 1 day, 3 day) groups. n = 3; scale bar: 100 μm. r Representative images of TNF-α (green) and Iba1(red) staining of microglia acutely isolated from peri-infarct area in sham and tMCAO (12 h, 1 day, 3 day). n = 3; scale bar: 100 μm
Fig. 5
Fig. 5. Reversed nuclear localization of NF-kB (P65) in microglia reduces microglia TNF-α expression and inhibits EC necroptosis in co-culture system under OGDR.
a, d Expression levels of p-IκBα/IκBα in cytoplasm (a, b) and NF-kB (p65) nuclear (c, d) from microglia subjected to 0, 2, 6, and 12 h OGDR. n = 6; *P< 0.05 vs. control group; **P< 0.01 vs. control group. ef Expression levels of NF-κB (p65) in microglia pretreated with or without BAY-117082 under OGDR. n = 6; *P = 0.0069 vs. vehicle group. g ELISA analysis for TNF-α show that BAY-117082 reduced TNF-α secretion from microglia under OGDR. n = 6; *P < 0.001 vs. control group; **P < 0.0001 vs. control group; #P < 0.0001 vs. vehicle group. h–k Representative images and statistical results of PI (red)/Hoechst (blue) staining and PI/annexin V flow cytometry of ECs treated with microglia (pretreated with BAY-117082 or vehicle) in co-culture system under OGDR. n = 6; *P< 0.01 vs. vehicle group; Scale bar: 100 μm. l–n Expression levels of p-RIP1/RIP1 and p-MLKL/MLKL in ECs from different group. n = 3; *P < 0.001 vs. control group; #P < 0.01 vs. vehicle group
Fig. 6
Fig. 6. Infliximab reduces necroptosis of ECs co-cultured with microglia after OGDR.
a–d Representative images and statistical results of PI (red)/Hoechst (blue) staining and PI/annexin V flow cytometry of ECs treated with or without infliximab (67 nM) in co-culture system under OGDR. n = 6; *P< 0.01 vs. vehicle group; Scale bar: 100 μm. e electron microscopy images of ECs show that co-cultured ECs treated with infliximab had relatively intact cytoplasmic membrane. n = 3; Scale bar: 2 μm (merged pictures) and 1 μm (magnified pictures). f–h Expression levels of p-RIP1/RIP1 and p-MLKL/MLKL in ECs treated with or without infliximab (67 nM) in co-culture system under OGDR. n = 3; *P < 0.05 vs. control group; **P < 0.01 vs. control group; #P < 0.05 vs. vehicle group
Fig. 7
Fig. 7. Infliximab provides protective effects against BBB disruption and I/R injury after stroke.
a Experimental scheme. b–d Endogenous protein expression of p-RIP1/RIP1 and p-MLKL/MLKL in ischemic lateral cortex after tMCAO (3 day) from different groups. n = 6; *P< 0.05 vs. Sham group; **P< 0.01 vs. control group; #P< 0.05 vs. vehicle group. e–g Representative MRI post-contrast T1-SE images and statistical BBB permeability represented by T1SI-diff and T1SI-diff × PBV of rat brains from each group. n = 6; *P< 0.001 vs. Sham group; #P< 0.01 vs. vehicle group. h, i Evans blue leakage of rat brains in coronal sections (h) and extravasation (μg/g tissue) (i) from each group. n = 3; *P< 0.001 vs. Sham group; #P< 0.01 vs. vehicle group. j–m Representative images and statistical results of TTC and MRI T2-SE imaging. n = 6 for MRI, n = 3 for TTC staining; #P< 0.01 vs. vehicle group. k) Modified neurological severity score from day 0 to day 7 after tMCAO in different groups. n = 6; *P< 0.05 vs. vehicle group
Fig. 8
Fig. 8. Schematic representation shows the role of infliximab in EC necroptosis after stroke.
a After ischemic reperfusion, microglia cells are activated and transform into the M1 type, mediating phosphorylation and nuclear translocation of NF-kB and initiating TNF-α transcription. Secreted TNF-α binds to TNF receptor on ECs, activating necroptosis and leading to BBB disruption. b Infliximab, a specific antibody against TNF-α, blocks the binding of TNF-α with TNF receptor and inhibits the necroptotic signaling, alleviating BBB disruption

References

    1. Benjamin EJ, et al. Heart disease and stroke statistics-2018 update: a report from the American Heart Association. Circulation. 2018;137:e67–e492. doi: 10.1161/CIR.0000000000000558. - DOI - PubMed
    1. Desilles JP, et al. Blood-brain barrier disruption is associated with increased mortality after endovascular therapy. Neurology. 2013;80:844–851. doi: 10.1212/WNL.0b013e31828406de. - DOI - PubMed
    1. Prakash R, Carmichael ST. Blood-brain barrier breakdown and neovascularization processes after stroke and traumatic brain injury. Curr. Opin. Neurol. 2015;28:556–564. doi: 10.1097/WCO.0000000000000248. - DOI - PMC - PubMed
    1. Ridder DA, et al. Brain endothelial TAK1 and NEMO safeguard the neurovascular unit. J Exp Med. 2015;212:1529–1549. doi: 10.1084/jem.20150165. - DOI - PMC - PubMed
    1. Lalaoui N, Lindqvist LM, Sandow JJ, Ekert PG. The molecular relationships between apoptosis, autophagy and necroptosis. Semin. Cell Dev. Biol. 2015;39:63–69. doi: 10.1016/j.semcdb.2015.02.003. - DOI - PubMed

Publication types

MeSH terms