. 2019 Jun 20;9(1):8886.
doi: 10.1038/s41598-019-45287-9.

Dual optical force plate for time resolved measurement of forces and pressure distributions beneath shoes and feet

Affiliations

Dual optical force plate for time resolved measurement of forces and pressure distributions beneath shoes and feet

Christopher G Tompkins et al. Sci Rep. .

Abstract

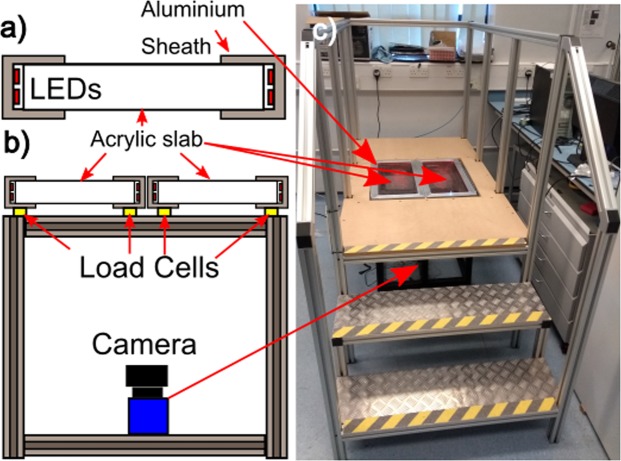
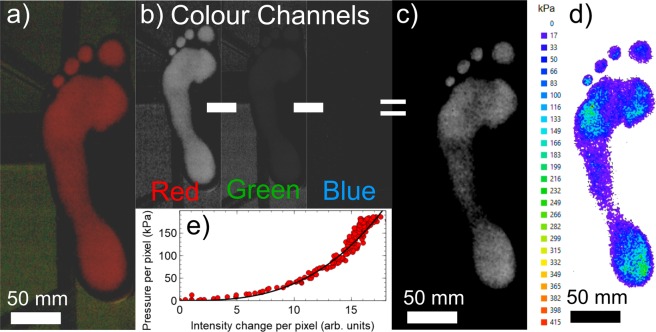
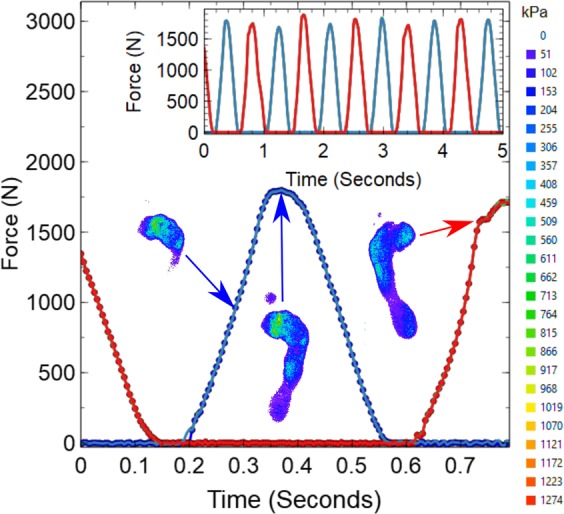
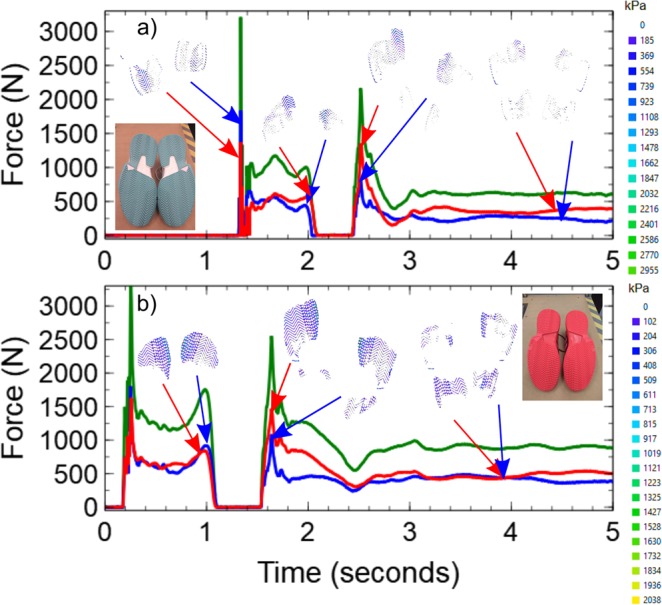
Frustrated total internal reflection (FTIR) imaging was used to perform remote optical measurements of the forces/pressures exerted beneath shoes and feet during a number of different training activities including countermovement jumps, jogging and drop jumps. A single camera was used to simultaneously image two acrylic, FTIR waveguide imaging elements from below, at frame rates up to 200 frames per second. The images obtained using the camera were converted into pressure/force maps using a previously developed theory which combines the mechanics of contact of soft objects and the scattering of evanescent waves. The forces obtained from the optical measurements were shown to be in good agreement with measurements obtained from load cells placed beneath the FTIR imaging elements. The ability to produce accurate spatial maps of the force/pressure distribution beneath soft contacting objects such as feet and shoe outsoles at high frame rates has numerous potential applications in sports sciences and medicine.


Conflict of interest statement

The authors declare no competing interests.

Figures

Figure 1
Figure 1
Construction of the dual platform imaging device. (a) Acrylic slabs were wrapped with ultrabright red LEDs and covered in an aluminium sheath to produce FTIR imaging elements. (b) Two of these slabs were mounted on a sturdy aluminium frame with load cells directly beneath them. A single camera was used to image the top surface of both platforms simultaneously. (c) The entire platform was mounted inside a larger, sturdy platform equipped with steps and handrails.
Figure 2
Figure 2
FTIR Image analysis. Colour images collected using the camera (panel a) are split into the corresponding red green and blue colour channels (panel b). The green and blue channels are subtracted from the red channel to remove the background to give the grayscale image in panel c). The grayscale image is then converted to the pressure map in panel d) using a pressure-intensity calibration curve similar to that shown in panel e). The solid line in panel e) shows a simple power law fit to the calibration data.
Figure 3
Figure 3
FTIR force data collected from a subject jogging on the spot barefoot. The main panel shows the variations in the total force applied to the platform under the left foot (blue) and the right foot (red) over a period of 0.8 seconds. The solid lines show data obtained using the load cells and the data points show the forces obtained by summing the pressures obtained from images similar to those shown in the insets. These images show the spatial variations in pressure beneath the feet at each time step (every 5 milliseconds). The legend on the far right of the figure gives the correspondence between colour and pressure in these images. The force-time curve shown in the inset shows the variation in the measured force over the entire duration of the experiment (5 seconds). A movie showing the evolution of the pressure distribution over the duration of the entire period is included in supplementary information (See SupplementaryMovie1.avi).
Figure 4
Figure 4
FTIR force data obtained during countermovement jumps. Data are shown for the force exerted on the platforms beneath the left (blue) and right (red) feet during a countermovement jump manoeuvre performed barefoot (panel a) and wearing shoes (panel b) both by the same subject. In both cases the force data are obtained by summing the pressures obtained from FTIR contact images (examples shown as insets). The total force exerted on both platforms (green) was obtained by summing the red and blue curves. The legends on the right hand side of the panels give the correspondence between the colour and pressure in the contact pressure map images shown as insets. The inset in panel b also shows a simple photograph of the tread pattern on the underside of the shoe. Examples of movies showing the variation in pressure over the entire duration of each experiment are provided as supplementary material (see SupplementaryMovie2a.avi and SupplementaryMovie2b.avi).
Figure 5
Figure 5
FTIR force data obtained during drop jumps. Data are shown for the force exerted on the platforms beneath the left (blue) and right (red) feet during a drop jump manoeuvre performed by a subject wearing shoes with blue outsoles (panel a) and a second subject wearing shoes with red outshoes (panel b). In both cases the force data are obtained by summing the pressures obtained from FTIR contact images (examples of which are shown as insets). The total force exerted on both platforms (green) was obtained by summing the red and blue curves. The legends on the right hand side of the panels give the correspondence between the colour and pressure in the contact pressure map images shown as insets. The inset in both panels also show simple photographs of the tread pattern on the underside of the shoes.

Similar articles

References

    1. Olivier A, Viseu J-P, Vignais N, Vuillerme N. Balance control during stance - A comparison between horseback riding athletes and non-athletes. PLoS ONE. 2019;14(2):e0211834. doi: 10.1371/journal.pone.0211834. - DOI - PMC - PubMed
    1. Cong Y, Lam WK, Cheung JT-M, Zhang M. In-shoe plantar tri-axial stress profiles during maximum-effort cutting maneuvers. Journal of Biomechanics. 2014;47(16):3799–3806. doi: 10.1016/j.jbiomech.2014.10.028. - DOI - PubMed
    1. Rajala S, Lekkala J. Plantar shear stress measurements — A review. Clinical Biomechanics. 2014;29(5):475–483. doi: 10.1016/j.clinbiomech.2014.04.009. - DOI - PubMed
    1. Duckworth T, Betts RP, Franks MDCI, Burke J. The Measurement of Pressures under the Foot. Foot & Ankle. 1982;3(3):130–141. doi: 10.1177/107110078200300303. - DOI - PubMed
    1. Fernando ME, et al. Plantar pressures are elevated in people with longstanding diabetes-related foot ulcers during follow-up. PLoS ONE. 2017;12(8):e0181916. doi: 10.1371/journal.pone.0181916. - DOI - PMC - PubMed

Publication types