. 2019 Jun 20;10(1):2723.
doi: 10.1038/s41467-019-10652-9.

Targeting enhancer switching overcomes non-genetic drug resistance in acute myeloid leukaemia

Affiliations

Targeting enhancer switching overcomes non-genetic drug resistance in acute myeloid leukaemia

Charles C Bell et al. Nat Commun. .

Abstract

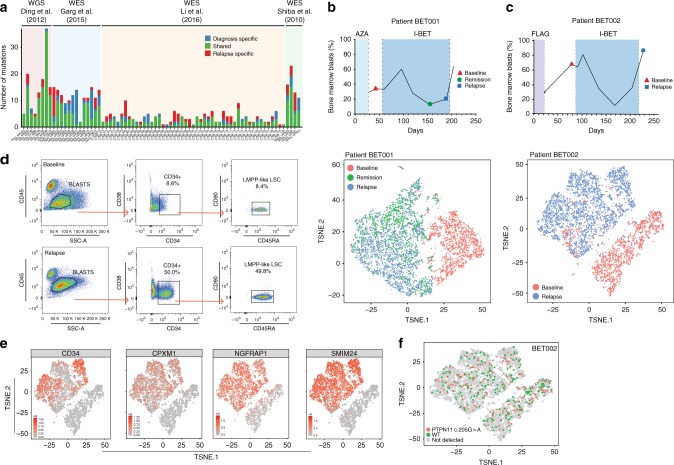
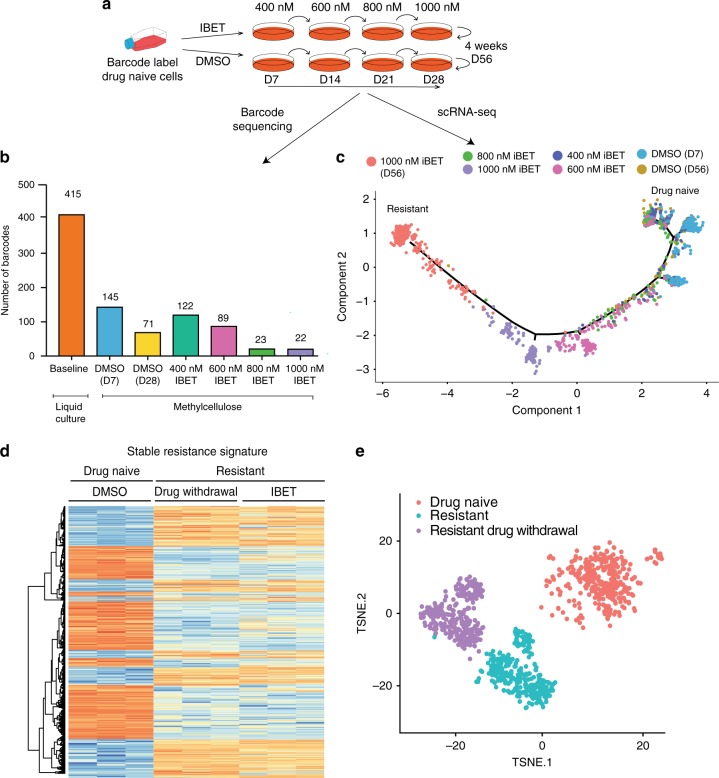
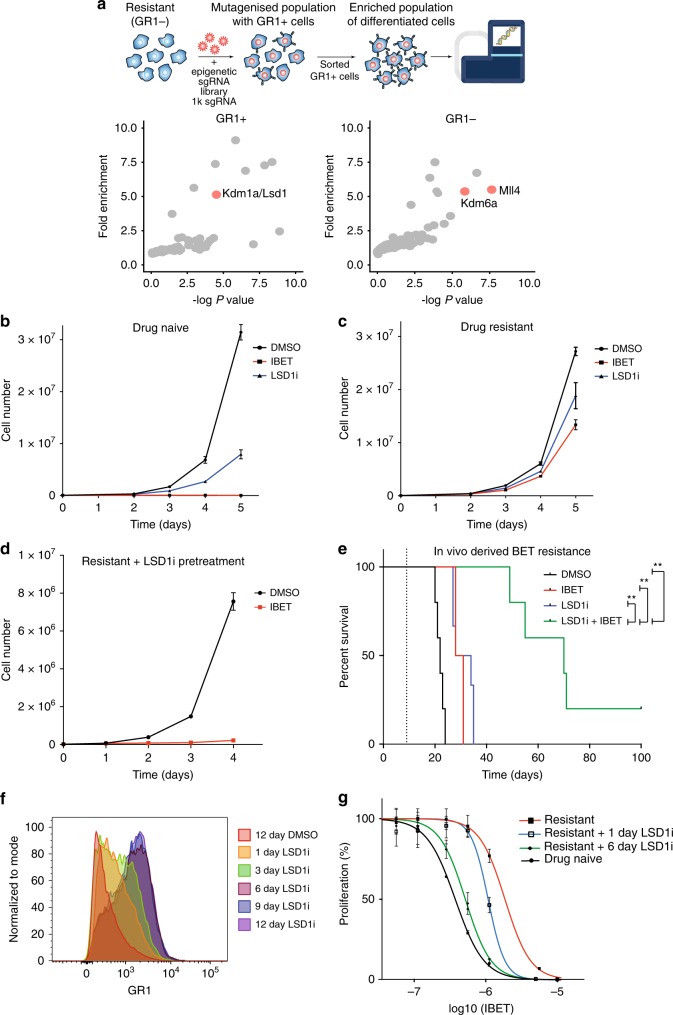
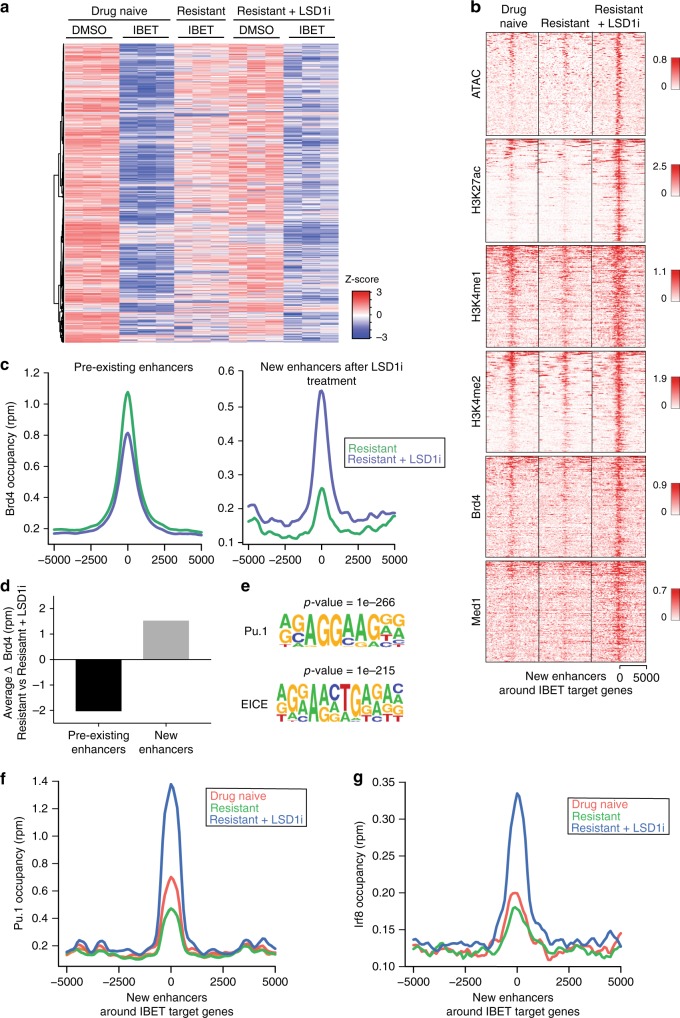
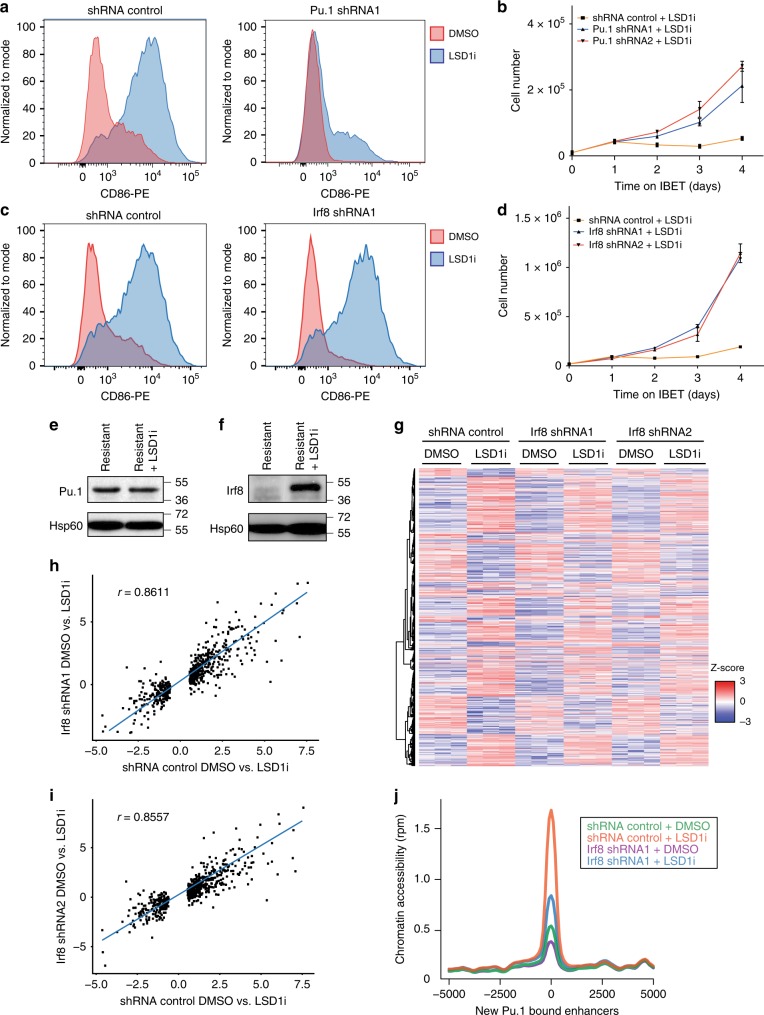
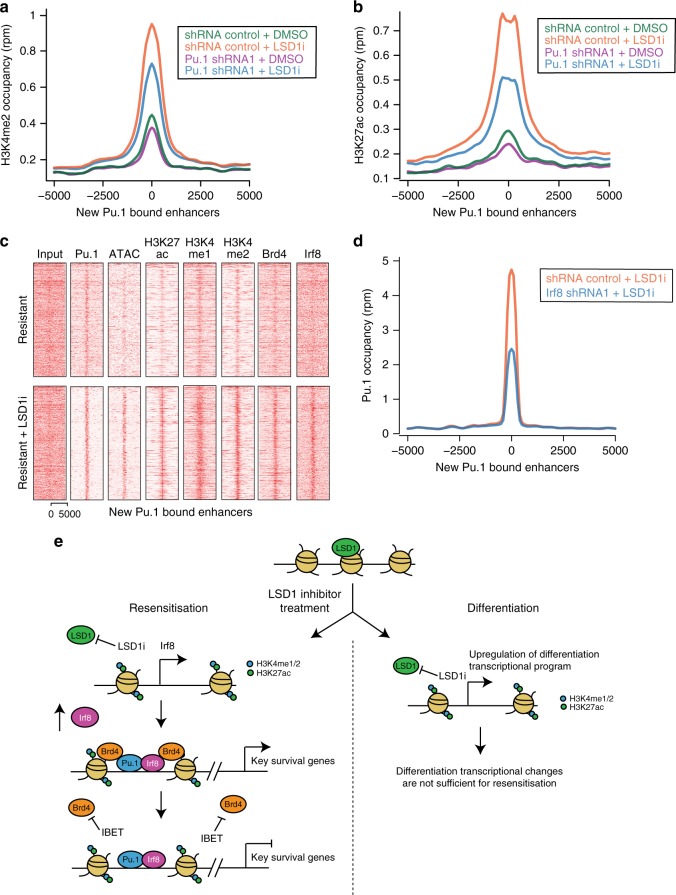
Non-genetic drug resistance is increasingly recognised in various cancers. Molecular insights into this process are lacking and it is unknown whether stable non-genetic resistance can be overcome. Using single cell RNA-sequencing of paired drug naïve and resistant AML patient samples and cellular barcoding in a unique mouse model of non-genetic resistance, here we demonstrate that transcriptional plasticity drives stable epigenetic resistance. With a CRISPR-Cas9 screen we identify regulators of enhancer function as important modulators of the resistant cell state. We show that inhibition of Lsd1 (Kdm1a) is able to overcome stable epigenetic resistance by facilitating the binding of the pioneer factor, Pu.1 and cofactor, Irf8, to nucleate new enhancers that regulate the expression of key survival genes. This enhancer switching results in the re-distribution of transcriptional co-activators, including Brd4, and provides the opportunity to disable their activity and overcome epigenetic resistance. Together these findings highlight key principles to help counteract non-genetic drug resistance.


Conflict of interest statement

B.E.K., O.B., H.P.M., R.G.K., A.D., N.K., and R.K.P. are employees of GlaxoSmithKline. M.A.D. has been a member of advisory boards for CTX CRC, Storm Therapeutics, Celgene and Cambridge Epigenetix. The remaining authors declare no competing interests.

Figures

Fig. 1
Fig. 1
Non-genetic adaptation drives clinical resistance in AML. a Meta-analysis from four independent studies analysing either the whole genome or whole exome of AML patients at diagnosis and relapse. Mutations are defined as non-synonymous changes within the coding sequence of any gene. Shared mutations are mutations present at both diagnosis and relapse. Whole exome sequencing data from Li et al. (REF 4) was analysed to access the mutations in known AML genes, as defined by the authors. b Schematic of the treatment regime and bone marrow blast percentage for patient BET001 over the clinical trial treatment course (top panel). t-SNE analysis of 7360 individual blast cells isolated from patient BET001 at baseline, remission and relapse (bottom panel). scRNA-seq and genomic DNA sampling points are highlighted on the schematic. c Schematic of treatment regime and bone marrow blast percentage for patient BET002 over the clinical trial treatment course (top panel). t-SNE analysis of 6349 single blast cells isolated from patient BET002 at baseline and relapse (bottom panel). scRNA-seq and genomic DNA sampling points are highlighted on the schematic. d Flow cytometry analysis of cells from patient BET002 at baseline and relapse identifies enrichment for LMPP-like LSCs at relapse based on CD34 + CD38-CD90-CD45RA + expression. Gating strategy is defined by boxes. e Expression analysis of selected LSC signature genes (defined in REF 15) in blast cells from patient BET002 overlaid onto the t-SNE plot. f Expression of mutant PTPN11 (c.205 G > A) and WT PTPN11 in blast cells from patient BET002 overlaid onto the t-SNE plot. Mutant PTPN11 transcripts were detected in 70 baseline blast cells and 112 relapse blast cells. WGS whole genome sequencing. WES whole exome sequencing, WGS whole genome sequencing, WES whole exome sequencing, AZA azacitidine, FLAG fludarabine, cytarabine and G-CSF
Fig. 2
Fig. 2
Transcriptional plasticity underpins stable non-genetic resistance to BET inhibitors. a Schematic highlighting experimental design for following the acquisition of IBET resistance. Drug naïve cells were barcoded in liquid culture and plated in methylcellulose. Cells were then re-plated weekly in either DMSO or escalating concentrations of IBET until they were growing in 1000 nM, where they were maintained for an additional 4 weeks. b Number of barcodes comprising 90% of total reads at first plating that are then serially retained at 90% of the total reads for every re-plating either in DMSO or IBET. Representative of two biological duplicates. c Pseudotemporal ordering of single drug naïve cells serially passaged in DMSO or increasing concentrations of IBET, as defined by the Monocle2 algorithm. Analysis was conducted based on differentially expressed genes between resistant versus drug naïve cells from bulk RNA-sequencing. d Bulk RNA-seq heatmap displaying the expression of genes from the stable resistance signature in drug naïve, resistant, and resistant cells withdrawn from IBET. This subset of genes were determined from finding the differentially expressed genes between drug naïve cells and resistant cells withdrawn from IBET for 6 days. e t-SNE analysis of 979 drug naïve cells, resistant cells and resistant cells withdrawn from IBET for 4 days
Fig. 3
Fig. 3
Inhibition of Lsd1 overcomes stable drug resistance in vitro and in vivo. a Epigenetic protein domain-focused CRISPR-Cas9 screen designed to identify epigenetic proteins that sustain the immature Gr1- resistant immunophenotype. Gr1 + cells were enriched by FACS 7 days after sgRNA transduction. GR1− enrichment was determined by the depletion of guides in the GR1 + population. Epigenetic proteins that regulate the enhancer modification H3K4me1/2 are highlighted in red. b Proliferation assay of drug naïve and (c) drug resistant cells treated with DMSO, IBET (1000 nM) or GSK-LSD1 (500 nM). Error bars represent S.E.M of 3 cell culture replicates. Representative of 3 biological replicates. d Proliferation assay of drug resistant cells pre-treated for 6 days with GSK-LSD1 (500 nM) followed by treatment with DMSO or IBET (1000 nM). Error bars represent S.E.M of 3 cell culture replicates. Representative of 3 biological replicates. e Kaplan–Meier curve of vehicle and drug treated mice transplanted with MLL-AF9 leukaemic cells serially re-transplanted (4 generations) in the presence of IBET treatment (20 mg/kg) to enrich for IBET-resistant leukaemia. n = 6 mice per group. Dotted line indicates the start of treatment. Dosing was performed by IP injection once a day at 20 mg/kg for IBET-151 and/or 0.5 mg/kg for GSK-LSD1. Log rank (Mantel-Cox) for DMSO versus LSD1i + IBET: p < 0.002, IBET versus LSD1i + IBET: p < 0.002 and LSD1i versus LSD1i + IBET: p < 0.002. f Flow cytometry analysis of Gr1 surface expression after treatment of drug resistant cells with GSK-LSD1i (500 nM) for the indicated durations. g Dose–response assay (IC50) to IBET of drug naïve, resistant cells and resistant cells pre-treated with GSK-LSD1i (500 nM) for either 1 or 6 days. Error bars represent S.E.M of 4 cell culture replicates
Fig. 4
Fig. 4
New enhancer formation overcomes therapeutic resistance by reestablishing a targetable dependency. a RNA-seq heatmap displaying the response of genes downregulated in drug naïve cells after 6 h of IBET (1000 nM) treatment. This core subset of genes underpins the functional effects of IBET that result in the loss of viability of the drug naïve cells. Also shown here is the expression of these genes in cells stably resistant to 1000 nM of IBET and resistant cells treated for 6 days with GSK-LSD1i (500 nM) followed by treatment with DMSO or IBET (1000 nM) for 6 h. b Heatmap of chromatin accessibility and ChIP-seq occupancy for the specified proteins at the newly activated enhancer elements that form after 6 days GSK-LSD1i (500 nM) treatment of the resistant cells. These new enhancer elements are within ( + /−) 50 kb of the transcriptional start site (TSS) of the genes shown in (a). New enhancers are defined by ATAC-seq peaks that show a > 4-fold increase in H3K27ac. The heatmap is centered to display 5 kb either side of the ATAC-seq summit. c Average profile of Brd4 occupancy at pre-existing and new enhancers for the genes shown in (a). Pre-existing enhancers are defined as H3K27ac peaks in the resistant cells within 50 kb of the TSS of the genes in (a). New enhancers are sites within 50 kb of the TSS of the gene that show a > 4-fold change increase in H3K27ac after cells are treated for 6 days with GSK-LSD1i (500 nM). d Quantification of change in Brd4 occupancy at pre-existing and new enhancers displayed in (c). e De novo motif analysis of all newly activated enhancers (ATAC-seq peaks with > 4-fold increase in H3K27ac) after 6 days GSK-LSD1i (500 nM) treatment. f Average profile of Pu.1 and g Irf8 chromatin occupancy at the newly activated enhancer elements shown in (b) in drug naïve, resistant and resistant cells treated for 6 days with GSK-LSD1i (500 nM)
Fig. 5
Fig. 5
Enhancer remodeling mediated by Pu.1 and Irf8 is required for resensitisation, rather than LSD1i-mediated differentiation. a Flow cytometry of CD86 expression in the resistant cells expressing shRNA_control and shRNA_Pu.1. The shRNA expressing resistant cells were treated for 6 days with DMSO or GSK-LSD1i (500 nM). b Proliferation assay of shRNA_control and shRNA_Pu.1 resistant cells pre-treated for 6 days with GSK-LSD1 (500 nM) followed by treatment with DMSO or IBET (1000 nM). Error bars represent S.E.M of 3 cell culture replicates. Representative of 3 biological replicates. c Flow cytometry of CD86 expression in shRNA_control and shRNA_Irf8 cells treated for 6 days with DMSO or GSK-LSD1i (500 nM). d Proliferation assay of shRNA_control and shRNA_Irf8 resistant cells pre-treated for 6 days with GSK-LSD1 (500 nM) followed by treatment with DMSO or IBET (1000 nM). Error bars represent S.E.M of 3 cell culture replicates. Representative of 3 biological replicates. e Western blot of Pu.1 levels in resistant cells and resistant cells treated for 6 days with GSK-LSD1i (500 nM). f Western blot of Irf8 levels in resistant cells and resistant cells treated for 6 days with GSK-LSD1i (500 nM). g RNA-seq heatmap displaying the LSD1i associated gene expression changes in shRNA_control and shRNA_Irf8 resistant cells treated for 6 days with DMSO or GSK-LSD1i (500 nM). LSD1i-associated gene expression changes defined as genes that are differentially expressed upon 6 days GSK-LSD1i (500 nM) treatment in shRNA_control resistant cells. h Scatter-plot displaying the fold change of the LSD1i associated gene expression changes (defined in g) in shRNA_control and Irf8_shRNA1 resistant cells. i Scatter-plot displaying the fold change of the LSD1i associated gene expression changes (defined in g) in shRNA_control and Irf8_shRNA2 resistant cells. j Average profile of chromatin accessibility at the newly formed Pu.1 bound enhancers in shRNA_control and Irf8_shRNA1 resistant cells treated with DMSO or GSK-LSD1i for 6 days
Fig. 6
Fig. 6
Irf8 stabilises low-level Pu.1 occupancy to drive new enhancer formation. a Average profile of H3K4me2 occupancy in shRNA_control and Pu.1_shRNA1 resistant cells at sites of increased Pu.1 binding (>4-fold increase) after 6 days treatment with either DMSO or GSK-LSD1i (500 nM). b Average profile of H3K27ac occupancy in shRNA_control and Pu.1_shRNA1 resistant cells at sites of increased Pu.1 binding (>4-fold increase) after 6 days treatment with either DMSO or GSK-LSD1i (500 nM). c Heatmap of chromatin accessibility and ChIP-seq occupancy for the specified proteins at activated Pu.1 bound enhancers in the resistant cells before and after 6 days treatment with GSK-LSD1i (500 nM). d Average profile of Pu.1 occupancy at the newly formed Pu.1 bound enhancers in shRNA_control and Irf8_shRNA1 resistant cells treated with DMSO or GSK-LSD1i for 6 days. e Schematic diagram summarizing the divergent molecular mechanisms underpinning differentiation and re-sensitization of the resistant cells after LSD1i treatment

Similar articles

Cited by

References

    1. Ding L, et al. Clonal evolution in relapsed acute myeloid leukaemia revealed by whole-genome sequencing. Nature. 2012;481:506–510. doi: 10.1038/nature10738. - DOI - PMC - PubMed
    1. Garg M, et al. Profiling of somatic mutations in acute myeloid leukemia with FLT3-ITD at diagnosis and relapse. Blood. 2015;126:2491–2501. doi: 10.1182/blood-2015-05-646240. - DOI - PMC - PubMed
    1. Shiba N, et al. Whole-exome sequencing reveals the spectrum of gene mutations and the clonal evolution patterns in paediatric acute myeloid leukaemia. Br. J. Haematol. 2016;175:476–489. doi: 10.1111/bjh.14247. - DOI - PubMed
    1. Li S, et al. Distinct evolution and dynamics of epigenetic and genetic heterogeneity in acute myeloid leukemia. Nat. Med. 2016;22:792–799. doi: 10.1038/nm.4125. - DOI - PMC - PubMed
    1. Holohan C, Van Schaeybroeck S, Longley DB, Johnston PG. Cancer drug resistance: an evolving paradigm. Nat. Rev. Cancer. 2013;13:714–726. doi: 10.1038/nrc3599. - DOI - PubMed

Publication types

MeSH terms