. 2019 Jun 20;10(1):2719.
doi: 10.1038/s41467-019-10656-5.

Establishing microbial composition measurement standards with reference frames

Affiliations

Establishing microbial composition measurement standards with reference frames

James T Morton et al. Nat Commun. .

Abstract

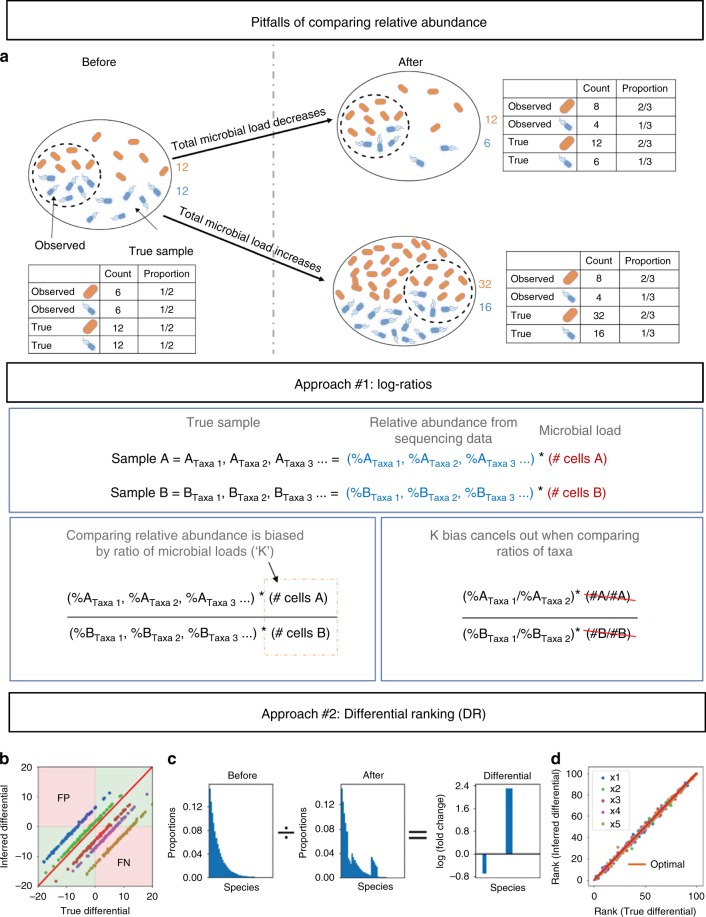
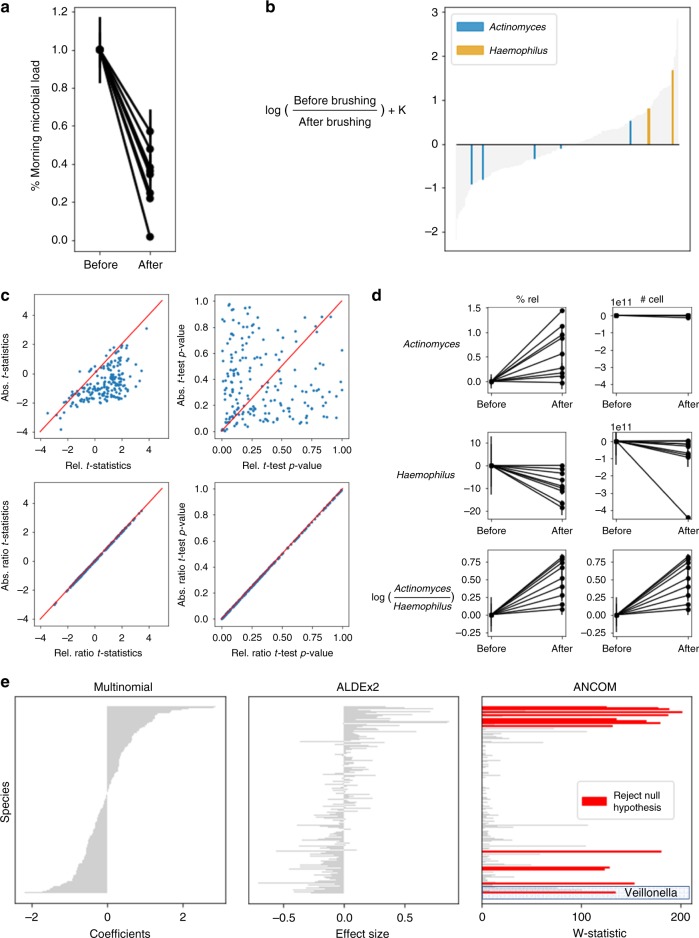
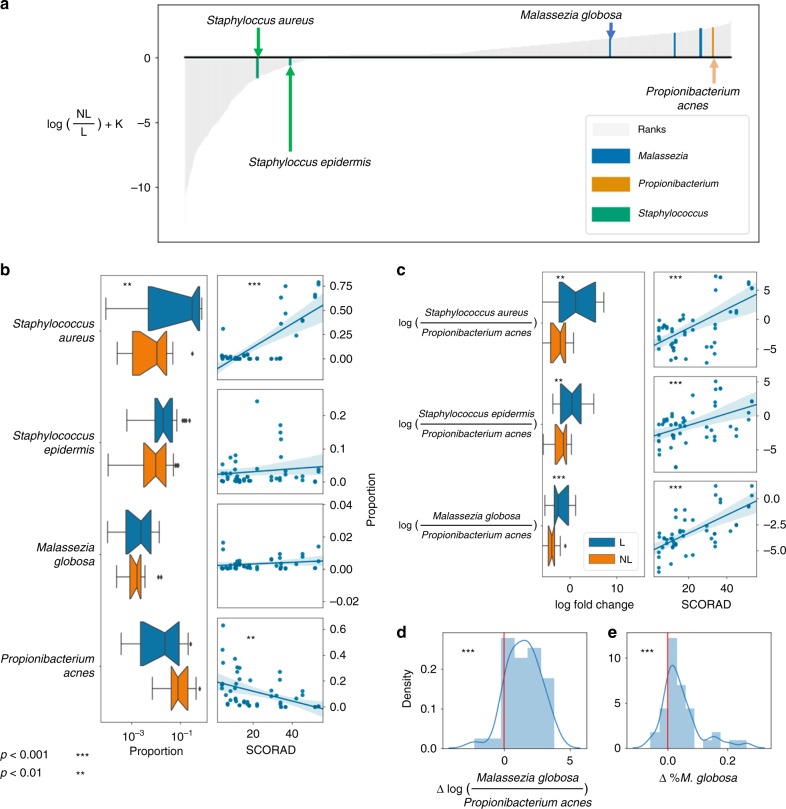
Differential abundance analysis is controversial throughout microbiome research. Gold standard approaches require laborious measurements of total microbial load, or absolute number of microorganisms, to accurately determine taxonomic shifts. Therefore, most studies rely on relative abundance data. Here, we demonstrate common pitfalls in comparing relative abundance across samples and identify two solutions that reveal microbial changes without the need to estimate total microbial load. We define the notion of "reference frames", which provide deep intuition about the compositional nature of microbiome data. In an oral time series experiment, reference frames alleviate false positives and produce consistent results on both raw and cell-count normalized data. Furthermore, reference frames identify consistent, differentially abundant microbes previously undetected in two independent published datasets from subjects with atopic dermatitis. These methods allow reassessment of published relative abundance data to reveal reproducible microbial changes from standard sequencing output without the need for new assays.


Conflict of interest statement

The authors declare no competing interests.

Figures

Fig. 1
Fig. 1
Illustration demonstrating statistical limitations inherent in compositional datasets. a Two different biological scenarios can yield the exact same proportions of taxa in samples from a population pre- and post-treatment. b Simulated datasets plotting the true differential obtained using absolute abundance data on the x-axis, versus the inferred differential obtained using relative abundance data on the y-axis. Each dot represents a taxon in the dataset, and the colors represent datasets with various ratios of total microbial load (K) between before and after samples. The red line represents the optimal scenario where the samples have equal microbial load. This illustrates the prevalence of either false positives (FP) or false negatives (FN) when performing differential abundance analysis on samples with unequal total microbial load. The presence of either FPs or FNs is dictated by a nonlinear function of the true differential (see online methods). c An illustration of differential proportions of bacterial species before and after treatment. d Same data as b but plotting the rank of the differentials, demonstrating that ranks are equivalent regardless of differences in microbial load
Fig. 2
Fig. 2
Analysis of salivary microbiota before and after brushing teeth. a Flow-cytometry-quantified microbial load in unstimulated saliva collected for 5 min normalized to before brushing teeth. Each line corresponds to a different volunteer. Error bars represent the standard deviation from duplicate flow-cytometry measurements. b Microbial ranks estimated from multinomial regression with Actinomyces and Haemophilus highlighted. The y-axis represents the log-fold change that is known up to some bias constant K, and the x-axis numerically orders the ranks of each taxa in the analysis. c A comparison of t-statistics (left) and p-values (right) between before and after samples where each dot is an individual taxon (top graphs) or ratio between each taxon to Actinomyces (bottom graphs) calculated from relative abundance data (x-axis) and absolute abundance data (y-axis). The 1-1 correspondence in the ratio graphs is a result of the microbial loads cancelling out, as described in Eq. (3). d A comparison of relative abundance vs absolute abundance data of Actinomyces, Haemophilus and log(Actinomyces: Haemophilus) before and after brushing teeth. Error bars represent standard error of the mean. e Comparison of the multinomial coefficients used for DR, ALDEx2 and ANCOM outputs. The test statistics generated from ALDEx2 and ANCOM are sorted in the same order as the multinomial coefficients to provide a consistent comparison. All taxa that passed the significance tests are highlighted in red
Fig. 3
Fig. 3
DR analysis of skin in two atopic dermatitis studies. Panels ac represent data from Byrd et al., and panels d, e represent data from Leung et al.. Both studies compare lesioned (L) to non-lesioned (NL) skin. a Microbial ranks estimated from multinomial regression applied to shotgun metagenomics from Byrd et al. with key genera highlighted. The y-axis represents the log-fold change that is known up to some bias constant K. b Proportions of S. aureus, S. epidermidis, M. globosa, and P. acnes in lesioned (blue) and non-lesioned (orange) skin (left) and correlation of relative abundance with SCORAD score (right). c Log-ratios of (S. aureus: P. acnes), (S. epidermidis: P. acnes), and (M. globosa: P. acnes) (left) and correlation of ratio with SCORAD score (right). Error bars represent standard deviation across participants (n = 20). d Change in log-ratio of (M. globosa: P. acnes) from Leung et al.. e Change in relative abundance of M. globosa between lesioned and non-lesioned skin from Leung et al.. Presented p-values are from paired t-test statistics
Fig. 4
Fig. 4
DR analysis of the Central Park dataset. a Microbes ranked with respect to their association with nitrogen. b Microbes ranked with respect to their association with pH. Putative hits against an acidophile, an ammonia oxidizer and a nitrogen reducer are highlighted

Comment in

Similar articles

Cited by

References

    1. Weiss SJ, et al. Effects of library size variance, sparsity, and compositionality on the analysis of microbiome data. Peer J. 2015;3:e1408. doi: 10.7717/peerj.1408. - DOI - PMC - PubMed
    1. Love MI, Huber W, Anders S. Moderated estimation of fold change and dispersion for RNA-seq data with DESeq2. Genome Biol. 2014;15:550. doi: 10.1186/s13059-014-0550-8. - DOI - PMC - PubMed
    1. Paulson JN, Stine OC, Bravo HC, Pop M. Differential abundance analysis for microbial marker-gene surveys. Nat. Methods. 2013;10:1200–1202. doi: 10.1038/nmeth.2658. - DOI - PMC - PubMed
    1. Russel, J. et al. Datest: a framework for choosing differential abundance or expression method. Preprint at bioRxiv 10.1101/241802v 1241802 (2018).
    1. Hawinkel, S., Mattiello, F., Bijnens, L. & Thas, O. A broken promise: microbiome differential abundance methods do not control the false discovery rate. Brief. Bioinform. 20, 210–221 (2017). - PubMed

Publication types

Substances