. 2019 Jun 20;9(1):8924.
doi: 10.1038/s41598-019-45331-8.

Soybean (Glycine max L.) triacylglycerol lipase GmSDP1 regulates the quality and quantity of seed oil

Affiliations

Soybean (Glycine max L.) triacylglycerol lipase GmSDP1 regulates the quality and quantity of seed oil

Masatake Kanai et al. Sci Rep. .

Abstract

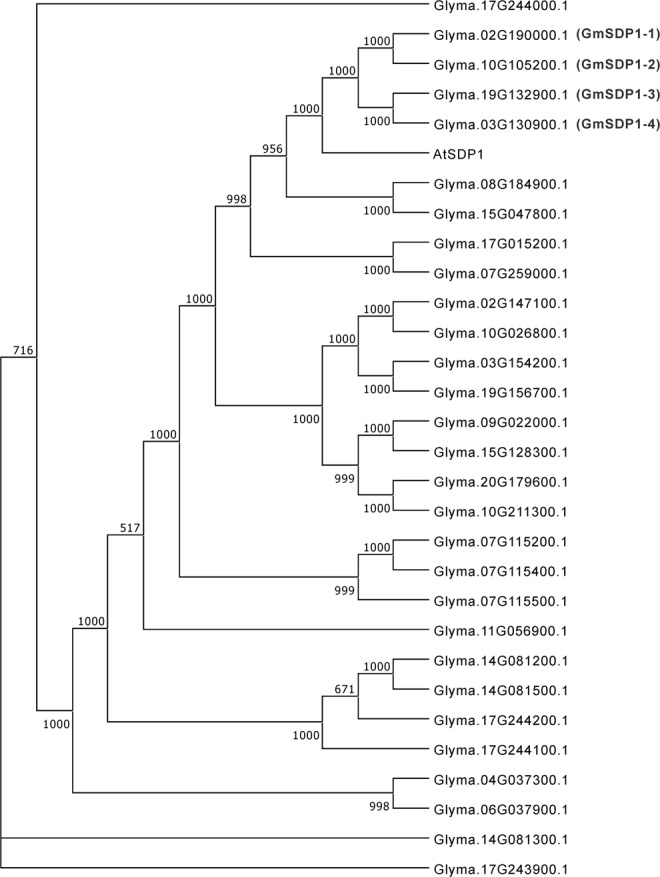
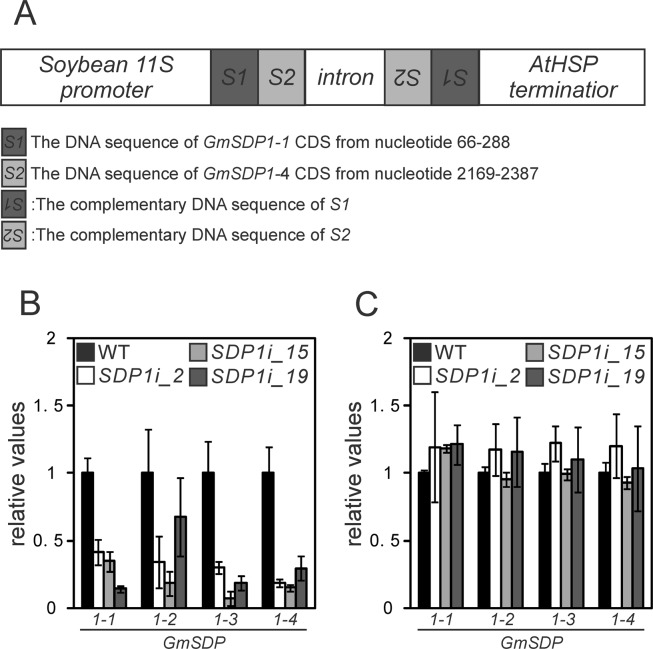
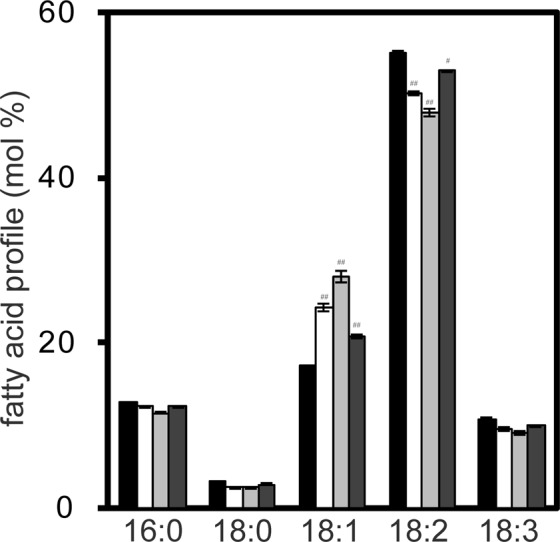
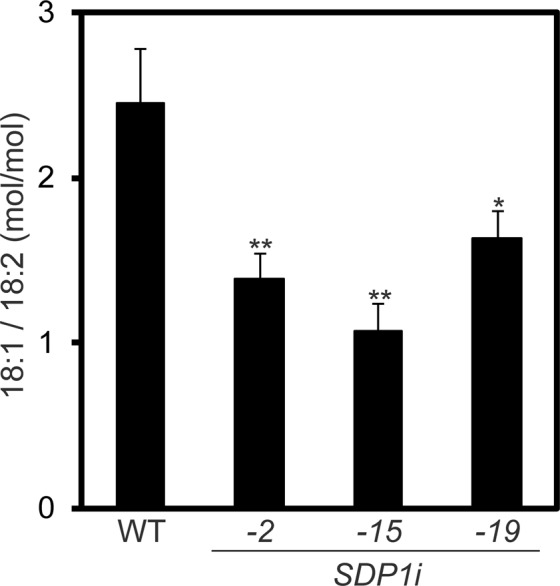
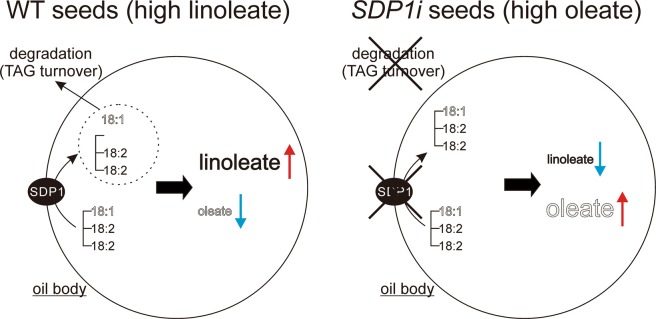
Seeds of soybean (Glycine max L.) are a major source of plant-derived oils. In the past, improvements have been made in the quantity and quality of seed oil. Triacylglycerols (TAGs) are the principal components of soybean seed oil, and understanding the metabolic regulation of TAGs in soybean seeds is essential. Here, we identified four soybean genes encoding TAG lipases, designated as SUGAR DEPENDENT1-1 (GmSDP1-1), GmSDP1-2, GmSDP1-3 and GmSDP1-4; these are homologous to Arabidopsis thaliana SDP1 (AtSDP1). To characterize the function of these genes during grain filling, transgenic lines of soybean were generated via RNA interference to knockdown the expression of all four GmSDP1 genes. The seed oil content of the transgenic soybean lines was significantly increased compared with the wild type (WT). Additionally, fatty acid profiles of the WT and transgenic soybean lines were altered; the content of linoleic acid, a major fatty acid in soybean seeds, was significantly reduced, whereas that of oleic acid was increased in transgenic soybean seeds compared with the WT. Substrate specificity experiments showed that TAG lipase preferentially cleaved oleic acid than linoleic acid in the oil body membrane in WT soybean. This study demonstrates that the GmSDP1 proteins regulate both the TAG content and fatty acid composition of soybean seeds during grain filling. These results provide a novel strategy for improving both the quantity and quality of soybean seed oil.


Conflict of interest statement

The authors declare no competing interests.

Figures

Figure 1
Figure 1
Phylogenetic analysis of the triacylglycerol (TAG) lipase in Arabidopsis thaliana (AtSDP1) and 29 lipases containing patatin-like phospholipase domain in soybean. Amino acid sequences of all proteins were obtained from Phytozome v12.1.6. Phylogenetic analysis was performed using MEGA7. Bootstrap values were determined based on 1,000 repetitions.
Figure 2
Figure 2
Quantitative analysis of GmSDP1-1, GmSDP1-2, GmSDP1-3 and GmSDP1-4 expression levels during seed germination and development. Expression levels of GmSDP1-1, 1-2, 1-3 and 1-4 were measured via quantitative real-time PCR (qRT-PCR) analysis during germination (A) and seed development (B). The GmEF1b gene was used as an internal control. Standard curves were generated with plasmids containing GmSDP1-1, 1-2, 1-3, 1-4 or GmEF1b cDNA. Values represent mean ± standard deviation (SD) of three independent experiments.
Figure 3
Figure 3
Establishment and characterisation of GmSDP1 knockdown lines in soybean. (A) Schematic diagrams of the RNAi construct used for GmSDP1 knockdown. (B,C) qRT-PCR analysis of relative expression levels of GmSDP1-1, 1-2, 1-3 and 1-4 in seeds at 35 DAF (B) and 3-day-old seedlings (C) of the WT and transgenic lines. GmEF1b was used as an internal control. Standard curves were generated using plasmids containing GmSDP1-1, 1-2, 1-3, 1-4 or GmEF1b cDNA. Values represent mean ± SD of three independent experiments.
Figure 4
Figure 4
Productivity of GmSDP1 knockdown lines. (A) Images of WT and transgenic SDP1i-15 seeds. Scale bars = 0.5 mm. (B) Weight of transgenic seeds. Values represent mean ± SD of three independent experiments with 130–150 seeds harvested from individual plants. Significant difference between WT and transgenic lines was determined using Student’s t-test and is denoted as **(P < 0.05). (C) Seed numbers harvested from transgenic lines. Values represent mean ± SD of three individual plants. (D) Seed yield of transgenic lines. Values represent mean ± SD of three individual plants. Significant difference between WT and transgenic lines was determined using Student’s t-test and is denoted as *(P < 0.1) or **(P < 0.05). (E) Fatty acid (FA) concentrations in seeds of transgenic lines measured via gas chromatography–mass spectrometry (GC–MS). Values represent mean ± SD of three independent experiments, with 20 seeds per experiment. Significant difference between WT and transgenic plants determined using Student’s t-test is denoted as **(P < 0.05). (F) Oil yield of transgenic lines estimated from the seed yield and FA concentration. Values represent mean ± SD of three individual plants. Significant difference between WT and transgenic lines determined using Student’s t-test is denoted as *(P < 0.1) or **(P < 0.05).
Figure 5
Figure 5
Fatty acid profiles of GmSDP1 knockdown lines. Fatty acid profiles of TAGs extracted from mature seeds. TAGs were extracted from seeds using thin layer chromatography (TLC). Fatty acid profiles of TAGs were measured via GC–MS. Values represent mean ± SD of three independent experiments, with 20 seeds per experiment. Significant difference between WT and transgenic plants determined using Student’s t-test is denoted as ##(P < 0.01) or ###(P < 0.001).
Figure 6
Figure 6
Substrate specificity of TAG lipase in oil body membranes in soybean. Substrate preference of TAG lipase was determined using oil body membranes isolated from seeds at 35 DAF. The isolated membranes were incubated with a TAG mixture (triolein:trilinolein = 1:1). Fatty acids released from the TAG mixture were analysed by GC–MS. The amounts of the isolated membranes were normalized to total protein contents. Values represent mean ± SD of three independent experiments, with 5 seeds per experiment. Significant difference between WT and transgenic plants determined using Student’s t-test is denoted as *(P < 0.1) or **(P < 0.05).
Figure 7
Figure 7
Schematic representation of GmSDP1 function in soybean seeds.

Similar articles

Cited by

References

    1. Durrett TP, Benning C, Ohlrogge J. Plant triacylglycerols as feedstocks for the production of biofuels. Plant J. 2008;54:593–607. doi: 10.1111/j.1365-313X.2008.03442.x. - DOI - PubMed
    1. Dyer JM, Stymne S, Green AG, Carlsson AS. High-value oils from plants. Plant J: for cell and molecular biology. 2008;54:640–655. doi: 10.1111/j.1365-313X.2008.03430.x. - DOI - PubMed
    1. Baud S, Lepiniec L. Physiological and developmental regulation of seed oil production. Prog Lipid Res. 2010;49:235–249. doi: 10.1016/j.plipres.2010.01.001. - DOI - PubMed
    1. Cahoon EB, et al. Engineering oilseeds for sustainable production of industrial and nutritional feedstocks: solving bottlenecks in fatty acid flux. Curr Opin Plant Biol. 2007;10:236–244. doi: 10.1016/j.pbi.2007.04.005. - DOI - PubMed
    1. Chapman KD, Ohlrogge JB. Compartmentation of triacylglycerol accumulation in plants. J Biol Chem. 2012;287:2288–2294. doi: 10.1074/jbc.R111.290072. - DOI - PMC - PubMed

Publication types