. 2019 Jun 20;10(1):2717.
doi: 10.1038/s41467-019-10684-1.

Brain leptin reduces liver lipids by increasing hepatic triglyceride secretion and lowering lipogenesis

Affiliations

Brain leptin reduces liver lipids by increasing hepatic triglyceride secretion and lowering lipogenesis

Martina Theresa Hackl et al. Nat Commun. .

Abstract

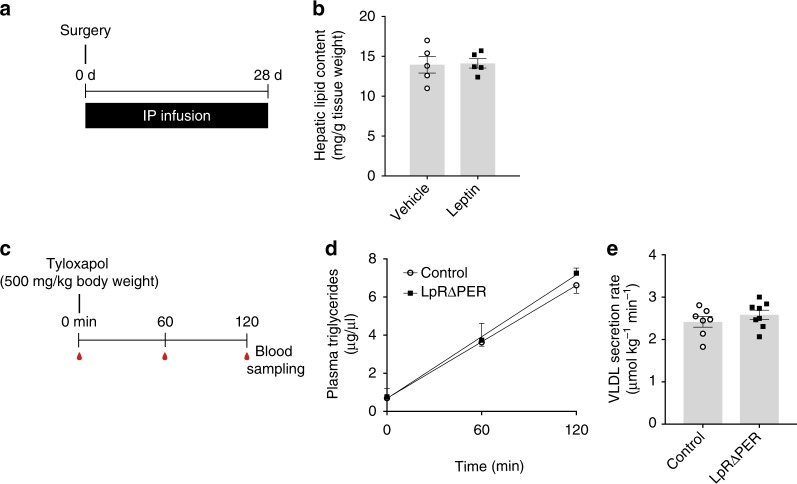
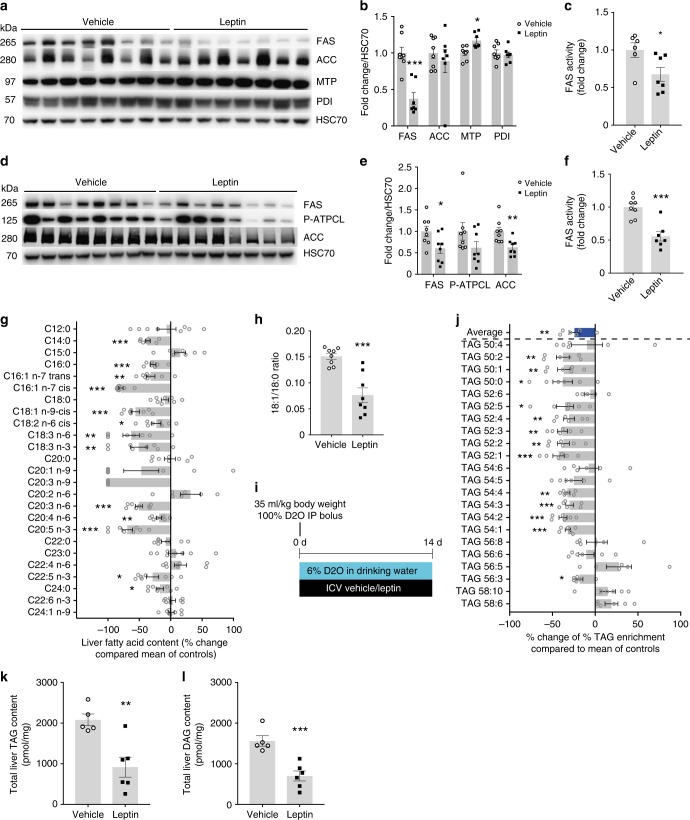
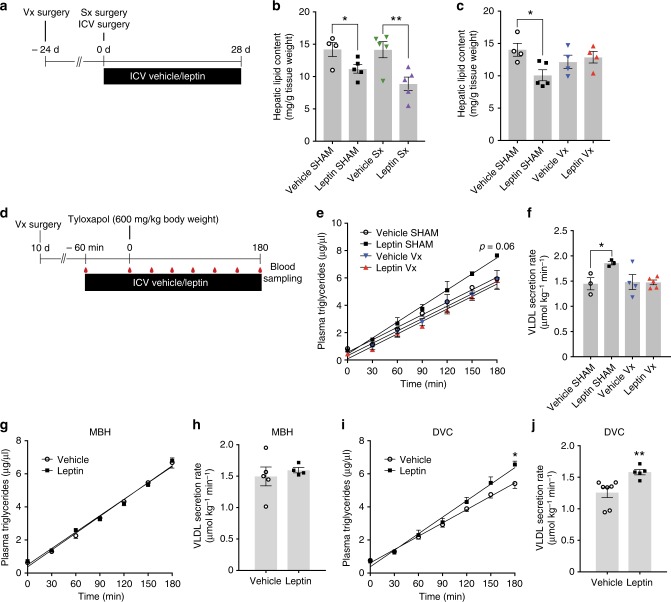
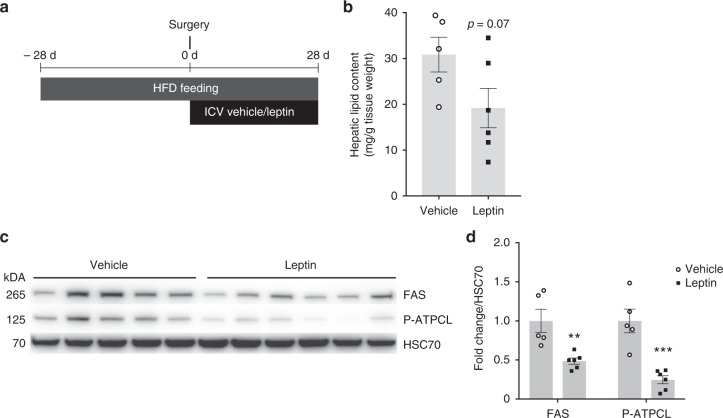
Hepatic steatosis develops when lipid influx and production exceed the liver's ability to utilize/export triglycerides. Obesity promotes steatosis and is characterized by leptin resistance. A role of leptin in hepatic lipid handling is highlighted by the observation that recombinant leptin reverses steatosis of hypoleptinemic patients with lipodystrophy by an unknown mechanism. Since leptin mainly functions via CNS signaling, we here examine in rats whether leptin regulates hepatic lipid flux via the brain in a series of stereotaxic infusion experiments. We demonstrate that brain leptin protects from steatosis by promoting hepatic triglyceride export and decreasing de novo lipogenesis independently of caloric intake. Leptin's anti-steatotic effects are generated in the dorsal vagal complex, require hepatic vagal innervation, and are preserved in high-fat-diet-fed rats when the blood brain barrier is bypassed. Thus, CNS leptin protects from ectopic lipid accumulation via a brain-vagus-liver axis and may be a therapeutic strategy to ameliorate obesity-related steatosis.


Conflict of interest statement

The authors declare no competing interests.

Figures

Fig. 1
Fig. 1
Brain leptin signaling increases liver TG secretion and reduces hepatic steatosis. a Protocol for acute ICV leptin infusion experiments. b Plasma TG accumulation in ICV leptin/vehicle-infused rats after a tyloxapol bolus injection (Leptin: 1 µg/h; n ≥ 12 per group). c VLDL secretion rate calculated from the slopes depicted in Fig. 1b. d Western blot of ApoB100 and ApoB48 in plasma samples at timepoint 180 min from acute ICV leptin/vehicle infusion experiments. e Quantification of the Western blot analysis from Fig. 1d (n ≥ 7 per group). f Protocol for chronic ICV leptin/vehicle experiments. g Body weights and h hepatic lipid content assessed by 1H-MRS after 28 days of chronic ICV leptin/vehicle infusion (Leptin: 0.3 µg/day). i Western blot analysis of ApoB100 and ApoB48 from plasma after chronic leptin/vehicle infusion collected at the end of the experiment. j Quantification of the Western blot analysis in Fig. 1i (n = 8 per group). k Relative changes compared to baseline in hepatic lipid content after 28 days of chronic ICV leptin/vehicle infusion. l Protocol for chronic ICV leptin receptor antagonist experiments. m Relative changes in hepatic lipid content assessed by 1H-MRS during 28 days of blocking endogenous leptin signaling with an ICV infused peptide leptin receptor antagonist (Leptin receptor antagonist: 6 µg/day; n = 5 per group). All data are mean ± SEM; *p < 0.05; **p < 0.01; vs vehicle group by two-tailed Student’s t test; open circles: ICV vehicle; black squares: ICV leptin except for (m): ICV leptin receptor antagonist
Fig. 2
Fig. 2
Leptin effects on hepatic lipid metabolism are centrally mediated. a Protocol for chronic IP leptin infusion in rats (Leptin: 0.3 µg/day; same dose used in the ICV experiments; Fig. 1f). b Hepatic lipid content after 28 days IP leptin/vehicle infusion (n = 5 per group). c Protocol for tyloxapol infusion experiments in tamoxifen-inducible LpRΔPER and control mice. d Plasma TG accumulation after a tyloxapol bolus in 6 h-fasted LpRΔPER and controls (≥ 7 per group). e Hepatic VLDL secretion rate calculated from the slope in Fig. 2d. All data are mean ± SEM; no significant differences observed between leptin and control by two-tailed Student’s t test; (b) open circles: IP vehicle; black squares: IP leptin; (d, e) open circles: controls; black squares: tamoxifen-inducible leptin receptor knockout (LpRΔPER) mice
Fig. 3
Fig. 3
CNS leptin suppresses hepatic de novo lipogenesis. a Western blots for FAS, ACC, MTP and PDI of livers from acute ICV leptin infusion experiments (Fig. 1a). b Quantification of the Western blot analyses from Fig. 3a (n ≥ 7 per group). c Liver FAS activity after acute ICV leptin/vehicle infusion (n ≥ 6 per group). d Western blot analyses from liver tissue lysates of chronic leptin/vehicle infusion experiments (Fig. 1f). e Quantification of the Western blot analyses in Fig. 3d. f Liver FAS activity after chronic leptin/vehicle infusion (n = 8 per group). g Fatty acid profiles from liver tissues harvested on day 28 after chronic leptin or vehicle infusion (n = 8 per group). h SCD1 activity index calculated by the ratio of 18:1 (oleic acid) / 18:0 (stearic acid) from the fatty acid profiles in Fig. 3g. i Protocol for chronic 2-week infusion experiments with 6% D2O in drinking water. j De novo lipogenesis (DNL) triacylglyceride (TAG) species measured in liver tissues harvested after 2 weeks of chronic ICV leptin or vehicle infusion (n ≥ 5 per group). In Fig. 3g and j data are depicted as % change vs vehicle-infused animals. k, l Hepatic TAG (k) and DAG (l) content (n ≥ 5 per group). All other data are mean ± SEM; *p < 0.05; **p < 0.01; ***p < 0.001 vs vehicle group by two-tailed Student’s t test; open circles: ICV vehicle; black squares: ICV leptin
Fig. 4
Fig. 4
ICV leptin requires intact vagal innervation to regulate hepatic lipid metabolism. a Study timeline for chronic ICV leptin/vehicle infusion studies after selective hepatic sympathectomy (Sx) or vagotomy (Vx). b, c Hepatic lipid content after selective hepatic sympathectomy (n ≥ 4 per group) (b) and liver vagotomy (n ≥ 4 per group) (c) after 28 days of continuous ICV leptin/vehicle infusion (Leptin: 0.3 µg/day). d Study timeline and protocol for tyloxapol infusion studies in rats with hepatic vagotomy that received a 4 h ICV leptin/vehicle infusion. e Progressive accumulation of plasma TGs after an IV tyloxapol bolus (n ≥ 3 per group). f VLDL secretion rates calculated from the slopes depicted in Fig. 4e. g Plasma increase in TG levels following a tyloxapol bolus after a targeted 4 h leptin/vehicle infusion directly into the mediobasal hypothalamus (MBH; n ≥ 5 per group). h VLDL secretion rates calculated from the slopes in Fig. 4g. i Plasma increase in TG levels following a tyloxapol bolus after a targeted 4 h leptin/vehicle infusion directly into the dorsal vagal complex (DVC). j VLDL secretion rates calculated from the slopes in Fig. 4i (n ≥ 3 per group). All data are mean ± SEM; *p < 0.05; **p < 0.01; vs vehicle group if not otherwise indicated by brackets. n.s. not significant by two-tailed Student’s t test; open circles: vehicle; black squares: leptin; green triangles pointing down: ICV vehicle plus liver Sx; violet triangles pointing up: ICV leptin plus liver Sx; blue triangles pointing down: ICV vehicle plus liver Vx; red triangles pointing up: ICV leptin plus liver Vx
Fig. 5
Fig. 5
Brain leptin signaling has preserved anti-steatotic effects in obese animals. a Study timeline of HFD feeding combined with the chronic ICV leptin/vehicle infusion protocol. Note that we used a 3-time higher ICV leptin dose compared to previous experiments on regular chow (Fig. 1f). b Hepatic lipid content after 8 weeks of HFD feeding with ICV leptin/vehicle infusion during the last 4 weeks (n ≥ 5 per group). c Western blot analyses of liver tissue lysates (n ≥ 5 per group). d Quantification of the Western blot analyses in Fig. 5c. All data are mean ± SEM; **p < 0.01; ***p < 0.001; vs. vehicle by two-tailed Student’s t test; open circles: ICV vehicle; black squares: ICV leptin
Fig. 6
Fig. 6
Proposed model of the role of CNS leptin in regulating hepatic lipid metabolism. Leptin secreted by white adipocytes protects the liver from ectopic lipid accumulation and lipotoxicity. Leptin reaches the brain by passing through the blood–brain barrier to increase TG secretion and reduce hepatic de novo lipogenesis via signaling in the dorsal vagal complex, where the efferent vagal motor neurons are located. These centrally mediated leptin effects require intact liver vagal innervation and are preserved under HFD-conditions when leptin is administered directly into the brain

Similar articles

Cited by

References

    1. Kwon YM, et al. Association of nonalcoholic fatty liver disease with components of metabolic syndrome according to body mass index in Korean adults. Am. J. Gastroenterol. 2012;107:1852–1858. doi: 10.1038/ajg.2012.314. - DOI - PubMed
    1. Raabe M, et al. Analysis of the role of microsomal triglyceride transfer protein in the liver of tissue-specific knockout mice. J. Clin. Invest. 1999;103:1287–1298. doi: 10.1172/JCI6576. - DOI - PMC - PubMed
    1. Berriot-Varoqueaux N, Aggerbeck LP, Samson-Bouma M, Wetterau JR. The role of the microsomal triglygeride transfer protein in abetalipoproteinemia. Annu Rev. Nutr. 2000;20:663–697. doi: 10.1146/annurev.nutr.20.1.663. - DOI - PubMed
    1. Cuchel M, et al. Inhibition of microsomal triglyceride transfer protein in familial hypercholesterolemia. N. Engl. J. Med. 2007;356:148–156. doi: 10.1056/NEJMoa061189. - DOI - PubMed
    1. Schonfeld G, et al. Fatty liver in familial hypobetalipoproteinemia: triglyceride assembly into VLDL particles is affected by the extent of hepatic steatosis. J. Lipid Res. 2003;44:470–478. doi: 10.1194/jlr.M200342-JLR200. - DOI - PubMed

Publication types

MeSH terms