

Intestinal translocation of enterococci requires a threshold level of enterococcal overgrowth in the lumen
- PMID: 31222056
- PMCID: PMC6586816
- DOI: 10.1038/s41598-019-45441-3
Intestinal translocation of enterococci requires a threshold level of enterococcal overgrowth in the lumen
Abstract
Enterococci are subdominant members of the human gastrointestinal microbiota. Enterococcus faecalis is generally harmless for healthy individuals, but it can cause a diverse range of infections in immunodeficient or elderly patients with severe underlying diseases. In this study, we analysed the levels of intestinal translocation of indigenous enterococci in C57BL/6, CF-1 and CX3CR1-/- mice upon clindamycin antibiotic-induced dysbiosis. We found that C57BL/6 was the most permissive model for enterococcal translocation and that initiation of E. faecalis translocation coincided with a threshold of enterococcal colonisation in the gut lumen, which once reached, triggered E. faecalis dissemination to deeper organs. We showed that the extent to which E. faecalis clinical strain VE14821 competed with indigenous enterococci differed between the C57BL/6 and CX3CR1-/- models. Finally, using a simplified gnotobiotic model, we observed E. faecalis crossing an intact intestinal tract using intestinal epithelial cells as one route to reach the lamina propria. Our study opens new perspectives for assessing the effect of various immunodeficiencies and for investigating mechanisms underlying enterococcal translocation.
Conflict of interest statement
The authors declare no competing interests.
Figures
 ) and VE14821cm counts (
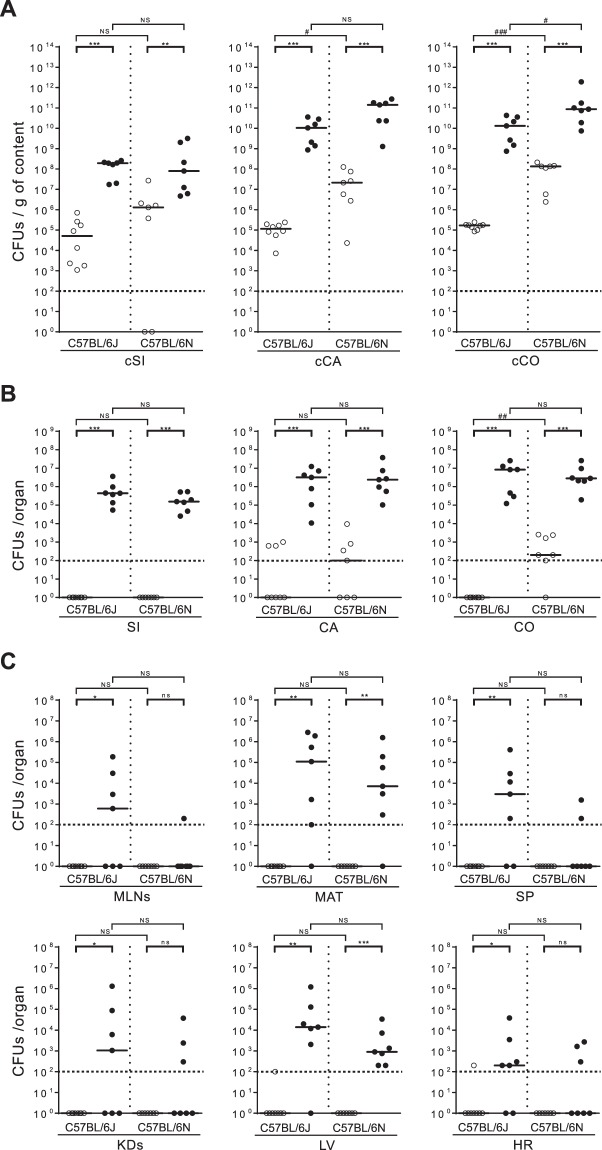
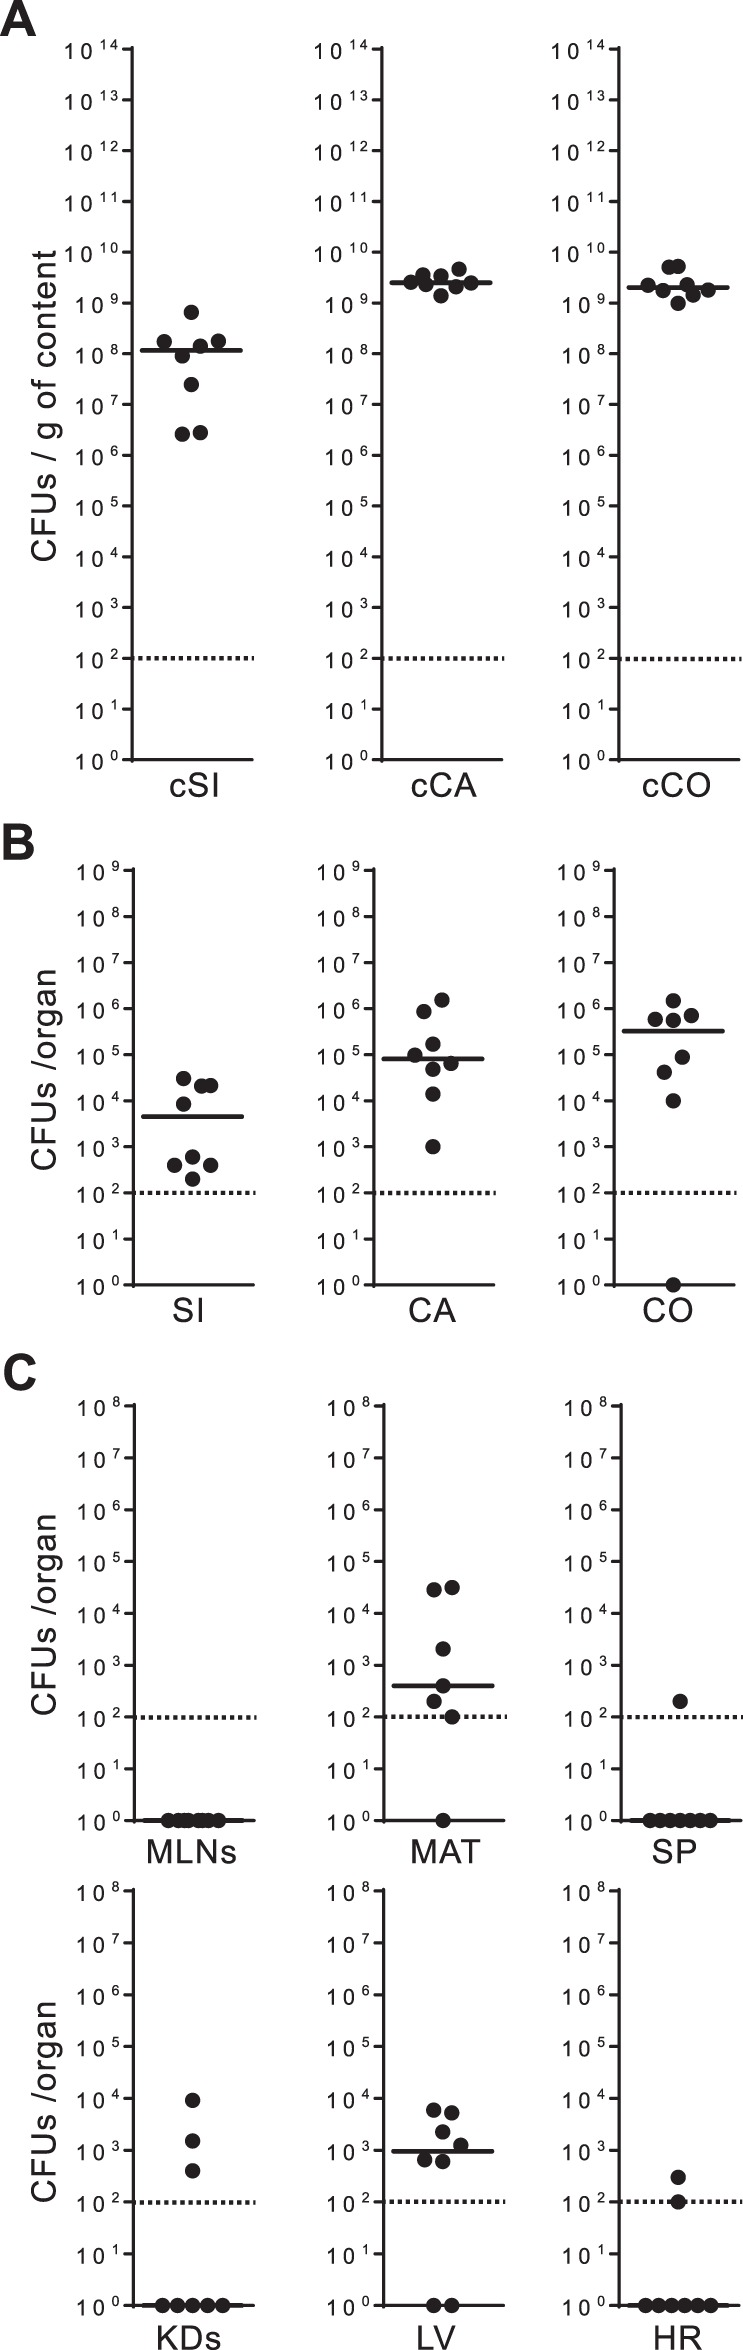
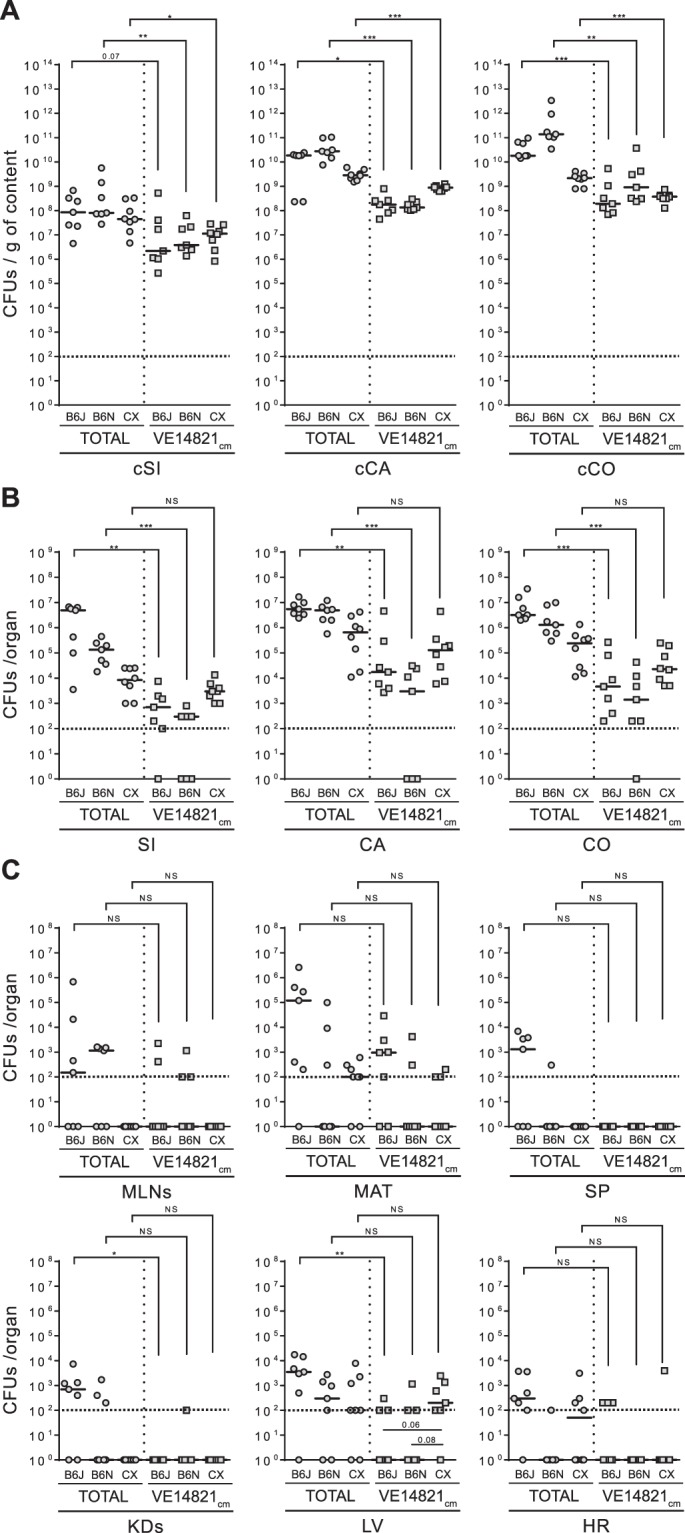
 ) were evaluated in clindamycin-treated C57BL/6J (B6J), C57BL/6N (B6N) and CX3CR1−/− (CX) mice 13 hours after oral inoculation. Each dot represents one mouse (n ≥ 7) and indicates the number of colony-forming units (CFUs) per gram of content (g of content) or per organ. The dotted line represents the detection limit. Horizontal bars represent the median value from two independent experiments. Enterococcal counts in the gut lumen (A) were conducted on luminal content from the small intestine (cSi), the caecum (cCA) and the colon (cCO). Enterococcal counts in the gut tissues (B) were conducted on the small intestine (SI), the caecum (CA) and the colon (CO). Enterococcal counts in the peripheral organs (C) were conducted on the mesenteric lymph nodes (MLNs), the mesenteric adipose tissue (MAT), the spleen (SP), the kidneys (KDs), the liver (LV) and the heart (HR). Statistical analysis was performed using the Mann–Whitney test. Asterisks (*) indicate statistically significant differences between counts (*P < 0.05, **P < 0.01, ***P < 0.001); ns, non-significant difference.
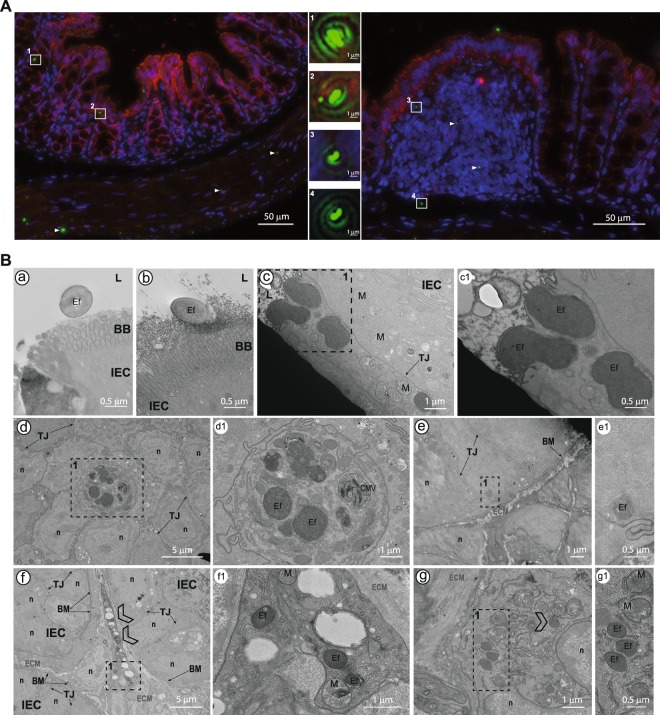
References
-
- Sievert DM, et al. Antimicrobial-resistant pathogens associated with healthcare-associated infections: summary of data reported to the National Healthcare Safety Network at the Centers for Disease Control and Prevention, 2009–2010. Infection Control and Hospital Epidemiology. 2013;34:1–14. doi: 10.1086/668770. - DOI - PubMed
-
- Freedberg Daniel E., Zhou Margaret J., Cohen Margot E., Annavajhala Medini K., Khan Sabrina, Moscoso Dagmara I., Brooks Christian, Whittier Susan, Chong David H., Uhlemann Anne-Catrin, Abrams Julian A. Pathogen colonization of the gastrointestinal microbiome at intensive care unit admission and risk for subsequent death or infection. Intensive Care Medicine. 2018;44(8):1203–1211. doi: 10.1007/s00134-018-5268-8. - DOI - PMC - PubMed
-
- Taur Y, et al. Intestinal domination and the risk of bacteremia in patients undergoing allogeneic hematopoietic stem cell transplantation. Clinical Infectious Diseases: An Official Publication of the Infectious Diseases Society of America. 2012;55:905–914. doi: 10.1093/cid/cis580. - DOI - PMC - PubMed
Publication types
MeSH terms
Substances
LinkOut - more resources
Full Text Sources
Molecular Biology Databases
