. 2019 Jun 20;9(1):8930.
doi: 10.1038/s41598-019-45438-y.

Computational analysis of single-cell transcriptomics data elucidates the stabilization of Oct4 expression in the E3.25 mouse preimplantation embryo

Affiliations

Computational analysis of single-cell transcriptomics data elucidates the stabilization of Oct4 expression in the E3.25 mouse preimplantation embryo

Daniela Gerovska et al. Sci Rep. .

Abstract

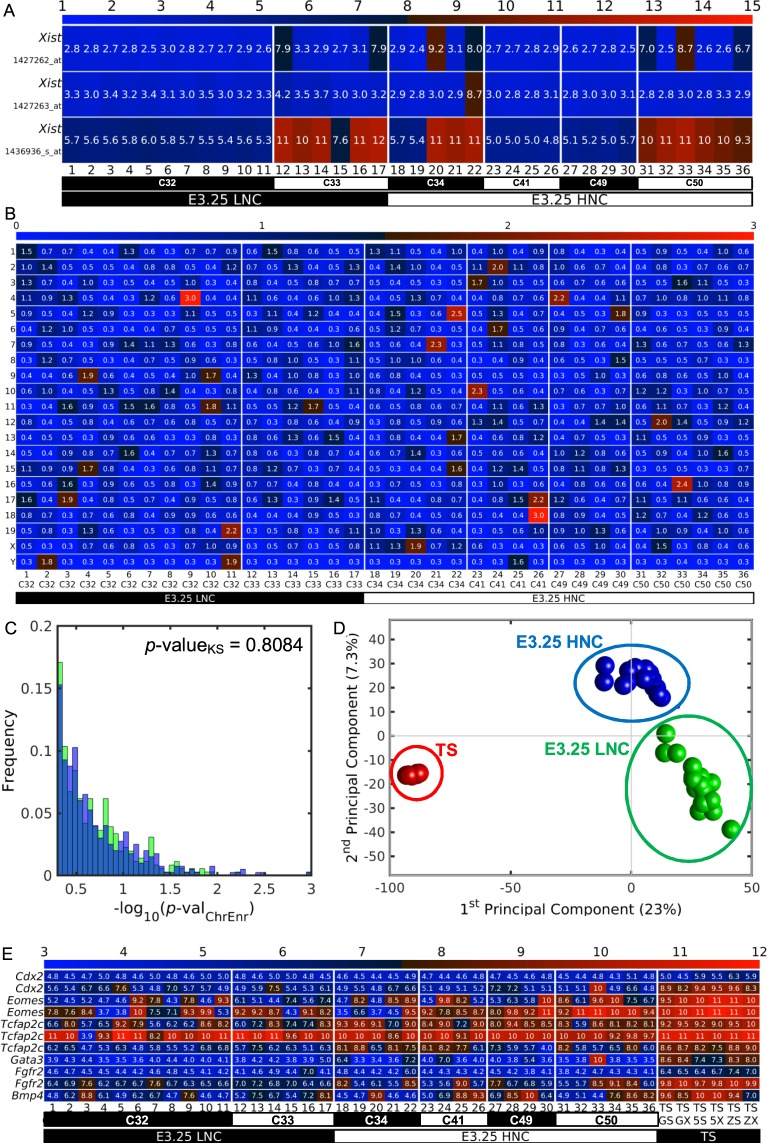
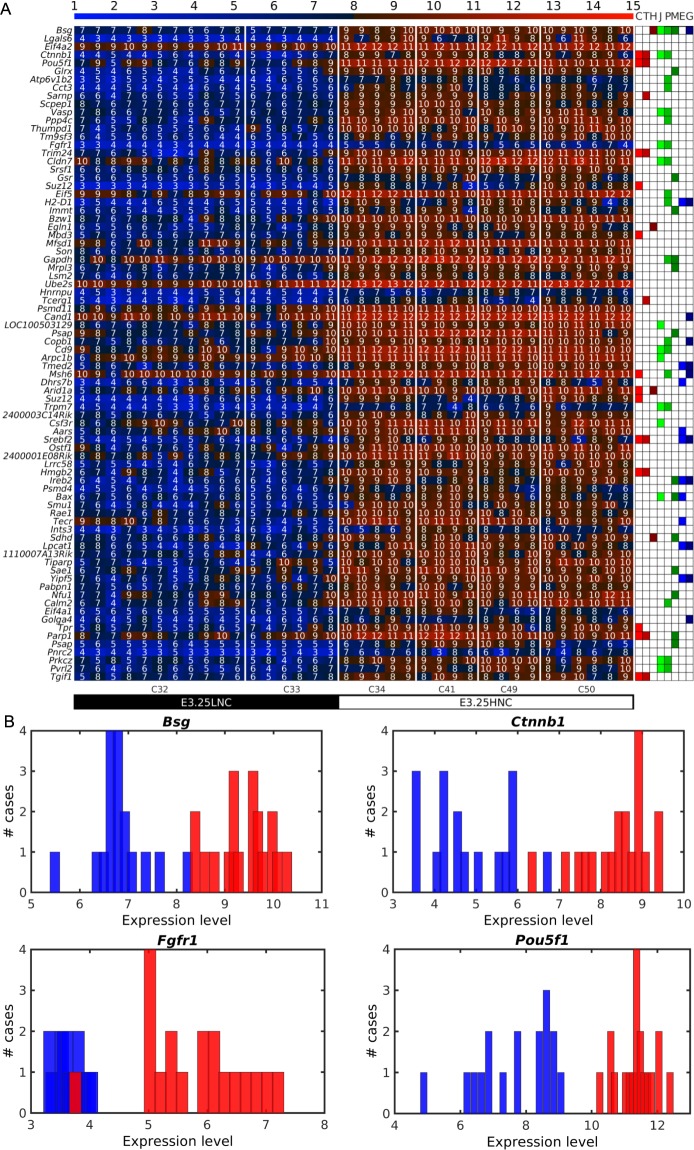
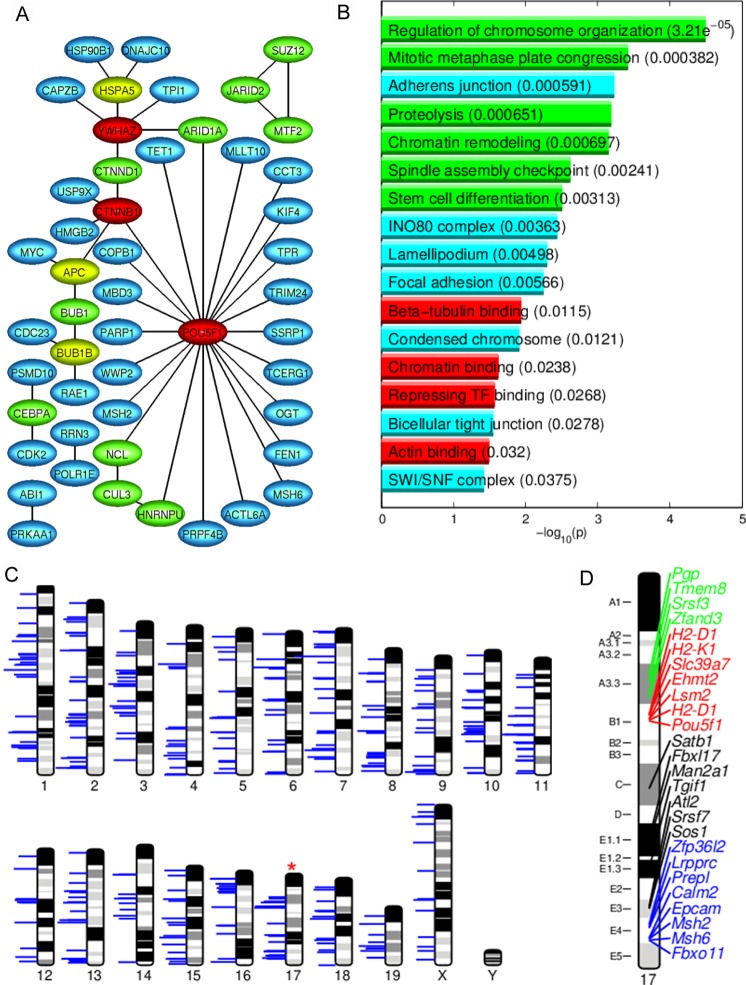
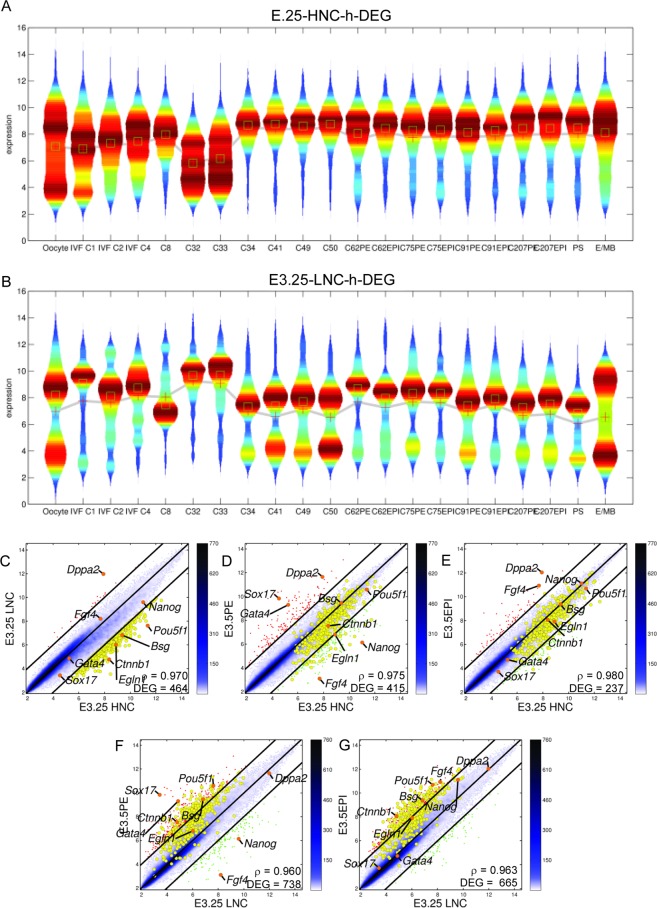
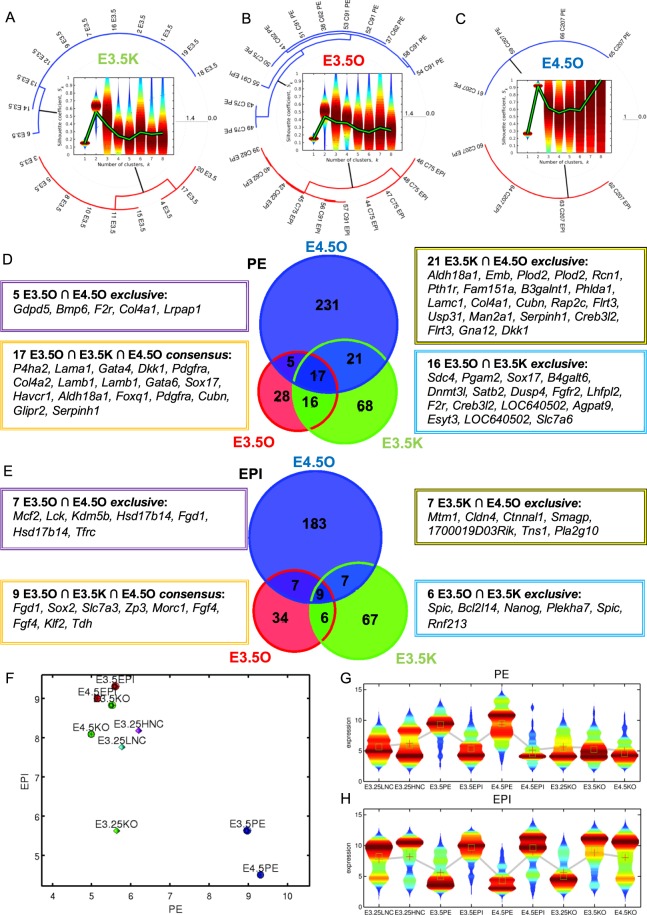
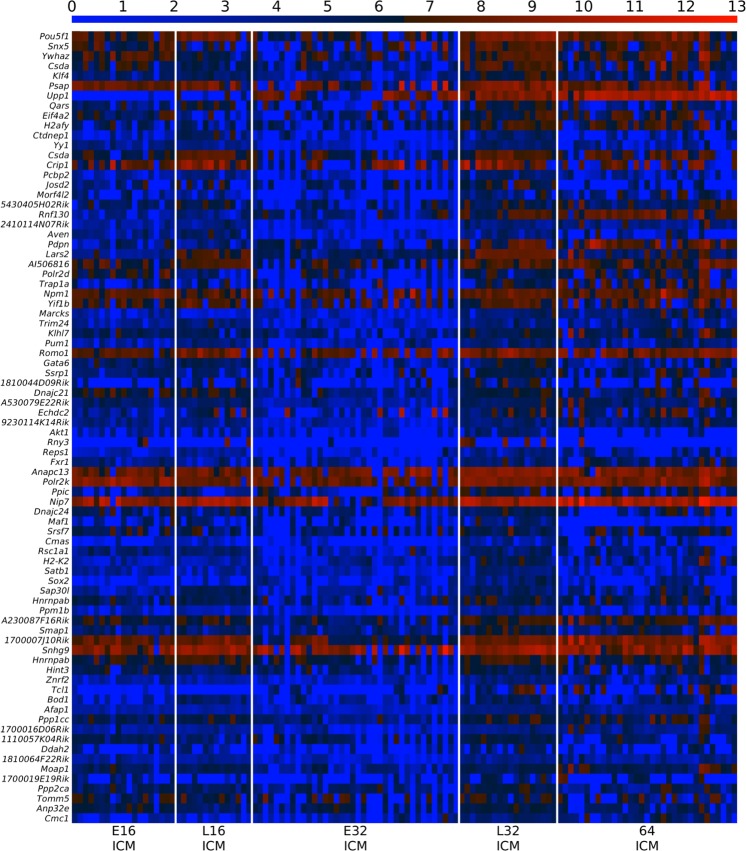
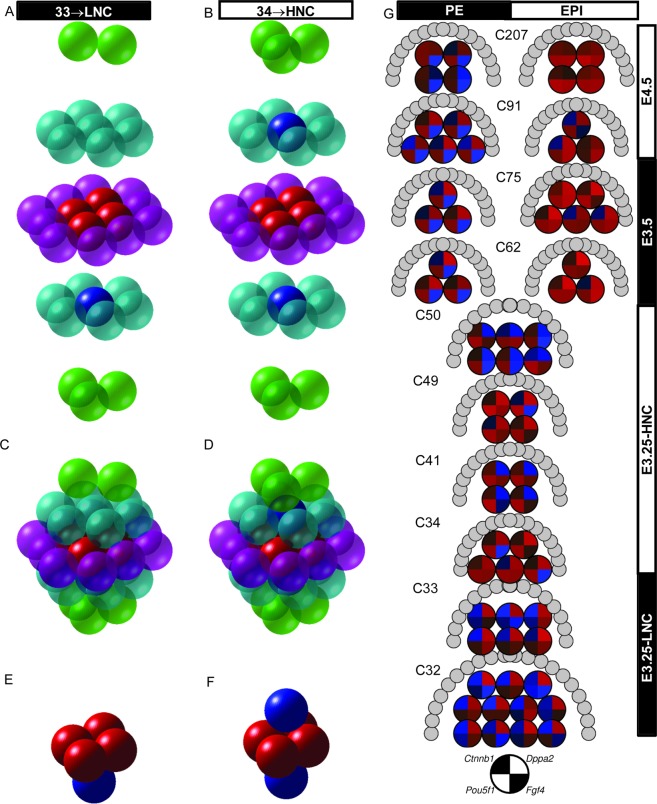
Our computational analysis focuses on the 32- to 64-cell mouse embryo transition, Embryonic day (E3.25), whose study in literature is concentrated mainly on the search for an early onset of the second cell-fate decision, the specification of the inner cell mass (ICM) to primitive endoderm (PE) and epiblast (EPI). We analysed single-cell (sc) microarray transcriptomics data from E3.25 using Hierarchical Optimal k-Means (HOkM) clustering, and identified two groups of ICM cells: a group of cells from embryos with less than 34 cells (E3.25-LNCs), and another group of cells from embryos with more than 33 cells (E3.25-HNCs), corresponding to two developmental stages. Although we found massive underlying heterogeneity in the ICM cells at E3.25-HNC with over 3,800 genes with transcriptomics bifurcation, many of which are PE and EPI markers, we showed that the E3.25-HNCs are neither PE nor EPI. Importantly, analysing the differently expressed genes between the E3.25-LNCs and E3.25-HNCs, we uncovered a non-autonomous mechanism, based on a minimal number of four inner-cell contacts in the ICM, which activates Oct4 in the preimplantation embryo. Oct4 is highly expressed but unstable at E3.25-LNC, and stabilizes at high level at E3.25-HNC, with Bsg highly expressed, and the chromatin remodelling program initialised to establish an early naïve pluripotent state. Our results indicate that the pluripotent state we found to exist in the ICM at E3.25-HNC is the in vivo counterpart of a new, very early pluripotent state. We compared the transcriptomics profile of this in vivo E3.25-HNC pluripotent state, together with the profiles of E3.25-LNC, E3.5 EPI and E4.5 EPI cells, with the profiles of all embryonic stem cells (ESCs) available in the GEO database from the same platform (over 600 microarrays). The shortest distance between the set of inner cells (E3.25, E3.5 and E4.5) and the ESCs is between the E3.25-HNC cells and 2i + LIF ESCs; thus, the developmental transition from 33 to 34 cells decreases dramatically the distance with the naïve ground state of the 2i + LIF ESCs. We validated the E3.25 events through analysis of scRNA-seq data from early and late 32-cell ICM cells.


Conflict of interest statement

The authors declare no competing interests.

Figures

Figure 1
Figure 1
Hierarchical Optimal k-Means clustering (HOkM) reveals a splitting into two clusters of the gene expression in the ICM of the mouse embryo at E3.25. (A) Bi-dimensional Principal Component Analysis (PCA) of transcriptomics data from all in vivo wild type samples (Table 1). Dodecahedra and spheres mark bulk and single cells, respectively. Green, cyan and magenta dodecahedra mark bulk samples of oocytes, E1.5 and E2.5-E3.0 cells, respectively. Green, cyan and dark blue spheres mark the E3.25, EPI (E3.5 and E4.5) and PE (E3.5 and E4.5) cells of Ohnishi et al., respectively; while the red spheres mark the E3.5 ICM cells of Kurimoto et al., and the magenta spheres mark the Prestreak and Early/mid bud cells of Kurimoto et al.. The arrows infer the direction of development. (B) Bi-dimensional PCA of the single cell transcriptomics data from E3.25 and E3.5 of Ohnishi et al.. The green spheres mark the E3.25 cells, while the cyan and dark blue spheres mark the E3.5 EPI and E.3.5 PE cells, respectively. The two green ellipses encircle the two groups of E.25 cells, posteriorly classified by the HOkM method and named as E3.25-LNCs and E3.25-HNCs. (C) Violin plot of the silhouettes of the HOkM trajectories. The green line marks the position of the medium silhouette distributions. (D) Dendrogram of the optimal clustering (ko = 2).
Figure 2
Figure 2
The ICM split at E3.25 into E3.25-LNC and E3.25-HNC is not due to sex, karyotype aberration or mis-assignment to ICM. (A) Heat map of the expression of the three probes targeting the long non-coding RNA Xist in the single cells from E3.25. The colour bar codifies the gene expression in log2 scale. Higher gene expression corresponds to redder colour. (B) Heat map of the -log10(p-valueChrEnr) of the statistical significance of the enrichment of each chromosome of the DEGs, obtained by the Jack-knife method, between each E3.25 single cell and the pool of the remaining E3.25 cells. The colour bar codifies the −log10(p-valueChrEnr). Higher −log10(p-valueChrEnr) corresponds to redder colour. (C) Histogram of the distributions of the -log10(p-valueChrEnr) between the E3.25-LNC (green bars) and E3.25-HNC (blue bars). Over-imposed is the p-valueKS = 0.808 for the two-sample Kolmogorov-Smirnov goodness-of-fit hypothesis test between for the two distributions. (D) PCA of all E3.25 cells of Ohnishi et al. and the TS cells of Kubaczka et al. (Table 1). The E3.25 LNC, E3.25 HNC and TS cells are marked with green, blue and red spheres. (E) Heat map of the expression of the probes targeting TE markers in the single cells from E3.25 of Ohnishi et al., and in the TS cells of Kubaczka et al., namely TS GS (EGFP cell line in TS medium), TS GX (TS EGFP cell line in TX medium), TS 5S (TS L5 cell line in TS medium), TS 5 × (TS L5 cell line in TX medium), TS ZS (TS LaCZ cell line in TS medium), TS ZX (TS LaCZ cell line in TX medium). The colour bar codifies the gene expression in log2 scale. Higher gene expression corresponds to redder colour.
Figure 3
Figure 3
Expression of Oct4 and several chromatin remodellers is stabilized at high level in E3.25-HNCs. (A) Heat map of the expression of the 80 top-ranked E3.25 HNC-h-DEGs in decreasing order of significance. The colour bar codifies the gene expression in log2 scale. Higher gene expression corresponds to redder colour. The table to the right annotates GO terms: C (Chromatin remodellers), T (Transcription factor activity), H (Hypoxia), J (Cell junction), P (Plasma membrane), M (Mitochondrion), E (Endoplasmic reticulum), G (Golgi apparatus). (B). Histograms showing the ability of the top-ranked HNC-h-DEGs (Bsg, Ctnnb1, Fgfr1 and Oct4) to discriminate between the E3.25-LNC (blue bars) and E3.25-HNC (red bars) populations.
Figure 4
Figure 4
Oct4 plays a central role in the network of the E3.25 HNC-h-DEGs. (A) Protein binary interaction network of the HNC-h-DEGs. The node colour codifies incidence number (blue, green, yellow and red for incidences 1, 2, 3 and more than 4, respectively). (B) Bar plot of the -log10(p-value) of the significant enriched GO terms of HNC-h-DEGs. Longer bars correspond to higher statistical significance of the enrichment (p-values inside parentheses). The red, green and cyan bars correspond with molecular function, biological process and cellular compartment GO terms, respectively. (C) Chromosomal landscaping of the HNC-h-DEGs. The horizontal blue lines mark the loci of the HNC-h-DEGs, and their length is proportional to the average level of expression of each HNC-h-DEG across all the HNCs. The red asterisk marks the chromosome with statistically significant enrichment of HNC-h-DEGs, hypergeometric distribution p-value < αLAN = 0.01. (D) Zoom-in on chromosome 17, marking the HNC-h-DEG gene names and their loci. The green, red and blue labels mark the clusters on the A3.3, B1 and E4 cytobands, the black labels mark the loci that did not pass the criterion for uni-dimensional clustering of loci.
Figure 5
Figure 5
Dynamics of the transcriptomics bifurcations across E3.25-LNC, E3.25-HNC, E3.5 and E4.5. (A,C,E,G) Transcriptomics trajectories ordered from earlier to later bifurcation decision. Each trajectory colour corresponds to the level of expression at the earliest time of the trajectory. Bluer colour corresponds to lower expression at the earliest measured time. The histogram of the transcriptomics level of the trajectories is shown on the z-axis at each embryonic day. The two-point passing stages represent a bifurcation of the gene trajectory at such stage, whereas the one-point passing stage represents a continuous distribution of states that cannot be segregated into two modes. (B,D,F,H) Top 12 transcripts with the maximum separation of the bifurcation of their corresponding trajectories, defined by the difference Dg¯ of the bifurcations means.
Figure 6
Figure 6
E3.25-HNCs are more developed than E3.25-LNCs. Violin plots of the distribution of the expression of (A) E3.25 HNC-h-DEGs and (B) E3.25 LNC-h-DEGs across different developmental stages. The mean and median are shown as red crosses and green squares, respectively. Pairwise scatter plots of (C) E3.25-LNC vs E3.25-HNC, (D) E3.5-PE vs E3.25-HNC, (E) E3.5-EPI vs E3.25-HNC, (F) E3.5-PE vs E3.25-LNC, (G) E3.5-EPI vs E3.25-LNC. The black lines are the boundaries of the 2-fold changes in gene expression levels between the paired samples. Transcripts up-regulated in ordinate samples compared with abscissa samples, are shown with red dots; those down-regulated, with green. The positions of some markers are shown as orange dots. The colour bar indicates the scattering density. Darker blue colour corresponds to higher scattering density. The transcript expression levels are log2 scaled. ρ is the Pearson’s correlation coefficient. The E3.25 HNC-h-DEGs are over-imposed as yellow dots.
Figure 7
Figure 7
Map of samples on the EPI vs PE space built from the consensus of EPI and PE markers predicted through HOkM. Polar dendrograms of the HOkM of (A) the E3.5 data from Kurimoto et al. E3.5K(urimoto), and from Ohnishi et al. (B) E3.5O(hnishi) (C) E4.5O(hnishi). Violin plots of the silhouettes of the HOkM trajectories are presented in the centre of each dendrogram. The over-imposed green line in the violin plots marks the position of the medium silhouette distributions. Euler-Venn diagrams of the transcripts shared by the (D) PE and (E) EPI populations. (F) Map of single-cell transcriptomics data on the EPI - PE space. Violin plots of the distributions of the consensus (G) PE and (H) EPI markers. The mean and median are shown as red crosses and green squares, respectively.
Figure 8
Figure 8
Comparison of E3.25-E4.5 stage inner cells (Ohnishi et al.) with all existing ESC Affymetrix Mouse Genome 430 2.0 Array transcriptomics profiles. (A) PCA. Green circles and dodecahedra mark E3.25 LNCs and HNCs, respectively. Cyan circles and dodecahedra mark E3.5 and E4.5 PE, respectively. Blue circles and dodecahedra mark E3.5 and E4.5 EPI, respectively. Orange circles mark ESCs. (B) Heat map of the 1 - Spearman correlation distances of the top-closest ESC to the different pre-implantation developmental stages. (C) Histogram of the distribution of the distance between the transcriptomics profiles of each of the E3.25–E4.5 single cells of Ohnishi et al. and each one of all of the ESC Affymetrix Mouse Genome 430 2.0 Array transcriptomics profiles. The shadowed rectangle marks the range of distances between the top-closest ESC and E3.25 HNC. (D) Pairwise scatter plots of ESC 2i + LIF vs E3.25-HNC. The black lines are the boundaries of the 2-fold changes in gene expression levels between the paired samples. Transcripts up-regulated in ordinate samples compared with abscissa samples, are shown with red dots; those down-regulated, with green. The positions of some markers are shown as orange dots. The colour bar indicates the scattering density. Darker blue colour corresponds to higher scattering density. The expression levels are log2 scaled. ρ is the Pearson’s correlation coefficient. The E3.25 HNC-h-DEGs are over-imposed as yellow dots.
Figure 9
Figure 9
Expression of Oct4 is stabilized at high level in the late 32-cell ICM. Heat map of the expression of the 80 top-ranked L32ICM-h-DEGs in the ICM cells from early 16 cells to 64 cells from the dataset of Posfai et al.. The L32ICM-h-DEGs are the DEGs up-regulated in the late 32-cell ICM in comparison with the early 32-cell ICM of Posfai et al.. The colour bar codifies the gene expression in log2 scale. Higher gene expression corresponds to redder colour.
Figure 10
Figure 10
Simplified spatial-temporal mouse embryo model. 3D embryo model based on hexagonal close-packing for embryos with 33 and 34 cells, and layer reconstruction of: (A) 33-cell and (B) 34-cell embryos. Packing of the: (C) 33-cell and (D) 34-cell embryos. (E) 5-cell and (F) 6-cell kernels formed of cells without external contacts. The transparent and solid spheres represent external and kernel cells, respectively. (G) Temporal representation of ICM cells from blastocysts at different number-of-cell stages and for different cell types. The gene expression of each cell is represented by a pie-chart of the expression of Pou5f1, Fgf4, Ctnnb1 and Dppa2. The gene expression is represented in log2 scale. Higher gene expression corresponds to redder colour, and lower expression to bluer colour. The genes and their corresponding positions in the pie-chart are represented by the black and white pie-chart in the bottom. The semicircle of grey circles surrounding the top part of each group of single cells represents the blastocyst outer cells.

Similar articles

Cited by

References

    1. Morris SA, et al. Origin and formation of the first two distinct cell types of the inner cell mass in the mouse embryo. Proc. Natl. Acad. Sci. USA. 2010;107:6364–6369. - PMC - PubMed
    1. Zernicka-Goetz M, Morris SA, Bruce AW. Making a firm decision: multifaceted regulation of cell fate in the early mouse embryo. Nat. Rev. Genet. 2009;10:467–477. - PubMed
    1. Ohnishi Y, et al. Cell-to-cell expression variability followed by signal reinforcement progressively segregates early mouse lineages. Nat. Cell Biol. 2014;16:27–37. - PMC - PubMed
    1. Jaenisch R, Young R. Stem cells, the molecular circuitry of pluripotency and nuclear reprogramming. Cell. 2008;132:567–582. - PMC - PubMed
    1. Takahashi K, Yamanaka S. Induction of pluripotent stem cells from mouse embryonic and adult fibroblast cultures by defined factors. Cell. 2006;126(4):663–676. - PubMed

Publication types

Substances