

Nitric oxide and ROS mediate autophagy and regulate Alternaria alternata toxin-induced cell death in tobacco BY-2 cells
- PMID: 31222105
- PMCID: PMC6586778
- DOI: 10.1038/s41598-019-45470-y
Nitric oxide and ROS mediate autophagy and regulate Alternaria alternata toxin-induced cell death in tobacco BY-2 cells
Erratum in
-
Author Correction: Nitric oxide and ROS mediate autophagy and regulate Alternaria alternata toxin-induced cell death in tobacco BY-2 cells.Sci Rep. 2024 Mar 4;14(1):5283. doi: 10.1038/s41598-024-55895-9. Sci Rep. 2024. PMID: 38438494 Free PMC article. No abstract available.
Abstract
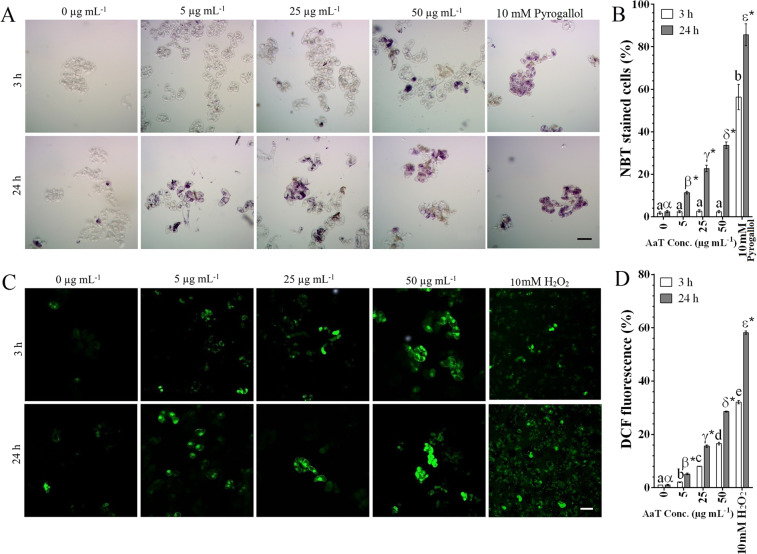
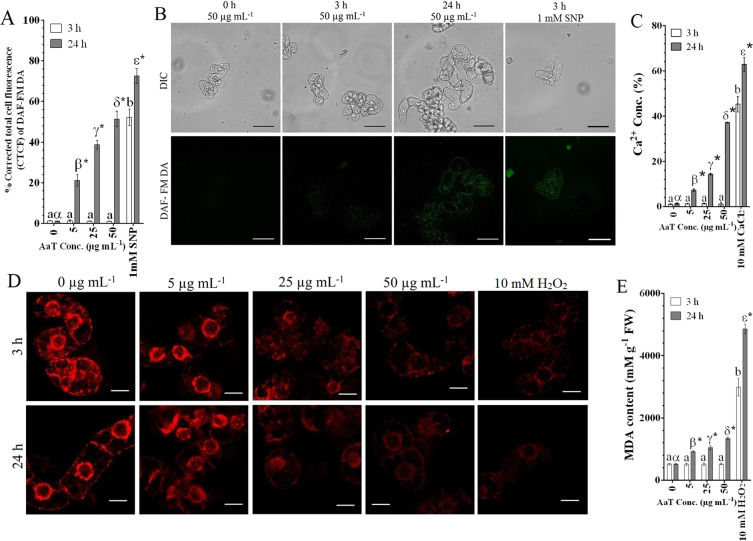
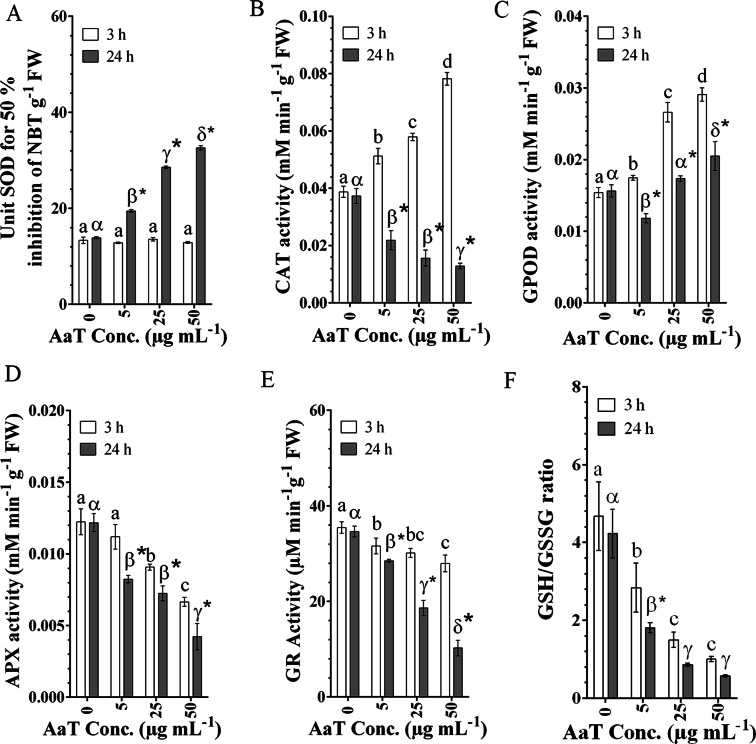
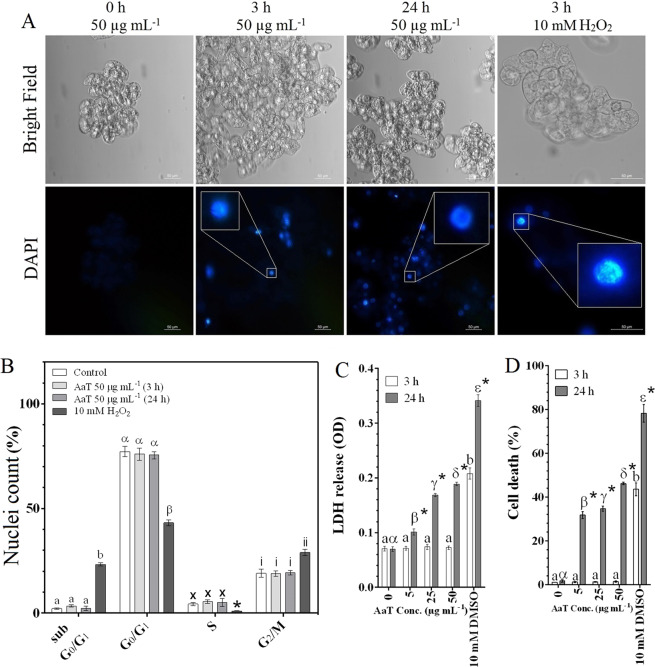
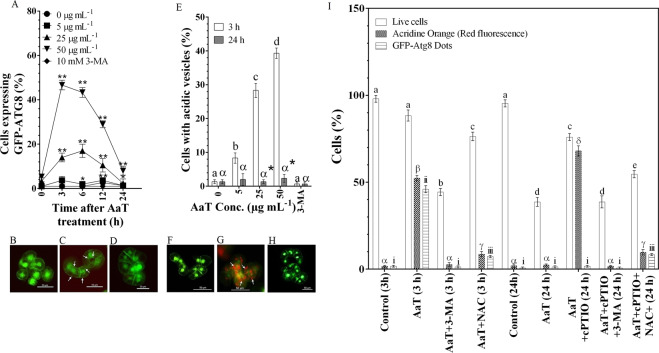
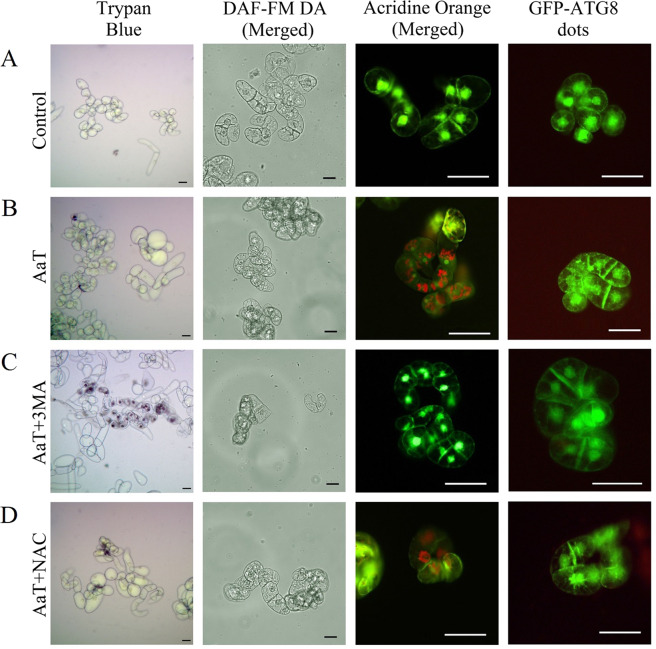
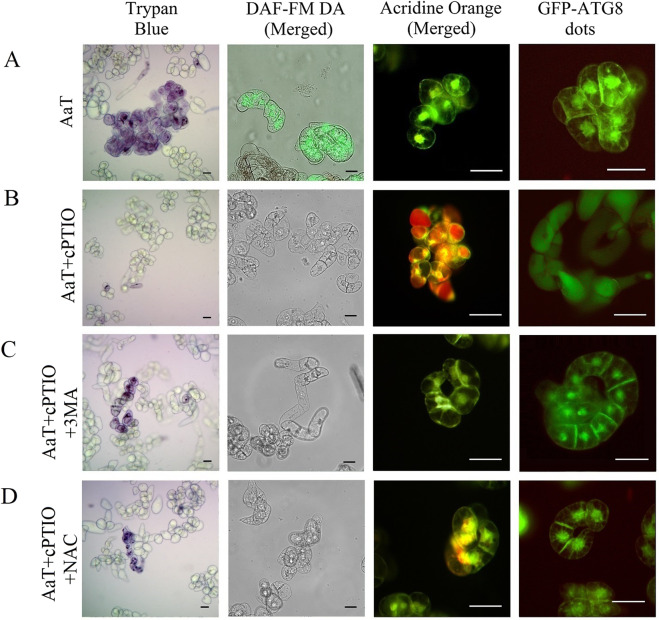
Synergistic interaction of nitric oxide (NO) and reactive oxygen species (ROS) is essential to initiate cell death mechanisms in plants. Though autophagy is salient in either restricting or promoting hypersensitivity response (HR)-related cell death, the crosstalk between the reactive intermediates and autophagy during hypersensitivity response is paradoxical. In this investigation, the consequences of Alternaria alternata toxin (AaT) in tobacco BY-2 cells were examined. At 3 h, AaT perturbed intracellular ROS homeostasis, altered antioxidant enzyme activities, triggered mitochondrial depolarization and induced autophagy. Suppression of autophagy by 3-Methyladenine caused a decline in cell viability in AaT treated cells, which indicated the vital role of autophagy in cell survival. After 24 h, AaT facilitated Ca2+ influx with an accumulation of reactive oxidant intermediates and NO, to manifest necrotic cell death. Inhibition of NO accumulation by 2-(4-Carboxyphenyl)-4,4,5,5-tetramethylimidazoline-1-oxyl-3-oxide (cPTIO) decreased the level of necrotic cell death, and induced autophagy, which suggests NO accumulation represses autophagy and facilitates necrotic cell death at 24 h. Application of N-acetyl-L-cysteine at 3 h, confirmed ROS to be the key initiator of autophagy, and together with cPTIO for 24 h, revealed the combined effects of NO and ROS is required for necrotic HR cell death.
Conflict of interest statement
The authors declare no competing interests.
Figures
Similar articles
-
Desensitization of idiopathic pulmonary fibrosis fibroblasts to Alternaria alternata extract-mediated necrotic cell death.Physiol Rep. 2016 Nov;4(21):e13020. doi: 10.14814/phy2.13020. Epub 2016 Nov 15. Physiol Rep. 2016. PMID: 27905295 Free PMC article.
-
Impaired lysosomal activity mediated autophagic flux disruption by graphite carbon nanofibers induce apoptosis in human lung epithelial cells through oxidative stress and energetic impairment.Part Fibre Toxicol. 2017 Apr 28;14(1):15. doi: 10.1186/s12989-017-0194-4. Part Fibre Toxicol. 2017. PMID: 28454554 Free PMC article.
-
ZT-25, a new vacuolar H(+)-ATPase inhibitor, induces apoptosis and protective autophagy through ROS generation in HepG2 cells.Eur J Pharmacol. 2016 Jan 15;771:130-8. doi: 10.1016/j.ejphar.2015.12.026. Epub 2015 Dec 12. Eur J Pharmacol. 2016. PMID: 26689625
-
ROS-induced lipid peroxidation modulates cell death outcome: mechanisms behind apoptosis, autophagy, and ferroptosis.Arch Toxicol. 2023 Jun;97(6):1439-1451. doi: 10.1007/s00204-023-03476-6. Epub 2023 May 2. Arch Toxicol. 2023. PMID: 37127681 Review.
-
The Intricate Balance between Life and Death: ROS, Cathepsins, and Their Interplay in Cell Death and Autophagy.Int J Mol Sci. 2024 Apr 6;25(7):4087. doi: 10.3390/ijms25074087. Int J Mol Sci. 2024. PMID: 38612897 Free PMC article. Review.
Cited by
-
Nitric Oxide Signaling and Its Association with Ubiquitin-Mediated Proteasomal Degradation in Plants.Int J Mol Sci. 2022 Jan 31;23(3):1657. doi: 10.3390/ijms23031657. Int J Mol Sci. 2022. PMID: 35163578 Free PMC article. Review.
-
Guidelines for the use and interpretation of assays for monitoring autophagy (4th edition)1.Autophagy. 2021 Jan;17(1):1-382. doi: 10.1080/15548627.2020.1797280. Epub 2021 Feb 8. Autophagy. 2021. PMID: 33634751 Free PMC article.
-
Optimized medium composition in Physalis alkekengi callus culture altered nitric oxide level for inducing antioxidant enzyme activities and secondary metabolites.Sci Rep. 2024 Jul 16;14(1):16425. doi: 10.1038/s41598-024-67191-7. Sci Rep. 2024. PMID: 39014067 Free PMC article.
-
Nitrated Nucleotides: New Players in Signaling Pathways of Reactive Nitrogen and Oxygen Species in Plants.Front Plant Sci. 2020 May 19;11:598. doi: 10.3389/fpls.2020.00598. eCollection 2020. Front Plant Sci. 2020. PMID: 32508862 Free PMC article. Review.
-
Multi-omics approaches to understand pathogenicity during potato early blight disease caused by Alternaria solani.Front Microbiol. 2024 Mar 11;15:1357579. doi: 10.3389/fmicb.2024.1357579. eCollection 2024. Front Microbiol. 2024. PMID: 38529180 Free PMC article.
References
Publication types
MeSH terms
Substances
LinkOut - more resources
Full Text Sources
Research Materials
Miscellaneous
