. 2019 Jun 20;9(1):8990.
doi: 10.1038/s41598-019-45525-0.

Sleep-like slow oscillations improve visual classification through synaptic homeostasis and memory association in a thalamo-cortical model

Affiliations

Sleep-like slow oscillations improve visual classification through synaptic homeostasis and memory association in a thalamo-cortical model

Cristiano Capone et al. Sci Rep. .

Abstract

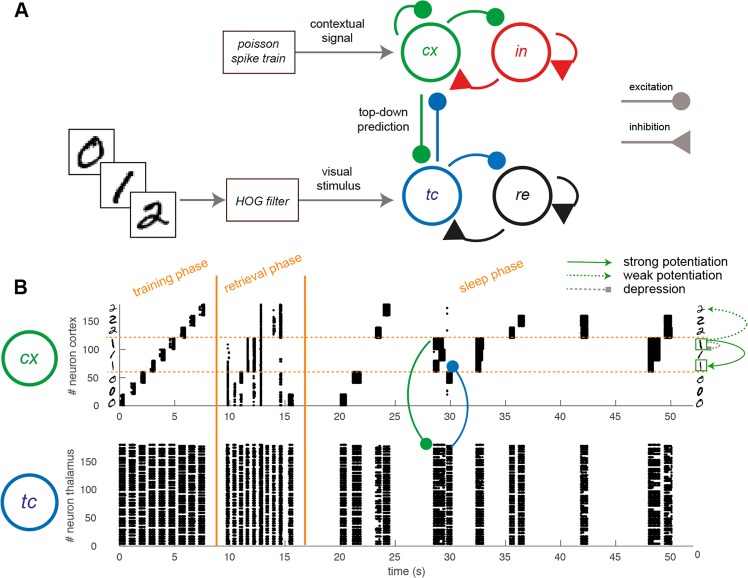
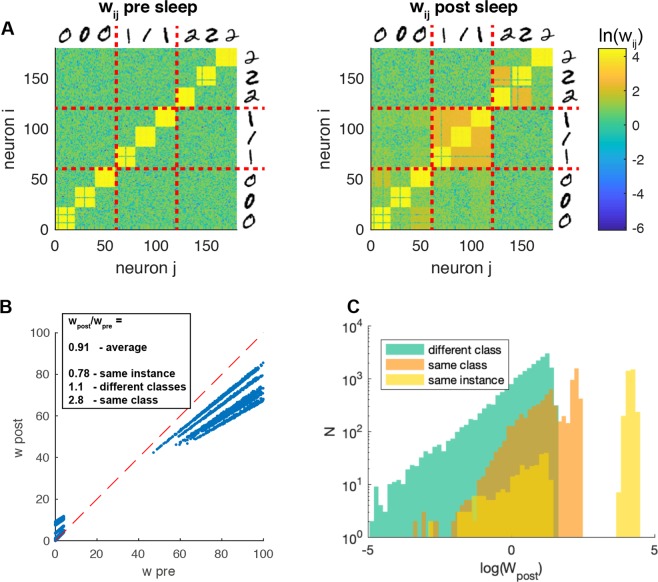
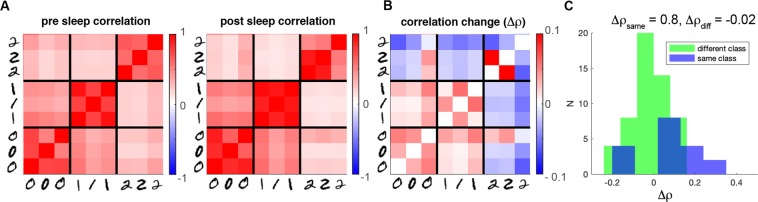
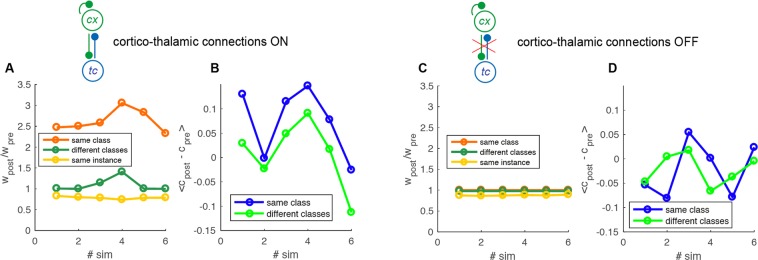
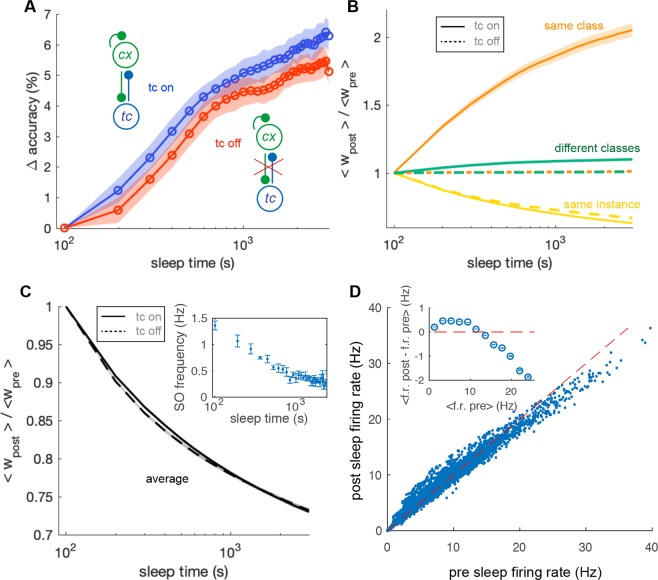
The occurrence of sleep passed through the evolutionary sieve and is widespread in animal species. Sleep is known to be beneficial to cognitive and mnemonic tasks, while chronic sleep deprivation is detrimental. Despite the importance of the phenomenon, a complete understanding of its functions and underlying mechanisms is still lacking. In this paper, we show interesting effects of deep-sleep-like slow oscillation activity on a simplified thalamo-cortical model which is trained to encode, retrieve and classify images of handwritten digits. During slow oscillations, spike-timing-dependent-plasticity (STDP) produces a differential homeostatic process. It is characterized by both a specific unsupervised enhancement of connections among groups of neurons associated to instances of the same class (digit) and a simultaneous down-regulation of stronger synapses created by the training. This hierarchical organization of post-sleep internal representations favours higher performances in retrieval and classification tasks. The mechanism is based on the interaction between top-down cortico-thalamic predictions and bottom-up thalamo-cortical projections during deep-sleep-like slow oscillations. Indeed, when learned patterns are replayed during sleep, cortico-thalamo-cortical connections favour the activation of other neurons coding for similar thalamic inputs, promoting their association. Such mechanism hints at possible applications to artificial learning systems.


Conflict of interest statement

The authors declare no competing interests.

Figures

Figure 1
Figure 1
Thalamo-cortical model and protocol description. (A) Sketch of the structure of the simplified thalamo-cortical model considered, which is composed of an excitatory and an inhibitory population both for the cortex (cx, in) and for the thalamus (tc, re). Connectivity structure is represented by solid lines. The visual input is fed into the model through the thalamic population, mimicking the biological visual pathways. In the training phase a lateral stimulus enhances a specific subset of cx neurons to preferentially represent the stimulus. (B) Activity produced during training phase, pre-sleep retrieval and the first 40s of SO activity in the cx (top) and tc (bottom) populations. Only first 180 neurons in tc population are shown for visual purposes. In the training 3 instances of 3 classes of digits (0,1,2) are learned by the network. In the replay during sleep, thalamo-cortical connections promotes the activation of neurons coding for similar patterns of activity, causing the potentiation of cortico-cortical connections between neurons representing digits of the same class. A general depression reduces the largest synaptic weights. Post SO retrieval is not shown.
Figure 2
Figure 2
SO effects on connectivity structure. (A) Synaptic weights matrix of the recurrent connectivity of cx population, before (left) and after (right) the occurrence of sleep-like activity. The yellow squares represent high weights emerged between neurons encoding the visual input related to the same object (single instance of 0, 1, 2 … image). Red solid lines separate the neurons encoding visual inputs related to different classes of objects (0, 1, 2 …). (B) Scatter-plot of the same synaptic weights before and after sleep. (C) Synaptic weights after sleep, separated in three groups, synapses between neurons encoding the same object (yellow), the same class (but not the same object, orange) and different classes (green).
Figure 3
Figure 3
SO effects on internal representation. (A) Activity correlation between all pairs of populations representing the single images before (left) and after (right) sleep. (B) Correlation difference between after and before sleep. (C) Histogram of correlation differences for populations encoding the same class (blue) and different classes (green).
Figure 4
Figure 4
Analysis of populations: synaptic weights and comparison between correlations with and without cortico-thalamic predictions. (A) Average ratio between weights post- and pre- sleep for each simulation (top). The different categories are separated in different colors. Yellow: synapses connecting neurons coding for the same image, orange: different image of the same class of digits and green: different classes. (B) The average change in correlation between post- and pre- sleep for each simulation (top) and histogram of the distribution over all the simulations (n = 6, bottom). Blue: same class, green: different classes. (C,D) as in A-B but in absence of cortico-thalamic connections.
Figure 5
Figure 5
Sleep effects on a classification task. (A) Change in classification accuracy across over 30 sleep epochs (100s each). Blue and red are respectively the conditions in which thalamus is on and off. The improvement in accuracy is averaged over 30 simulation trials. SEM is reported in the shading. (B) Average synaptic potentiation and depression over 30 sleep epochs. The colors indicate connections between neurons coding the same instance (yellow), different instances of the same class (green) and instances of different classes (orange). Dashed and solid lines represent the comparison between the conditions in which thalamus is on and off. (C) Average synaptic depression over all the synapses. (inset) Average decrease of SO frequency across sleep time, average over 4 simulations. (D) Scatter of single neurons activity in 8 simulations averaged over time in a classification task before and after 3000s of sleep. Inset, average difference of activity after and before sleep as a function of activity before sleep.

References

    1. Tononi G, Cirelli C. Sleep and the price of plasticity: From synaptic and cellular homeostasis to memory consolidation and integration. Neuron. 2014;81:12–34. doi: 10.1016/j.neuron.2013.12.025. - DOI - PMC - PubMed
    1. Tononi, G. et al. Center for sleep and consciousness - research (2018).
    1. Killgore William D.S. Progress in Brain Research. 2010. Effects of sleep deprivation on cognition; pp. 105–129. - PubMed
    1. Watson B, Levenstein D, Greene J, Gelinas J, Buzsáki G. Network homeostasis and state dynamics of neocortical sleep. Neuron. 2016;90:839–852. doi: 10.1016/j.neuron.2016.03.036. - DOI - PMC - PubMed
    1. Walker MP, Stickgold R. Sleep, memory, and plasticity. Annu. Rev. Psychol. 2006;57:139–166. doi: 10.1146/annurev.psych.56.091103.070307. - DOI - PubMed

Publication types