. 2019 May 2;15(6):1125-1138.
doi: 10.7150/ijbs.30543. eCollection 2019.

Synthetic-Evolution Reveals Narrow Paths to Regulation of the Saccharomyces cerevisiae Mitotic Kinesin-5 Cin8

Affiliations

Synthetic-Evolution Reveals Narrow Paths to Regulation of the Saccharomyces cerevisiae Mitotic Kinesin-5 Cin8

Alina Goldstein et al. Int J Biol Sci. .

Abstract

Cdk1 has been found to phosphorylate the majority of its substrates in disordered regions, but some substrates maintain precise phosphosite positions over billions of years. Here, we examined the phosphoregulation of the kinesin-5, Cin8, using synthetic Cdk1-sites. We first analyzed the three native Cdk1 sites within the catalytic motor domain. Any single site conferred regulation, but to different extents. Synthetic sites were then systematically generated by single amino-acid substitutions, starting from a phosphodeficient variant of Cin8. Out of 29 synthetic Cdk1 sites, 8 disrupted function; 19 were neutral, similar to the phospho-deficient variant; and only two gave rise to phosphorylation-dependent spindle phenotypes. Of these two, one was immediately adjacent to a native Cdk1 site. Only one novel site position resulted in phospho-regulation. This site was sampled elsewhere in evolution, but the synthetic version was inefficient in S. cerevisiae. This study shows that a single phosphorylation site can modulate complex spindle dynamics, but likely requires further evolution to optimally regulate the precise reaction cycle of a mitotic motor.

Keywords: Cdk1; Cin8; anaphase B; kinesin-5; phosphoregulation.


Conflict of interest statement

Competing Interests: The authors have declared that no competing interest exists.

Figures
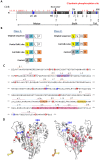
Figure 1
Figure 1
A strategy to generate synthetic Cdk1 sites. (A) Schematic representation of Cin8. Indicated by blue rectangles: native Cdk1; red arrows: synthetic phosphorylation sites; CC: coiled coil. (B) Mutagenesis strategy to create the synthetic phosphorylation sites. Class 1 synthetic sites are more structurally conservative; amino acids prior to existing prolines were mutated to serine to create minimal Cdk1 consensus sites. For synthetic sites that did not result in full Cdk1 phosphorylation consensus, we also generated a full consensus site by additional mutation of the position +3 relative to the potential phosphoacceptor serine to lysine. Finally, control mutants were generated by mutating the serine at the phosphoacceptor position to alanine; see Materials and Methods. In class 2 synthetic sites, the amino-acid proline was introduced at +1 relative to an existing serine or threonine with a lysine or arginine at the +3 position, resulting in a full consensus Cdk1 site. As in class 1, alanine control mutants were generated for cases that conferred localization phenotypes. (C) Sequence of Cin8 motor domain with secondary structure annotated according to . Key domains: ATPase p-loop in purple, Switch I in orange, Switch II in yellow, MT biding domain (helix 4, loop 12 and helix 5) in pink. Native and Synthetic Cdk1 phosphorylation sites are indicated by blue and red, respectively. (D) Model of the Cin8 motor domain predicted by Swiss-model based on human kinesin-5 Eg5 (PDB ID: 3HQD). Cdk1 sites are represented by spheres, blue for native and red for synthetic sites. Key domains are color coded as in 1C.
Figure 2
Figure 2
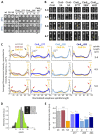
A single native phosphorylation site is sufficient for viability and each site regulates the distribution of kinesin-5 differently. (A) Viability assay of a shuffle yeast strain deleted for its chromosomal copies of CIN8 and KIP1 and containing a recessive chromosomal cycloheximide resistance gene (cin8Δ;kip1Δ;cyhr) on plates containing 7.5 µg/ml cycloheximide. Cells contain centromeric (CEN) plasmids expressing the Cin8 phospho-variants with one native Cdk1 site as a sole source of Cdk1 phospho-regulation (indicated on top, e.g., Cin8nat277 is a cin8Δ; kip1Δ strain with a plasmid containing Cin8 with only the CDK1 consensus site at position 277 intact). Cells were plated in serial dilution, grown at 26°C and 35°C indicated at the left; *grown at 37°C , . (B) Localization of Cin8 native phospho-variants (Cin8nat) to anaphase spindles. Anaphase spindles are divided into length categories, indicated on the left. Representative 2D projections of a 3D stack of fluorescence images of cells expressing 3GFP-tagged Cin8 phospho-variants from a CEN plasmid are shown. Micrographs are oriented with mother cells at the bottom. Scale bar: 5 µm; Yellow arrows: Cin8 detachment from the SPBs; white arrows: Cin8 accumulation at the SPBs; and white arrowheads: Cin8 localization at the midzone. (C) Fluorescence intensity along the spindle measured starting at the mother pole and divided to 100 segments of equal length. The signal was normalized to the integral of spindle-bound Cin8-3GFP signal. The signal for each variant was compared to that of Cin8-5A (orange), indicated on top. For Cin8nat277 and Cin8nat285 the color coding for the partial and full Cdk1 phosphorylation consensus variants are indicated. Spindle length-ranges are indicated on the right. Black arrows: Cin8 accumulation at the SPBs; light gray arrow: elevated distribution of Cin8 at the midzone region; red arrows: reduced Cin8 distribution at the SPBs compared to Cin8-5A. At each spindle length, the average intensity ratio in arbitrary units ± s.e.m. of 15-20 cells is presented. Significance was determined for Cin8-2A, Cin8nat277f, Cin8nat285f and Cin8nat493f compared to wt Cin8 (gray asterisks) and Cin8-5A (orange asterisks). Significance of T-test is indicated as *p < 0.05, **p < 0.005, ***p < 0.0005. (D) Method to quantify Cin8 detachment from the spindle. A 41-pixel line was drawn perpendicular to the spindle at the mother SPB. The Y-axis represents the intensity measured along the yellow line. The corresponding cell is shown at the top right; scale bar: 2 µm. The brightest 5 pixels were assigned as Cin8 attached to the center of the SPB and are indicated on the graph as a dashed gray area. The 12 distal pixels on the far ends of the line were averaged and subtracted as background (dark gray dashed area). The fluorescence intensity of the 6 pixels immediately flanking the SPB was assigned Cin8 detached from the spindle (green area). (E) Average intensity ratio of the Cin8 detachment at spindle length of 6-7 µm, as explained in C. Average ± s.e.m of 18-20 cells is shown. α (orange): p-value compared to Cin8-5A, β (grey): p-value compared to wt Cin8. *p < 0.05, **p < 0.001. (A)-(E): p - partial phosphorylation consensus (S-P), f - full phosphorylation consensus (S-P-x-K), fc - full control phosphorylation consensus (A-P-x-K).
Figure 3
Figure 3
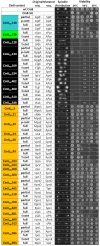
Phenotypes of all the Cin8syn mutants examined in this study. On the left, the names of the mutants, including the position of phosphorylation of the synthetic Cdk1 consensus, are indicated. The mutants are color coded: Cin8syn148 (cyan) and Cin8syn276 (green) which exhibit phosphorylation dependent detachment from the spindle; mutants exhibiting no detachments from the spindle (orange), therefore classified as neutral and mutants that are non-viable at 26°C (black). In the following column, each type mutation is indicated: partial [S/T-P] and full [S/T-P-x-K/R] Cdk1 sequences; and full and partial control mutations (f.cont and p.cont, respectively). In the next two columns, the original and mutated sequences are indicated; capital letters represent position of mutations. Next, representative images of the phosphovariant distribution during anaphase cin8Δ strains (containing the endogenous KIP1 gene to allow analysis of non-functional cin8 alleles) and expressing the phosphovariants, are indicated at the spindle distribution column. On the right, viability of a shuffle cin8Δ;kip1Δ;cyhr strains expressing Cin8syn mutants as a sole source for kinesin-5 function, at 26°C, 33°C, and 35°C are shown. For each strain, two colonies at reducing concentration of yeast cells are shown. *the temperature was 34°C, **the temperature was 37°C. N.D. - not determined.
Figure 4
Figure 4
Synthetic Cin8 variants can confer novel phosphoregulation. (A) Spindle localization of 3GFP-tagged Cin8syn phospho-variants at various spindle lengths (indicated on the left). Mother cell is oriented to the bottom of micrographs. Yellow arrows: Cin8 detachment from the spindle; white arrows: Cin8 concentration at the SPBs. Scale bar: 5 µm. (B) Cin8 detachment from 6-7 µm spindles, measured as in Figs. 2D and E. Average ± s.e.m. of 18-20 cells. p: partial Cdk1 consensus sequence [S/T-P], pc: control of partial consensus sequence [A-P], f: full Cdk1 consensus sequence [S/T-P-x-K/R], fc: control of full consensus sequence [A-P-x-K/R]. α: p-value of t-test compared to Cin8-5A. *p < 0.05, **p < 0.01. (C) Viability of shuffle cin8Δ;kip1Δ;cyhr strains expressing Cin8syn mutants. Cells were plated in serial dilution and grown on YPD plates with 7.5 µg/ml cyclohexamide at 26°C and 33°C. (D) Average fluorescence intensity along the spindle of Cin8syn mutants, indicated on top, compared to the fluorescence distribution of the corresponding non-phosphorylatable alanine control mutant and of Cin8-5A as in Fig. 2C. Color coding of the mutants and their control is indicated. Black arrows: Cin8 accumulation at the SPBs; light gray arrow: elevated distribution of Cin8 at the midzone; red arrows: reduced distribution at the SPBs compared to Cin8-5A. At each spindle length, the average intensity ratio in arbitrary units ± s.e.m. of 15-20 cells is presented. Significance was determined for Cin8syn148p, Cin8syn148f and Cin8syn276f compared to wt Cin8 (gray asterisks), Cin8-5A (orange asterisks), the respective control variant on the same plot (light cyan, cyan and green for Cin8syn148p, Cin8syn148f and Cin8syn276f respectively) and between Cin8syn148p and Cin8syn148f (black asterisks). *p < 0.05, **p < 0.005, ***p < 0.0005. (E) Spindle elongation rates of the first-fast and the second-slow phases of the full native and synthetic variants. Averages ± s.e.m. of 9-12 cells are shown. Phospho-variants are indicated on the bottom, 5A: Cin8-5A. α (orange): p-value compared to Cin8-5A. *p < 0.05, **p < 0.01.
Figure 5
Figure 5
Synthetic sites are phosphorylated by Cdk1 in vitro. In vitro Clb2/Cdk1 kinase assay of the Cin8 motor domain. Top - Coomassie brilliant blue staining and 32P autoradiograms of SDS-PAGE analysis of phosphorylation reactions. Clb2/Cdk1 is the kinase, substrate is bacterially expressed, purified motor domain of Cin8 alleles. The phosphorylation reaction mixture without Cin8 served as negative control (no Cin8). Bottom: quantification of phosphorylation rates normalized to wild-type. Cdk1 consensus sequences are indicated as “p” for partial and “f” for full.
Figure 6
Figure 6
Position and location of the synthetic phosphorylation sites. (A) Model of Cin8 motor domain in complex with αβ-tubulin predicted by Swiss-model based on pseudo-atomic model of MT-bound S. pombe kinesin-5 motor domain in the AMPPNP state (PDB ID: 5M5I). Key-role domains are color-coded; ATPase p-loop in purple (loop 4 with first 3 residues of helix2), MT binding domain and switch II “MTDB+SWII” (loop 11, helix 4, loop 12 and helix 5) in pink loop-5 in orange , , . Native sites are colored in blue, synthetic phospho-variants at positions 276 and 148 are colored in green and cyan, respectively. (B) Multiple sequence alignment of Cin8 with other kinesin-5 proteins as in Fig S1. Alignment was performed by Unipro UGENE alignment tool using MUSCLE algorithm; degree of identity in the sequence is indicated by blue highlight according to 50% threshold, Cdk1 phosphorylation consensuses are highlighted in yellow. Secondary structure is annotated on top according to . The different clades are indicated on the left. Saccharomycetaceae clade (orange), Candida clade (green), Eurotiomycetaes clade (dark pink), Dothideomycetes clade (gray) and Schizosaccharomyces clade (blue). Species are listed in Fig. S1.

Similar articles

Cited by

References

    1. Morgan DO, Roberts JM. Oscillation sensation. Nature. 2002;418:495–6. - PubMed
    1. Holt LJ, Tuch BB, Villen J, Johnson AD, Gygi SP, Morgan DO. Global analysis of Cdk1 substrate phosphorylation sites provides insights into evolution. Science. 2009;325:1682–6. - PMC - PubMed
    1. Landry CR, Freschi L, Zarin T, Moses AM. Turnover of protein phosphorylation evolving under stabilizing selection. Front Genet. 2014;5:245. - PMC - PubMed
    1. Choi KY, Satterberg B, Lyons DM, Elion EA. Ste5 tethers multiple protein kinases in the MAP kinase cascade required for mating in S. cerevisiae. Cell. 1994;78:499–512. - PubMed
    1. Mendenhall MD, Jones CA, Reed SI. Dual regulation of the yeast CDC28-p40 protein kinase complex: cell cycle, pheromone, and nutrient limitation effects. Cell. 1987;50:927–35. - PubMed

Publication types

MeSH terms