. 2019 May 7;15(6):1177-1186.
doi: 10.7150/ijbs.33103. eCollection 2019.

PCBP1 inhibits the expression of oncogenic STAT3 isoform by targeting alternative splicing of STAT3 exon 23

Affiliations

PCBP1 inhibits the expression of oncogenic STAT3 isoform by targeting alternative splicing of STAT3 exon 23

Xiaole Wang et al. Int J Biol Sci. .

Abstract

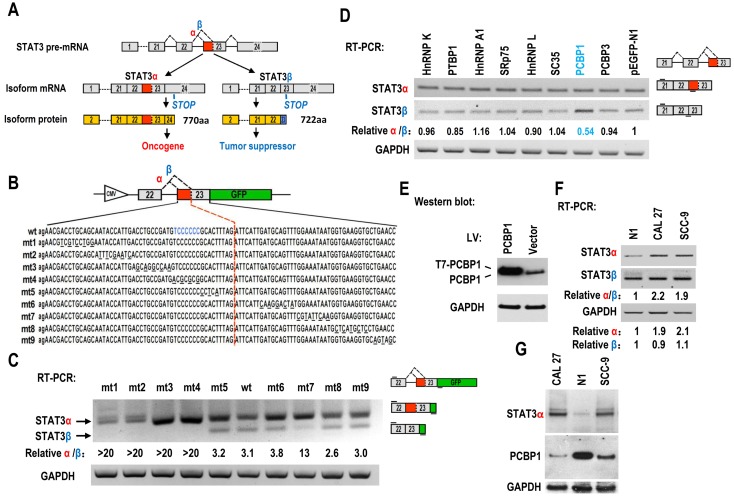
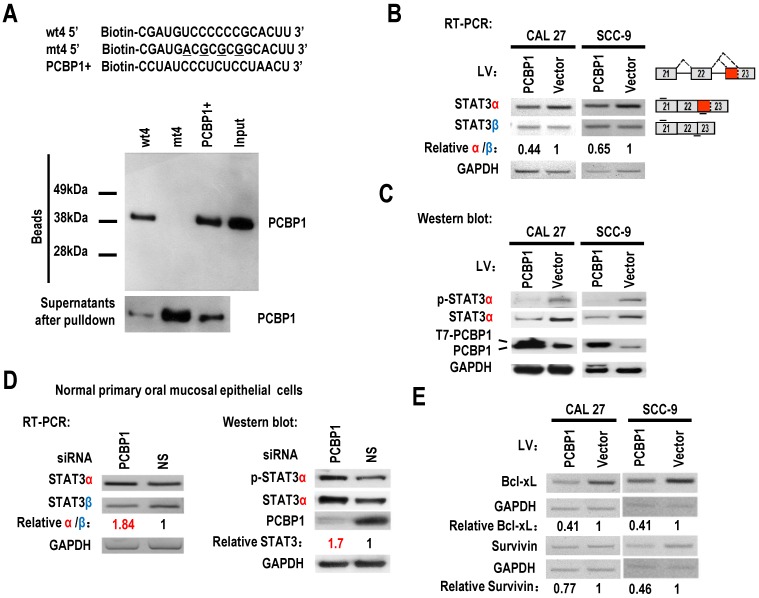
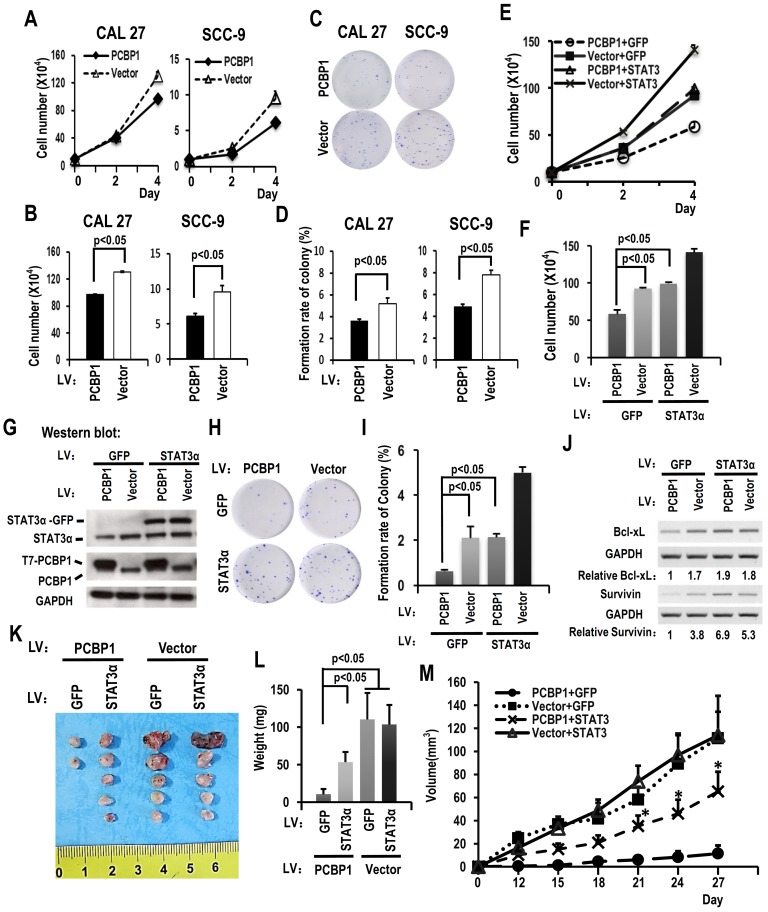
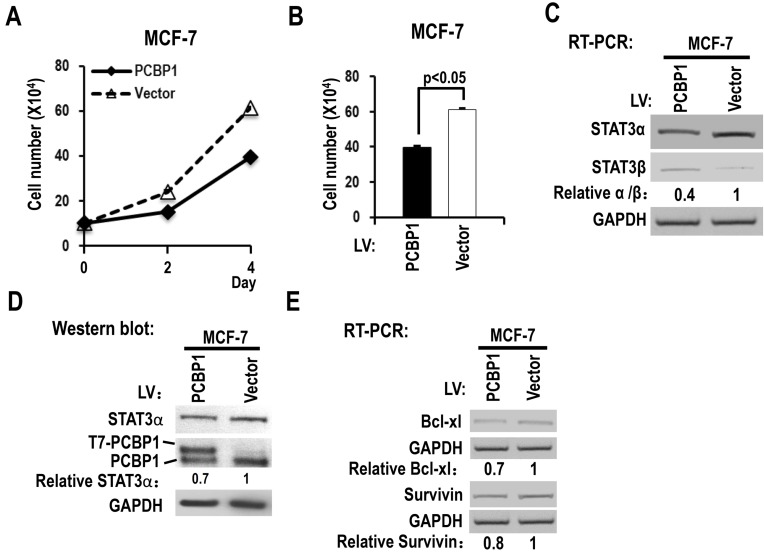
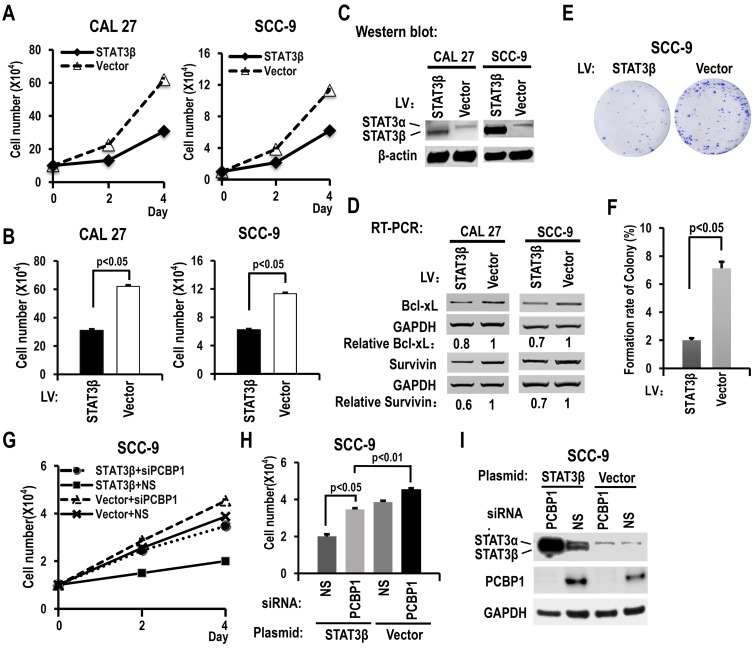
STAT3 plays very important roles in the initiation and development of tumors. Despite of extensive studies in repressing its activation and function via multiple ways, so far, there are few effective therapeutic methods to inhibit STAT3 in the clinic. STAT3 has two isoforms generated by alternative splicing of exon 23. STAT3α is the longer isoform and encodes the full-length oncogenic STAT3α protein. STAT3β is shorter and encodes the truncated and tumor-suppressive STAT3β protein. It remains unknown how the alternative splicing of STAT3 exon 23 is regulated. Here, we discovered that there is an exonic splicing suppressor (ESS) in exon 23. Importantly, splicing factor PCBP1 binds to this ESS. Overexpression of PCBP1 significantly reduced the proportion of STAT3α /STAT3β isoforms and the expression of STAT3α protein. Moreover, increased PCBP1 inhibited the growth of oral squamous cell carcinoma and breast cancer cells, and the expression of STAT3 target genes. Our results demonstrated that PCBP1 is the key splicing factor that promotes the switch from oncogenic isoform STAT3α to tumor-suppressive isoform STAT3β. Our results pave the way for finding new anti-STAT3 methods for cancer treatment.

Keywords: Alternative splicing; Oncogene; PCBP1; STAT3; head and neck cancer.


Conflict of interest statement

Competing Interests: The authors have declared that no competing interest exists.

Figures

Figure 1
Figure 1
Screening of key motifs in STAT3 exon 23 and splicing factors which are responsible for regulating the alternative splicing of STAT3 exon 23. (A) Schematic diagram of the alternative splicing pattern of human STAT3 exon 23. The boxes represent exons, and the solid lines between the boxes represent the introns. The dashed lines above the introns indicate the direction of RNA splicing. STOP represents the terminating codons. Isoform STAT3α mRNA encodes an oncoprotein, while isoform STAT3β encodes a tumor suppressor. (B) Diagram of STAT3 minigene. Genomic sequence of STAT3 from 3′ part of exon 22 to 5′ part of exon 23 was amplified from CAL 27 cells and cloned into pEGFP-N1. To map potential regulatory motifs, exon 23 in minigene was serially mutated. The mutated bases were underlined. (C) RT-PCR analysis of alternative splicing of exon 23 in HEK293 cells transfected with wild-type (wt) or mutant (mt) minigenes. Relative α/β represents the ratio of band intensities of isoform α vs β. GAPDH served as a loading control. Diagrams on the right show the structures of STAT3 minigene and spliced products. Short line above exon 22 stands for the forward primer, and short line below GFP gene stands for the backward primer. (D) Screening analysis for splicing factors which regulates alternative splicing of STAT3 exon 23. HEK293 cells were transfected with indicated RNA splicing factors or control plasmid (pEGFP-N1). Alternative splicing of endogenous STAT3 exon 23 was analyzed by RT-PCR with primers located in exon 21 and 23. Diagrams on the right show the structures of STAT3 pre-mRNA and spliced products. Short lines above or below exons stand for primer positions. An exon 22/23 backward junction primer was used to specifically amplify short product, STAT3β. (E) Overexpression of exogenous T7 tagged PCBP1 was confirmed by western blot. LV: lentivirus. GAPDH served as a loading control. (F-G) Alternative splicing of STAT3 and the expression of PCBP1 in normal and oral cancer cells were analyzed by RT-PCR or western blot.
Figure 2
Figure 2
PCBP1 controls the alternative splicing of STAT3 exon 23. (A) RNA pulldown assay was used to analyze the interaction between PCBP1 and STAT3 RNA. Biotinylated oligo RNAs [including wt4 or mt4 based on minigene mt4, and a positive PCBP1 binding control sequence (PCBP1+)] were incubated with HEK293 total cellular extract. The total proteins binding to RNAs (Beads) were blotted with a mouse anti-PCBP1 antibody. Supernatants after pulldown: total proteins after pulldown in supernatants. (B) CAL 27 or SCC-9 cells were stably transfected with T7 tagged PCBP1 or control lentivirus and the alternative splicing of exon 23 was detected by RT-PCR. Relative α/β represents the ratio of band intensities of α vs β isoform. GAPDH served as a loading control. Diagrams on the right show the structures of STAT3 pre-mRNA and spliced products. Short lines above or below exons stand for primer positions. An exon 22/23 backward junction primer was used to specifically amplify short product, STAT3β. (C) Western blot showed the overexpression of T7 tagged PCBP1 and the expression level of cellular STAT3 and phosphorylated STAT3 (p-STAT3). GAPDH served as a loading control. (D) PCBP1 was knocked down in normal primary oral mucosal epithelial cells. Knockdown efficiency of PCBP1, and the expression of STAT3 and phosphorylated STAT3 were analyzed by western blot. The alternative splicing of exon 23 was detected by RT-PCR. GAPDH served as a loading control. (E) RT-PCR analysis showed that overexpression of PCBP1 downregulates the expression of STAT3 targets (Bcl-xl and Survivin) in both CAL 27 and SCC-9 cells.
Figure 3
Figure 3
Downregulating the ratio of STAT3 α/β inhibits the cell growth of OSCC cell through overexpression of PCBP1. (A) CAL 27 or SCC-9 cells with T7-PCBP1 stable overexpression were seeded into 12 well plates on Day 0. Cell numbers were counted on Day 2 and Day 4. (B) The histograms show apparent statistically significant difference between the PCBP1 overexpression and control groups on Day 4. Data are the means ± SE, n=3. (C, D) Effects of PCBP1 overexpression on the clonogenic ability of CAL 27 and SCC-9 cells. One thousand cells were seeded in 6 cm dishes and cultured for 10 days. Representative images are shown (C). (D) The histograms summarized the number of colonies. Data are the means ± SE, n =3. (E) Overexpression of STAT3α rescued cell growth inhibition induced by PCBP1 overexpression. CAL 27 cells were transfected with T7-PCBP1 expression lentivirus, STAT3α-GFP expression lentivirus, empty control lentivirus and/or GFP expression control lentivirus. Transfected cells were divided into four groups: T7-PCBP1 + GFP, Vector + GFP, T7-PCBP1 + STAT3, and Vector + STAT3. Cell number was counted at Day 2 and Day 4. (F) The histograms summarized the numbers of cells counted on Day 4. Data are the means ± SE, n =3. LV: lentivirus. (G) Western blot displayed the overexpression of exogenous T7 tagged PCBP1 and exogenous STAT3α-GFP fusion protein. GAPDH served as a loading control. (H-I) STAT3α overexpression rescues the inhibition of PCBP1 overexpression on the clonogenic ability of CAL 27 cells. One thousand cells were seeded into 6 cm dishes and cultured for 10 days. Representative images are shown (H). (I) The histograms summarized the numbers of colonies. Data are the means ± SE, n =3. (J) Expression levels of the indicated STAT3 target genes (Bcl-xl and survivin) were analyzed by RT-PCR. GAPDH served as a loading control. (K-M) STAT3α overexpression rescues the inhibition of PCBP1 overexpression on the tumorigenesis of CAL 27 cells. Transfected CAL 27 cells in panel (G) was inoculated into nude mice (5 × 10⁵ cells per mice). (K-L) Tumors were dissected out and weighed on day 27. (M) Growth curves of tumors in nude mice (n = 5 mice in each group). Data are presented as mean ± SE. *P < 0.05 compared with PCBP1 + GFP group.
Figure 4
Figure 4
Overexpression of PCBP1 reduces the ratio of STAT3α/β and suppresses the cell proliferation of a breast cancer cell line (MCF-7). (A, B) MCF-7 cells were stably transfected with T7 tagged PCBP1 or control lentivirus and seeded into 12 well plates on Day 0. Cell numbers were counted on Day 2 and Day 4 (A). (B) The histograms show significant difference between the PCBP1 overexpression and control groups on Day 4. Data are the means ± SE, n =3. (C) The alternative splicing of exon 23 was detected by RT-PCR. Relative α/β represents the ratio of band intensities of α vs β isoform. GAPDH served as a loading control. (D) Western blot showed the overexpression of T7 tagged PCBP1 and the expression level of cellular STAT3α. GAPDH served as a loading control. (E) RT-PCR analysis showed that overexpression of PCBP1 downregulates the expression of STAT3 targets (Bcl-xL and survivin) in MCF-7 cells.
Figure 5
Figure 5
STAT3β inhibits the proliferation of OSCC cells and the expression of Bcl-xL and survivin. (A) CAL 27 or SCC-9 cells were stably transfected with STAT3β or control lentivirus. Cells were seeded into 12 well plates on Day 0. Cell numbers were counted on Day 2 and Day 4. (B) The histograms show statistically significant difference between the STAT3β overexpression and control groups on Day 4. Data are the means ± SE, n =3. (C) Western blot showed the overexpression of STAT3β. β-actin served as a loading control. (D) RT-PCR analysis showed that overexpression of STAT3β downregulates the expression of STAT3 targets (Bcl-xl and survivin) in both CAL 27 and SCC-9 cells. (E, F) Effect of STAT3β overexpression on the clonogenic ability of SCC-9 cells. One thousand cells were seeded in 6 cm dishes and cultured for 10 days. Representative images are shown (E). (F) The histograms summarized the numbers of colonies. Data are the means ± SE, n =3. (G) Overexpression of STAT3β decreased cell proliferation induced by PCBP1 knockdown in SCC-9 cells. SCC-9 cells were transfected with STAT3β, empty control plasmid (Vector), PCBP1 specific siRNA and/or non-specific (NS) siRNA. Transfected cells were divided to four groups: STAT3β + siPCBP1, STAT3β + NS, Vector + siPCBP1, and Vector + NS. Cell number was counted at Day 2 and Day 4. (H) The histograms summarized the numbers of cells counted on Day 4. Data are the means ± SE, n =3. (I) Western blot displayed the overexpression of STAT3β and knockdown efficiency of PCBP1. GAPDH served as a loading control.

Similar articles

Cited by

References

    1. Yu H, Lee H, Herrmann A. et al. Revisiting STAT3 signalling in cancer: New and unexpected biological functions. Nat Rev Cancer. 2014;14(11):736–46. - PubMed
    1. Beebe JD, Liu JY, Zhang JT. Two decades of research in discovery of anticancer drugs targeting STAT3, how close are we? Pharmacol Ther. 2018;191:74–91. - PubMed
    1. Mali SB. Review of STAT3 (Signal Transducers and Activators of Transcription) in head and neck cancer. Oral Oncol. 2015;51(6):565–9. - PubMed
    1. Baltz AG, Munschauer M, Schwanhausser B. et al. The mRNA-bound proteome and its global occupancy profile on protein-coding transcripts. Mol Cell. 2012;46(5):674–90. - PubMed
    1. Yang J, Liao X, Agarwal MK. et al. Unphosphorylated STAT3 accumulates in response to IL-6 and activates transcription by binding to NFkappaB. Genes Dev. 2007;21(11):1396–408. - PMC - PubMed

Publication types

MeSH terms