. 2019 Jun 14:7:21.
doi: 10.1186/s40462-019-0163-7. eCollection 2019.

Acoustic evaluation of behavioral states predicted from GPS tracking: a case study of a marine fishing bat

Affiliations

Acoustic evaluation of behavioral states predicted from GPS tracking: a case study of a marine fishing bat

Edward Hurme et al. Mov Ecol. .

Abstract

Background: Multiple methods have been developed to infer behavioral states from animal movement data, but rarely has their accuracy been assessed from independent evidence, especially for location data sampled with high temporal resolution. Here we evaluate the performance of behavioral segmentation methods using acoustic recordings that monitor prey capture attempts.

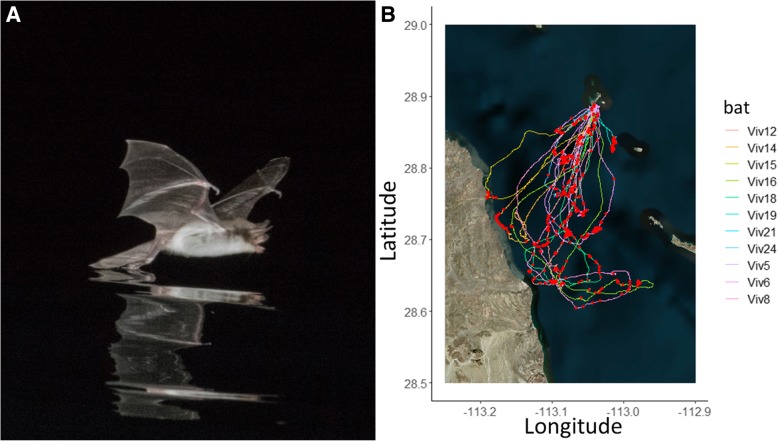
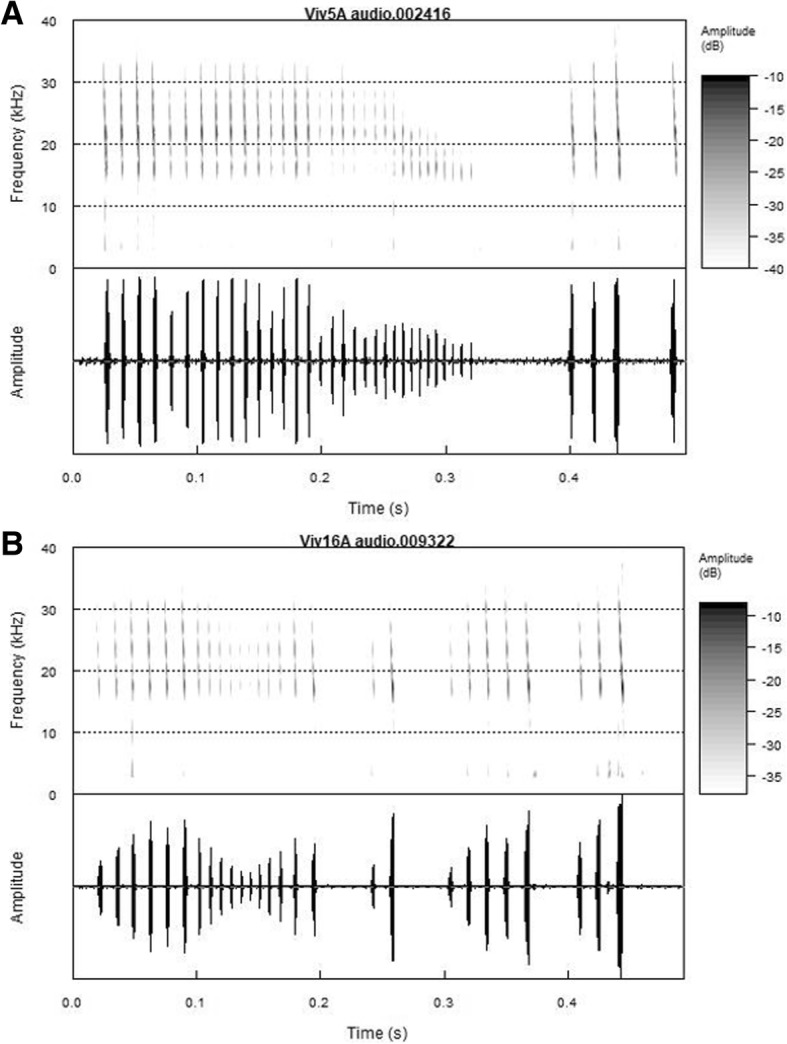
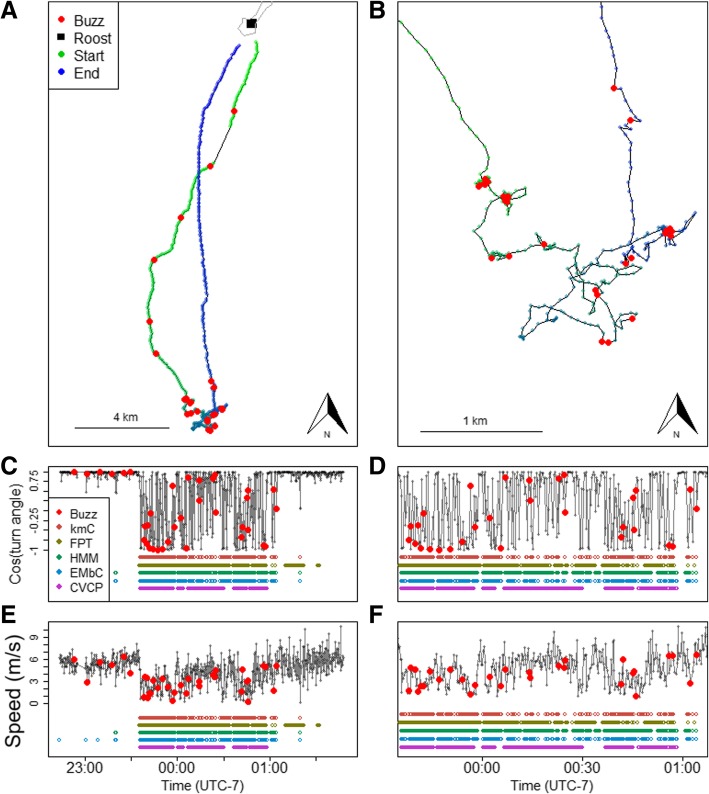
Methods: We recorded GPS locations and ultrasonic audio during the foraging trips of 11 Mexican fish-eating bats, Myotis vivesi, using miniature bio-loggers. We then applied five different segmentation algorithms (k-means clustering, expectation-maximization and binary clustering, first-passage time, hidden Markov models, and correlated velocity change point analysis) to infer two behavioral states, foraging and commuting, from the GPS data. To evaluate the inference, we independently identified characteristic patterns of biosonar calls ("feeding buzzes") that occur during foraging in the audio recordings. We then compared segmentation methods on how well they correctly identified the two behaviors and if their estimates of foraging movement parameters matched those for locations with buzzes.

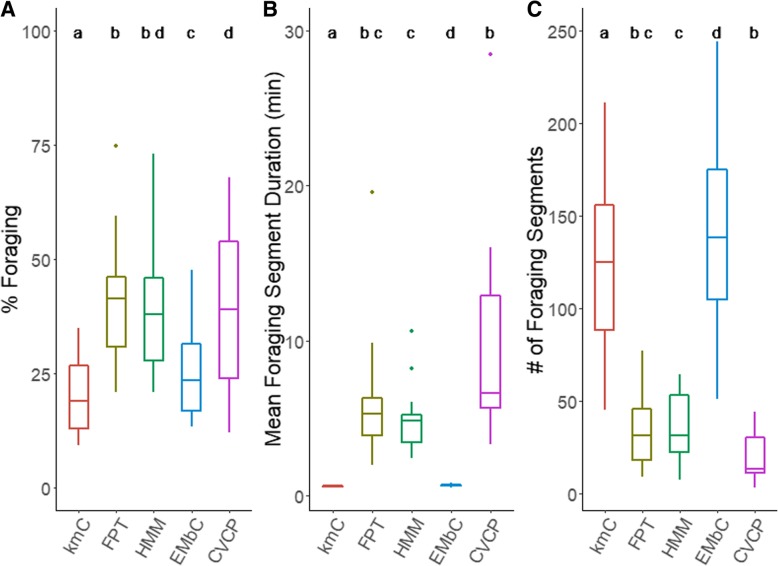
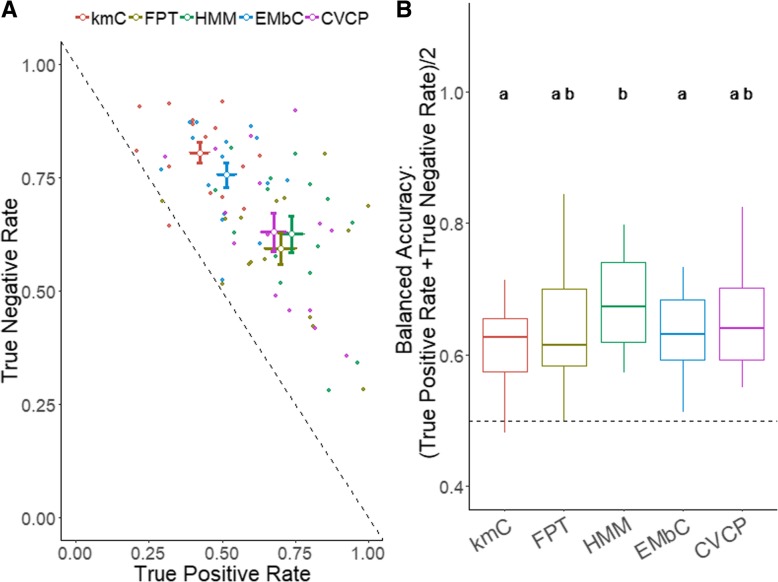
Results: While the five methods differed in the median percentage of buzzes occurring during predicted foraging events, or true positive rate (44-75%), a two-state hidden Markov model had the highest median balanced accuracy (67%). Hidden Markov models and first-passage time predicted foraging flight speeds and turn angles similar to those measured at locations with feeding buzzes and did not differ in the number or duration of predicted foraging events.

Conclusion: The hidden Markov model method performed best at identifying fish-eating bat foraging segments; however, first-passage time was not significantly different and gave similar parameter estimates. This is the first attempt to evaluate segmentation methodologies in echolocating bats and provides an evaluation framework that can be used on other species.

Keywords: Behavioral change point analysis; Correlated velocity movement; Expectation maximization and binary clustering; First-passage time; Foraging; GPS telemetry; Hidden Markov models; K-means; Path segmentation.


Conflict of interest statement

Competing interestsThe authors declare that they have no competing interest.

Figures

Fig. 1
Fig. 1
a Photo of a Mexican fish-eating bat (Myotis vivesi) trawling for prey and (b) a satellite map (“Esri.WorldImagery”) of the study area with GPS tracks of each foraging trip overlaid. These bats use biosonar to sense their environment, such as the ocean surface, and cue into small prey that might break the surface. Prey capture attempts, or feeding buzzes, recorded from an on-board ultrasonic microphone are overlaid on each trip. (Photo credit: Glenn Thompson)
Fig. 2
Fig. 2
Spectrogram (top) and waveform (bottom) of fish-eating bat echolocation calls. (a) Typical terminal buzz, (b) aborted buzz (ends at 0.2 s) followed by search phase calls
Fig. 3
Fig. 3
Box plots showing (a) the percentage of a trip in foraging behavior, (b) the number of locations in a foraging segment, and (c) the number of segments for each segmentation method (N = 15). Different letters above boxplots represent significant differences in paired Wilcoxon sign rank tests after Bonferroni correction
Fig. 4
Fig. 4
a Scatter plot of true positive rate against true negative rate (each point represents a bat flight and method combination) and (b) box plot of the balanced accuracy for each trip (N = 15). The scatter plot includes mean values of each method with standard error for true positive rate and true negative rate (a). A dashed line is included in both plots to show 50% balanced accuracy and values above the line represent good classification. Different letters above boxplots represent significant differences in paired Wilcoxon sign rank tests after Bonferroni correction (b)
Fig. 5
Fig. 5
Example trip showing (a) the flight trajectory, (c) cosine of the turn angle for the entire flight, and (d) speed for the entire flight. (b) displays a close-up of the foraging area in (a), (d) cosine of the turning angle for (b), and (f) speed for (b). Buzzes are overlaid as red circles in all plots and segmentation methodology predictions of foraging are shown in different colors below speed and turn angle plots (c-f). The number of foraging segments identified in this trip varies between methods (kmC: 145; FPT: 80; HMM: 31; EMbC: 138; CVCP: 13)

Similar articles

Cited by

References

    1. Hussey NE, Kessel ST, Aarestrup K, Cooke SJ, Cowley PD, Fisk AT, et al. Aquatic animal telemetry: a panoramic window into the underwater world. Science. 2015;348:1255642. doi: 10.1126/science.1255642. - DOI - PubMed
    1. Börger L. Stuck in motion? Reconnecting questions and tools in movement ecology. J Anim Ecol. 2016;85:5–10. doi: 10.1111/1365-2656.12464. - DOI - PubMed
    1. Kays R, Crofoot MC, Jetz W, Wikelski M. Terrestrial animal tracking as an eye on life and planet. Science. 2015;348:aaa2478. doi: 10.1126/science.aaa2478. - DOI - PubMed
    1. De Weerd N, Van Langevelde F, Van Oeveren H, Nolet BA, Kölzsch A, Prins HHT, et al. Deriving animal behaviour from high-frequency GPS: tracking cows in open and forested habitat. PLoS One. 2015;10. - PMC - PubMed
    1. Weimerskirch H, Pinaud D, Pawlowski F, Bost CA. Does prey capture induce area-restricted search? A fine-scale study using GPS in a marine predator, the wandering albatross. Am Nat. 2017;170:734. - PubMed

LinkOut - more resources