

The Role of Dietary Energy and Macronutrients Intake in Prevalence of Irritable Bowel Syndromes
- PMID: 31223623
- PMCID: PMC6541956
- DOI: 10.1155/2019/8967306
The Role of Dietary Energy and Macronutrients Intake in Prevalence of Irritable Bowel Syndromes
Abstract
Background: Irritable bowel syndrome (IBS) is a chronic gastrointestinal disorder characterized by abdominal pain and altered bowel habits in the absence of any detectable organic illnesses. Interest in the effect of dietary opponents to the IBS pathogenesis has been increased in recent years. This study aims to review previous studies to determine the relationship between IBS prevalence in community and dietary energy and macronutrients intakes according to the national nutrition surveys.
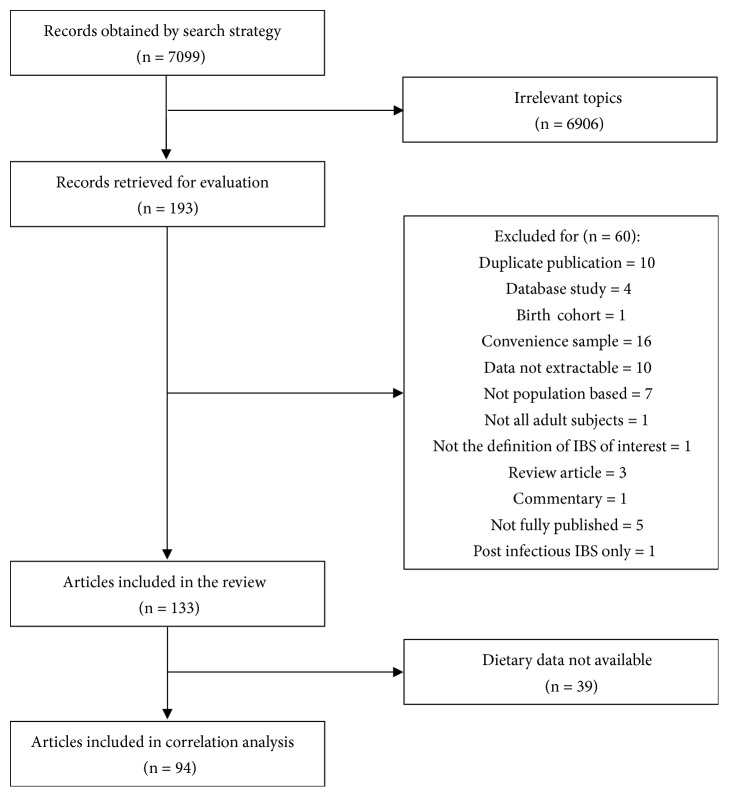
Methods: A literature search was conducted in PubMed and EMBASE to September, 2018, to identify population-based studies that reported the prevalence of IBS. Daily energy intake, daily carbohydrates, and protein and fat percent contribution to energy intake (%) were obtained from study population-based national nutrition survey. The correlations of prevalence of IBS and dietary intakes were obtained by Spearman coefficient or Pearson coefficient.
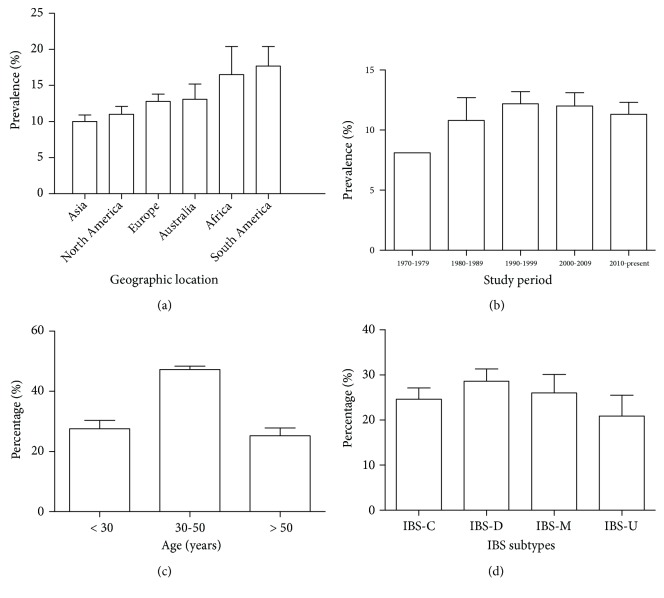
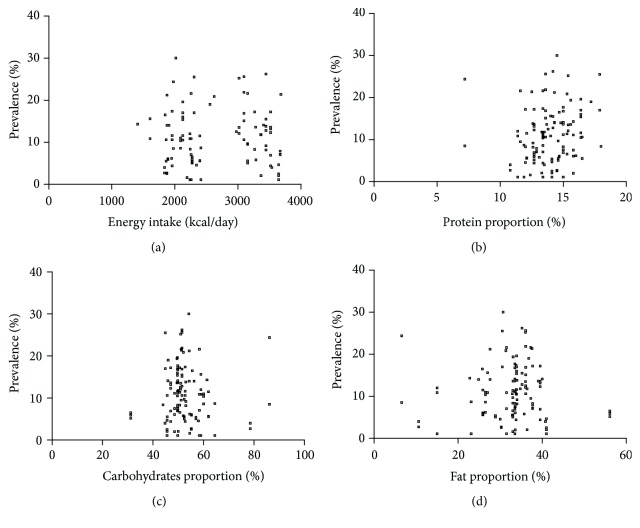
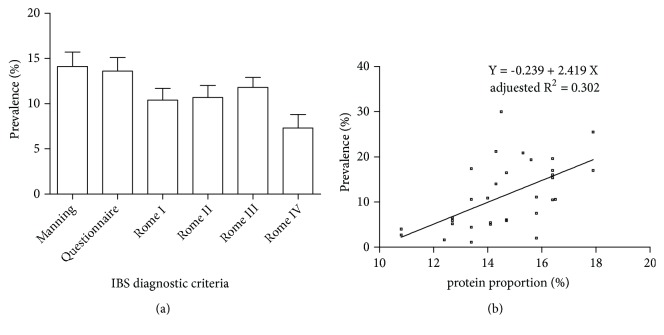
Results: Global prevalence of IBS was 11.7%. There was no correlation between overall prevalence of IBS of individual countries and national energy intake (P = 0.785), protein proportion (P = 0.063), carbohydrates proportion (P = 0.505), or fat proportion (P = 0.384) according to the years when the studies were conducted. No correlations were detected between dietary intake and male or female IBS prevalence. Interestingly, protein proportion was positively correlated with the prevalence of IBS in Rome III criteria (r = 0.569).
Conclusion: Our findings demonstrate that dietary energy and macronutrients intake do not play a direct role in prevalence of IBS. However, IBS diagnostic criteria seem to have a bias on the correlation between prevalence of IBS and dietary intake. Further studies are needed to confirm the correlation between prevalence of IBS and specific dietary intake.
Figures
Similar articles
-
The relationship between dietary intakes and prevalence of irritable bowel syndrome in adolescent girls: A cross-sectional study.Indian J Gastroenterol. 2021 Apr;40(2):220-226. doi: 10.1007/s12664-020-01126-8. Epub 2021 Mar 5. Indian J Gastroenterol. 2021. PMID: 33666888
-
Dietary intakes in people with irritable bowel syndrome.BMC Gastroenterol. 2011 Feb 3;11:9. doi: 10.1186/1471-230X-11-9. BMC Gastroenterol. 2011. PMID: 21291551 Free PMC article.
-
Association between Dietary Habits and Fecal Microbiota Composition in Irritable Bowel Syndrome Patients: A Pilot Study.Nutrients. 2021 Apr 27;13(5):1479. doi: 10.3390/nu13051479. Nutrients. 2021. PMID: 33925672 Free PMC article.
-
Global prevalence of irritable bowel syndrome according to Rome III or IV criteria: a systematic review and meta-analysis.Lancet Gastroenterol Hepatol. 2020 Oct;5(10):908-917. doi: 10.1016/S2468-1253(20)30217-X. Epub 2020 Jul 20. Lancet Gastroenterol Hepatol. 2020. PMID: 32702295
-
A systematic review and meta-analysis of diet and nutrient intake in adults with irritable bowel syndrome.Neurogastroenterol Motil. 2024 Jan;36(1):e14698. doi: 10.1111/nmo.14698. Epub 2023 Oct 27. Neurogastroenterol Motil. 2024. PMID: 37897138 Free PMC article.
Cited by
-
Tegaserod for the Treatment of Irritable Bowel Syndrome.Antiinflamm Antiallergy Agents Med Chem. 2020;19(4):342-369. doi: 10.2174/1871523018666190911121306. Antiinflamm Antiallergy Agents Med Chem. 2020. PMID: 31518227 Free PMC article. Review.
-
Heart Rate Variability-An Index of the Efficacy of Complementary Therapies in Irritable Bowel Syndrome: A Systematic Review.Nutrients. 2022 Aug 22;14(16):3447. doi: 10.3390/nu14163447. Nutrients. 2022. PMID: 36014953 Free PMC article.
-
Downregulated APOD and FCGR2A correlates with immune infiltration and lipid-induced symptoms of irritable bowel syndrome.Sci Rep. 2023 Aug 30;13(1):14211. doi: 10.1038/s41598-023-41004-9. Sci Rep. 2023. PMID: 37648784 Free PMC article.
-
Bile Acids and Microbiome Among Individuals With Irritable Bowel Syndrome and Healthy Volunteers.Biol Res Nurs. 2021 Jan;23(1):65-74. doi: 10.1177/1099800420941255. Epub 2020 Jul 15. Biol Res Nurs. 2021. PMID: 32666807 Free PMC article.
References
Publication types
MeSH terms
LinkOut - more resources
Full Text Sources
