

On the Neuromodulatory Pathways of the In Vivo Brain by Means of Transcranial Focused Ultrasound
- PMID: 31223668
- PMCID: PMC6585998
- DOI: 10.1016/j.cobme.2018.10.004
On the Neuromodulatory Pathways of the In Vivo Brain by Means of Transcranial Focused Ultrasound
Abstract
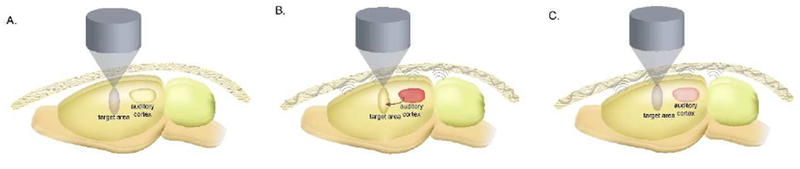
For last decade, low-intensity transcranial focused ultrasound (tFUS) has been rapidly developed for a myriad of successful applications in neuromodulation. tFUS possesses high spatial resolution, focality and depth penetration as a noninvasive neuromodulation tool. Despite the promise, confounding activation can be observed in rodents when stimulation parameters are not selected carefully. Here we summarize the existing classes of observations for ultrasound neuromodulation: ultrasound directly activates a localized area, or ultrasound indirectly activates auditory pathways, which further propagates to other cortical networks. We also present control in vivo animal studies, which suggest that underlying tFUS brain modulation is characterized by localized activation independent of auditory networks activations.
Keywords: brain stimulation; low-intensity focused ultrasound; neuromodulation; tFUS; transcranial focused ultrasound.
Conflict of interest statement
Conflict of interest The authors declare no conflict of interest.
Figures
Similar articles
-
Transcranial focused ultrasound remotely modulates extrastriate visual cortex by stimulating frontal eye field with subregion specificity.J Neural Eng. 2024 Nov 28;21(6):066018. doi: 10.1088/1741-2552/ad9406. J Neural Eng. 2024. PMID: 39556944 Free PMC article.
-
Numerical and experimental evaluation of low-intensity transcranial focused ultrasound wave propagation using human skulls for brain neuromodulation.Med Phys. 2023 Jan;50(1):38-49. doi: 10.1002/mp.16090. Epub 2022 Nov 24. Med Phys. 2023. PMID: 36342303 Free PMC article.
-
Transcranial Focused Ultrasound Remotely Modulates Extrastriate Visual Cortex with Subregion Specificity.bioRxiv [Preprint]. 2024 Jan 22:2024.01.20.576476. doi: 10.1101/2024.01.20.576476. bioRxiv. 2024. Update in: J Neural Eng. 2024 Nov 28;21(6). doi: 10.1088/1741-2552/ad9406. PMID: 38328120 Free PMC article. Updated. Preprint.
-
A review of functional neuromodulation in humans using low-intensity transcranial focused ultrasound.Biomed Eng Lett. 2024 Mar 2;14(3):407-438. doi: 10.1007/s13534-024-00369-0. eCollection 2024 May. Biomed Eng Lett. 2024. PMID: 38645585 Free PMC article. Review.
-
Transcranial Focused Ultrasound (tFUS) and Transcranial Unfocused Ultrasound (tUS) Neuromodulation: From Theoretical Principles to Stimulation Practices.Front Neurol. 2019 Jun 11;10:549. doi: 10.3389/fneur.2019.00549. eCollection 2019. Front Neurol. 2019. PMID: 31244747 Free PMC article. Review.
Cited by
-
Closed-Loop Transcranial Ultrasound Stimulation for Real-Time Non-invasive Neuromodulation in vivo.Front Neurosci. 2020 May 12;14:445. doi: 10.3389/fnins.2020.00445. eCollection 2020. Front Neurosci. 2020. PMID: 32477055 Free PMC article.
-
Effect of low-intensity transcranial ultrasound stimulation on theta and gamma oscillations in the mouse hippocampal CA1.Front Psychiatry. 2023 Apr 20;14:1151351. doi: 10.3389/fpsyt.2023.1151351. eCollection 2023. Front Psychiatry. 2023. PMID: 37151980 Free PMC article.
-
Phase-locked closed-loop ultrasound stimulation modulates theta and gamma rhythms in the mouse hippocampus.Front Neurosci. 2022 Sep 8;16:994570. doi: 10.3389/fnins.2022.994570. eCollection 2022. Front Neurosci. 2022. PMID: 36161160 Free PMC article.
-
Therapeutic Potential of Ultrasound Neuromodulation in Decreasing Neuropathic Pain: Clinical and Experimental Evidence.Curr Neuropharmacol. 2021;19(3):334-348. doi: 10.2174/1570159X18666200720175253. Curr Neuropharmacol. 2021. PMID: 32691714 Free PMC article. Review.
-
Transcranial ultrasound neuromodulation induces neuronal correlation change in the rat somatosensory cortex.J Neural Eng. 2022 Sep 6;19(5):10.1088/1741-2552/ac889f. doi: 10.1088/1741-2552/ac889f. J Neural Eng. 2022. PMID: 35947970 Free PMC article.
References
-
- Naor O, Krupa S, Shoham S: Ultrasonic neuromodulation. J Neural Eng 2016, 13:031003. - PubMed
-
- Tyler WJ, Lani SW, Hwang GM: Ultrasonic modulation of neural circuit activity. Curr Opin Neurobiol 2018, 50:222–231. - PubMed
-
- Bystritsky A, Korb AS: A Review of Low-Intensity Transcranial Focused Ultrasound for Clinical Applications. Current Behavioral Neuroscience Reports 2015, 2:60–66.
-
- Quadri SA, Waqas M, Khan I, Khan MA, Suriya SS, Farooqui M, Fiani B: High-intensity focused ultrasound: past, present, and future in neurosurgery. Neurosurg Focus 2018, 44:E16. - PubMed
-
- FDA: Information for Manufacturers Seeking Marketing Clearance of Diagnostic Ultrasound Systems and Transducers. Edited by Services USDHaH. Rockville, MD: Center for Devices and Radiological Health; 2008.
Grants and funding
LinkOut - more resources
Full Text Sources
Other Literature Sources