

The primary cilium protein folliculin is part of the autophagy signaling pathway to regulate epithelial cell size in response to fluid flow
- PMID: 31225504
- PMCID: PMC6551741
- DOI: 10.15698/cst2019.03.180
The primary cilium protein folliculin is part of the autophagy signaling pathway to regulate epithelial cell size in response to fluid flow
Abstract
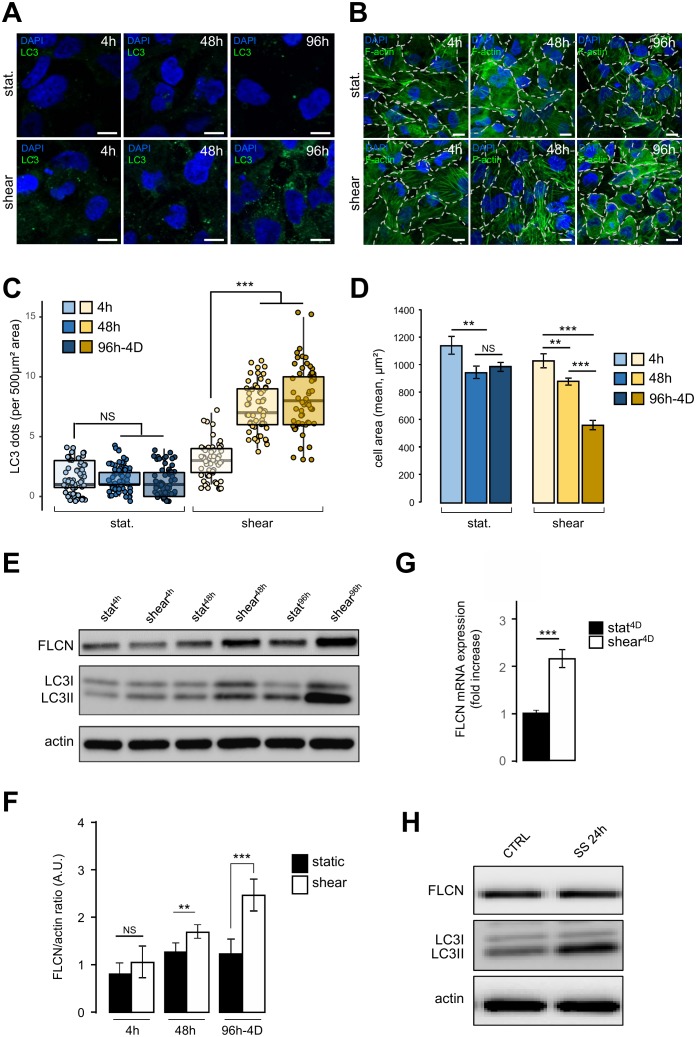
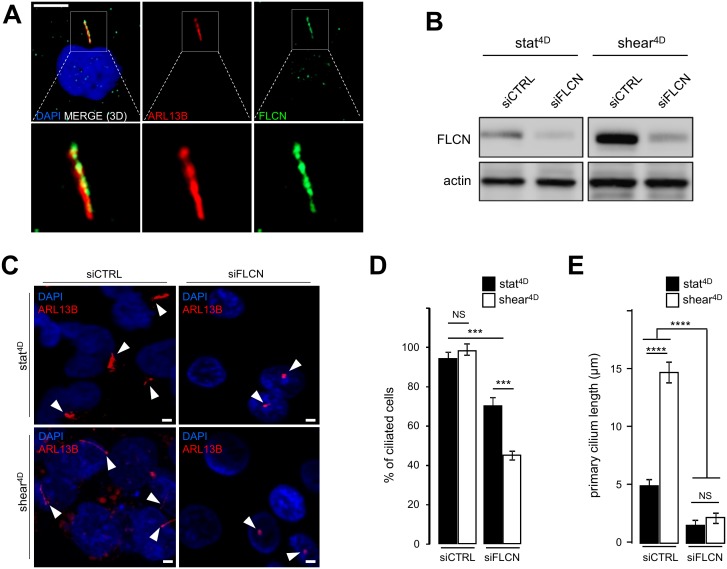
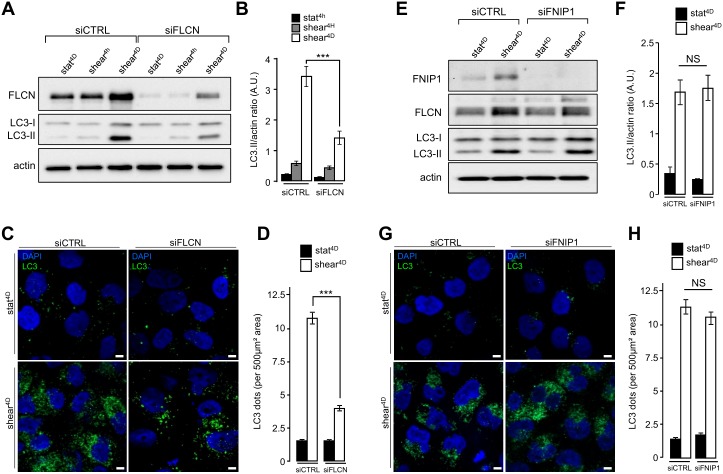
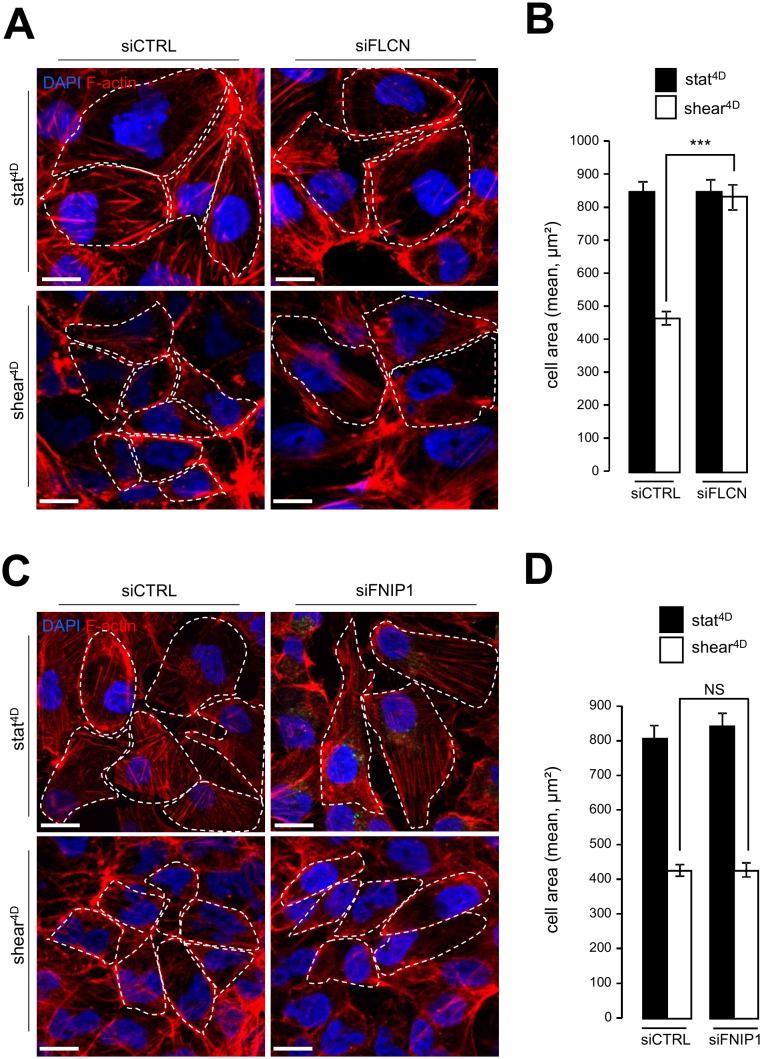
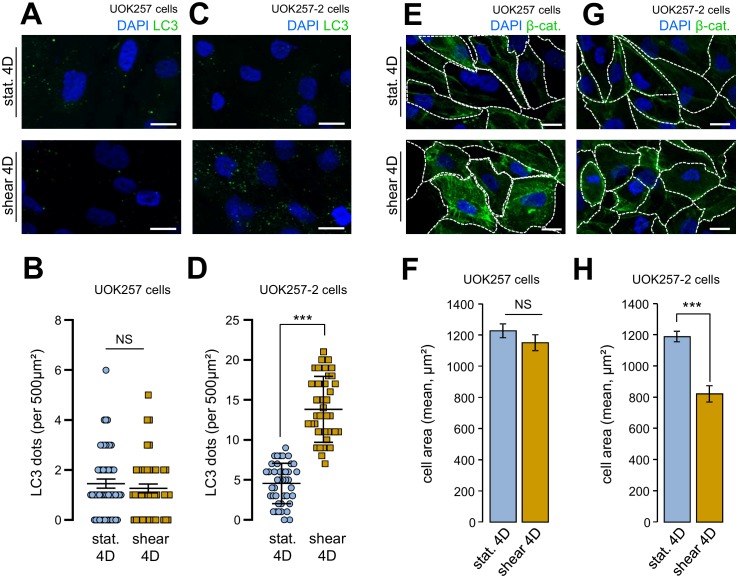
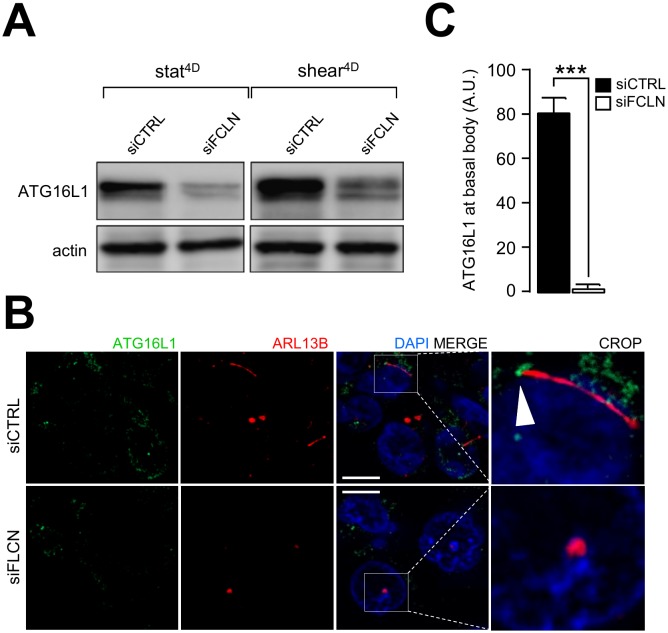
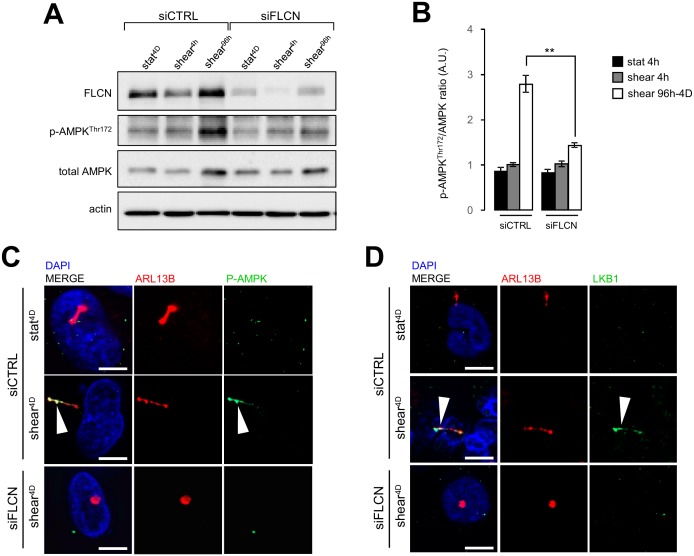
Autophagy is a conserved molecular pathway directly involved in the degradation and recycling of intracellular components. Autophagy is associated with a response to stress situations, such as nutrients deficit, chemical toxicity, mechanical stress or microbial host defense. We have recently shown that primary cilium-dependent autophagy is important to control kidney epithelial cell size in response to fluid flow induced shear stress. Here we show that the ciliary protein folliculin (FLCN) actively participates to the signaling cascade leading to the stimulation of fluid flow-dependent autophagy upstream of the cell size regulation in HK2 kidney epithelial cells. The knockdown of FLCN induces a shortening of the primary cilium, inhibits the activation of AMPK and the recruitment of the autophagy protein ATG16L1 at the primary cilium. Altogether, our results suggest that FLCN is essential in the dialog between autophagy and the primary cilium in epithelial cells to integrate shear stress-dependent signaling.
Keywords: autophagy; fluid flow; folliculin; primary cilium; shear stress.
Conflict of interest statement
Conflict of interest: The authors declare that there is no conflict of interests.
Figures
Similar articles
-
Primary cilium-dependent autophagy drafts PIK3C2A to generate PtdIns3P in response to shear stress.Autophagy. 2020 Jun;16(6):1143-1144. doi: 10.1080/15548627.2020.1732687. Epub 2020 Mar 1. Autophagy. 2020. PMID: 32102612 Free PMC article.
-
The AMPK-Sirtuin 1-YAP axis is regulated by fluid flow intensity and controls autophagy flux in kidney epithelial cells.Nat Commun. 2023 Dec 5;14(1):8056. doi: 10.1038/s41467-023-43775-1. Nat Commun. 2023. PMID: 38052799 Free PMC article.
-
PI3KC2α-dependent and VPS34-independent generation of PI3P controls primary cilium-mediated autophagy in response to shear stress.Nat Commun. 2020 Jan 15;11(1):294. doi: 10.1038/s41467-019-14086-1. Nat Commun. 2020. PMID: 31941925 Free PMC article.
-
Primary cilium-dependent autophagy in the response to shear stress.Biochem Soc Trans. 2021 Dec 17;49(6):2831-2839. doi: 10.1042/BST20210810. Biochem Soc Trans. 2021. PMID: 34747995 Review.
-
New Roles of the Primary Cilium in Autophagy.Biomed Res Int. 2017;2017:4367019. doi: 10.1155/2017/4367019. Epub 2017 Aug 23. Biomed Res Int. 2017. PMID: 28913352 Free PMC article. Review.
Cited by
-
Autophagy and the primary cilium in cell metabolism: What's upstream?Front Cell Dev Biol. 2022 Nov 9;10:1046248. doi: 10.3389/fcell.2022.1046248. eCollection 2022. Front Cell Dev Biol. 2022. PMID: 36438551 Free PMC article. Review.
-
Human Cytomegalovirus Inhibits Autophagy of Renal Tubular Epithelial Cells and Promotes Cellular Enlargement.Front Cell Infect Microbiol. 2020 Sep 15;10:474. doi: 10.3389/fcimb.2020.00474. eCollection 2020. Front Cell Infect Microbiol. 2020. PMID: 33042861 Free PMC article.
-
Primary cilia and the reciprocal activation of AKT and SMAD2/3 regulate stretch-induced autophagy in trabecular meshwork cells.Proc Natl Acad Sci U S A. 2021 Mar 30;118(13):e2021942118. doi: 10.1073/pnas.2021942118. Proc Natl Acad Sci U S A. 2021. PMID: 33753495 Free PMC article.
-
The Male Mouse Meiotic Cilium Emanates from the Mother Centriole at Zygotene Prior to Centrosome Duplication.Cells. 2022 Dec 29;12(1):142. doi: 10.3390/cells12010142. Cells. 2022. PMID: 36611937 Free PMC article.
-
Crosstalk between cilia and autophagy: implication for human diseases.Autophagy. 2023 Jan;19(1):24-43. doi: 10.1080/15548627.2022.2067383. Epub 2022 May 25. Autophagy. 2023. PMID: 35613303 Free PMC article. Review.
References
-
- Orhon I, Dupont N, Zaidan M, Boitez V, Burtin M, Schmitt A, Capiod T, Viau A, Beau I, Wolfgang Kuehn E, Friedlander G, Terzi F, Codogno P. Primary-cilium-dependent autophagy controls epithelial cell volume in response to fluid flow. Nat Cell Biol. 2016;18(6):657–67. doi: 10.1038/ncb3360. - DOI - PubMed
-
- Luijten MNH, Basten SG, Claessens T, Vernooij M, Scott CL, Janssen R, Easton JA, Kamps MAF, Vreeburg M, Broers JLV, van Geel M, Menko FH, Harbottle RP, Nookala RK, Tee AR, Land SC, Giles RH, Coull BJ, van Steensel MAM. Birt–Hogg–Dubé syndrome is a novel ciliopathy. Hum Mol Genet. 2013;22(21):4383–4397. doi: 10.1093/hmg/ddt288. - DOI - PMC - PubMed
LinkOut - more resources
Full Text Sources