Review
. 2019 Sep 15:5:373-397.
doi: 10.1146/annurev-vision-091718-014809. Epub 2019 Jun 21.

Scene Perception in the Human Brain

Affiliations
Review

Scene Perception in the Human Brain

Russell A Epstein et al. Annu Rev Vis Sci. .

Abstract

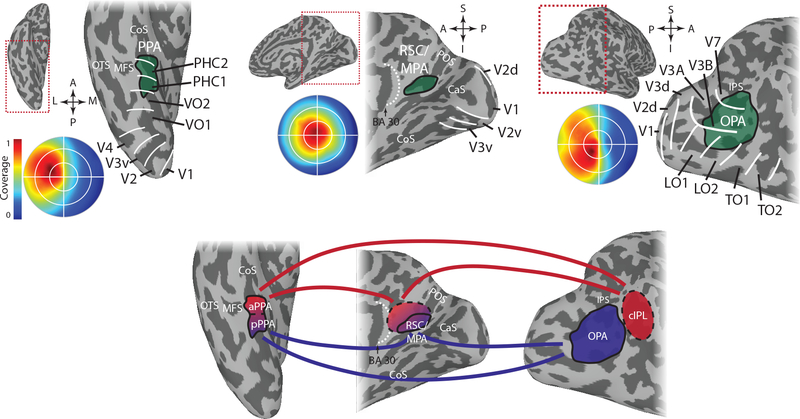
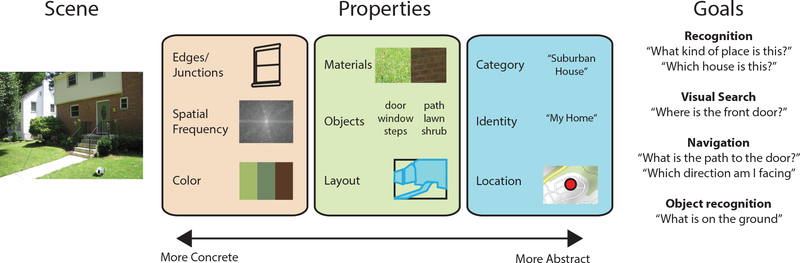
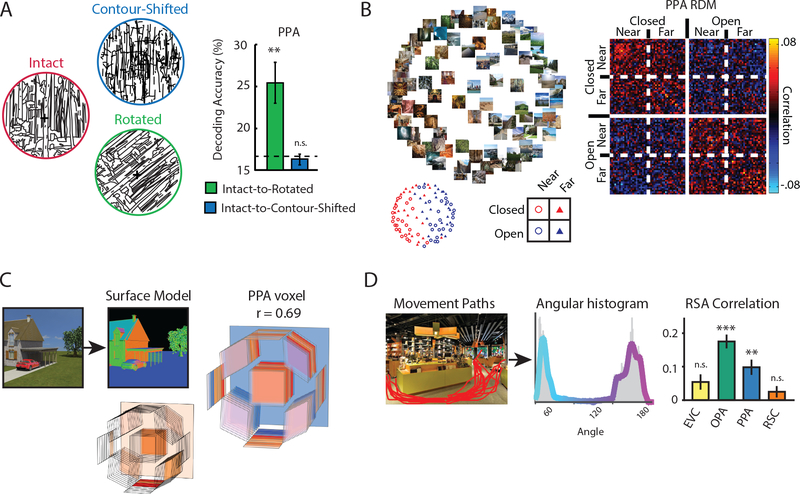
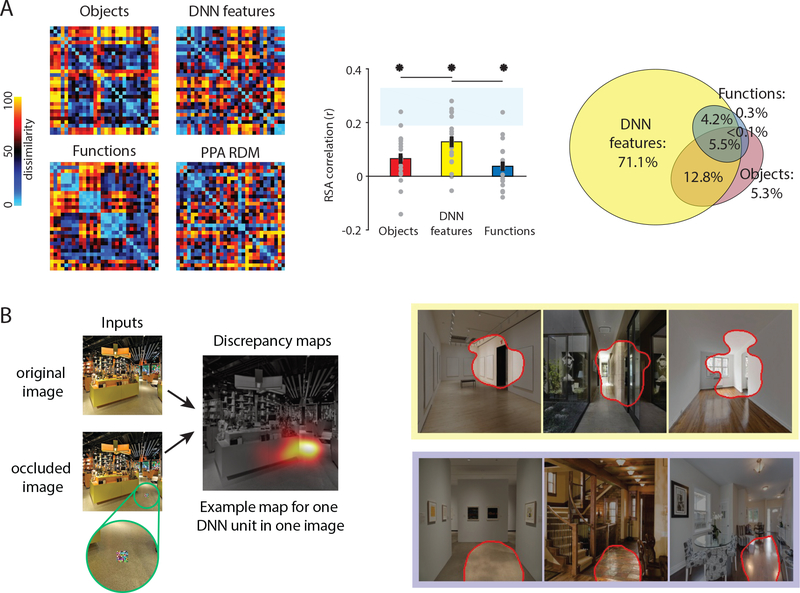
Humans are remarkably adept at perceiving and understanding complex real-world scenes. Uncovering the neural basis of this ability is an important goal of vision science. Neuroimaging studies have identified three cortical regions that respond selectively to scenes: parahippocampal place area, retrosplenial complex/medial place area, and occipital place area. Here, we review what is known about the visual and functional properties of these brain areas. Scene-selective regions exhibit retinotopic properties and sensitivity to low-level visual features that are characteristic of scenes. They also mediate higher-level representations of layout, objects, and surface properties that allow individual scenes to be recognized and their spatial structure ascertained. Challenges for the future include developing computational models of information processing in scene regions, investigating how these regions support scene perception under ecologically realistic conditions, and understanding how they operate in the context of larger brain networks.

Keywords: functional magnetic resonance imaging; hippocampus; neural networks; spatial navigation; visual cortex; visual recognition.


Figures

Figure 1.
Figure 1.. Scene-selective cortical regions.
A) Group average data showing the location of the scene-selective cortical regions with respect to anatomy and retinotopically-defined areas. The circular insets show the portion of the visual field eliciting the strongest response within each scene region based on population receptive field mapping. PPA (left) is located in and around the collateral sulcus on the medial part of the ventral temporal cortex. It overlaps with retinotopically defined regions PHC-1, PHC-2 and VO-2 and responds most strongly to stimuli in the contralateral upper visual field. RSC/MPA (middle) is located in medial parietal cortex in and around the ventral portion of the parieto-occipital sulcus. It responds most strongly to stimuli in the contralateral visual field with no clear bias to the upper or lower visual field. OPA (right) is located near the transverse occipital sulcus in occipito-parietal cortex. It overlaps most prominently with V3B and LO2, but also with V3A, V7/IPS0, and LO1, and responds most strongly to stimuli in the contralateral lower visual field. B) Relationship between the different regions based on functional connectivity. There is strong functional connectivity between all three regions, but posterior PPA (pPPA) shows stronger connectivity to OPA and posterior parts of RSC/MPA, while anterior PPA (aPPA) shows stronger connectivity with the caudal inferior parietal lobe (cIPL), a region anterior to OPA, and anterior parts of RSC/MPA as well as adjoining regions in posterior cingulate cortex. This pattern of functional connectivity might reflect separate networks for perceptual (pPPA, OPA, posterior RSC/MPA) and memory-based (aPPA, cIPL, anterior RSC/MPA) processing. COS – collateral sulcus, OTS – occipitotemporal sulcus, MFS – mid-fusiform sulcus, CaS – calcarine sulcus, POS – parieto-occipital sulcus, IPS – intraparietal sulcus
Figure 2.
Figure 2.. Scene perception depends on both multi-level properties of the image and the observer’s goals.
The visual system analyzes many properties of scenes, ranging from low-level features (e.g. edges, color) to mid-level elements (e.g. layout, objects) to high-level semantic and spatial properties (e.g. scene category). The results of these analyses can be used in the service of several different behavioral goals. Note that although we group properties into three levels for exposition, these levels are notional, as properties at different levels are inherently correlated, and consequently there may not be a strict low-to-high hierarchy of processing.
Figure 3.
Figure 3.. Representations of the spatial structure of scenes
A) Results from an fMRI study showing that scene representations in PPA rely on contour junctions, an important cue for the three-dimensional arrangement of scene surfaces. Multivoxel patterns were measured for line drawings depicting 6 scene categories. Category could be cross-decoded between original (intact) and rotated line drawings, but not between original (intact) and contour-shifted line drawings. The first manipulation preserves the contour junctions in the stimulus, while the second manipulation destroys them. Similar results were obtained in OPA. B) Results from an fMRI study showing that scene representations in PPA are organized by spatial structure. Multivoxel activation patterns in the PPA were measured for 96 scenes. Multidimensional scaling of these data (left) reveals grouping of scenes based on layout (open vs. closed). The representational dissimilarity matrix (right) shows a clear distinction between open and closed scenes. C) Results from an fMRI study showing that individual voxels in PPA respond to scenes based on layout-defining surfaces. Artificial scenes were modelled in terms of a histogram of surfaces at different tilt/slant and depth. Responses of voxels in scene regions could be predicted based on this model. Right shows a PPA voxel that exhibits a complex sensitivity, including strong response to fronto-parallel surfaces at intermediate distances. D) The navigational affordances (i.e. pathways for movement) of scenes were evaluated by a set of raters, and then quantified in terms of an angular histogram. Representational similarities between multivoxel patterns in OPA (and, to a lesser extent, PPA) were related to these affordances.
Figure 4.
Figure 4.. Computational approaches to understanding scene perception in the brain.
A) Multivoxel fMRI patterns in PPA were obtained for 30 scene categories, and the resulting representational dissimilarity matrix (RDM) was compared to RDMs for three possible models of scene processing. Dissimilarity in the Objects model was based on the objects present within each scene; dissimilarity in the DNN features model was based on activation in a deep neural network trained on object classification; and dissimilarity in the Functions model was based on types of actions (e.g. walking, vacuuming) that could be carried out in each scene. Categories (e.g. bus depot, putting green, volcano, pier) were chosen to maximally differentiate between the three models. Middle panel shows that the RDMs for all three models correlate with the PPA RDM, with the strongest correlation for the DNN feature model. Right panel shows the results of variance partitioning, showing that much of the PPA variance explained by the Object and Functions models is shared with the DNN features model, which explains the most unique variance. Total response variance accounted for by all three models was 14.8%. B) In an in silico experiment, the response profiles of individual DNN units were assessed by comparing response to an unaltered image with response to the same image overlaid with a small occluder. A discrepancy map showing the portion of the image that the unit responds to was created by varying the location of the occluder. On the right are discrepancy maps of three scenes for two DNN units that were previously shown to convey information about navigational affordances. The top unit appears to respond to features related to doorways; the bottom unit appears to respond to open spaces along the ground plane.

References

    1. Aguirre GK, D’Esposito M. 1999. Topographical disorientation: a synthesis and taxonomy. Brain 122: 1613–28 - PubMed
    1. Aguirre GK, Zarahn E, D’Esposito M. 1998. An area within human ventral cortex sensitive to “building” stimuli: Evidence and implications. Neuron 21: 373–83 - PubMed
    1. Alexander AS, Nitz DA. 2015. Retrosplenial cortex maps the conjunction of internal and external spaces. Nat Neurosci 18: 1143–51. - PubMed
    1. Aminoff EM, Kveraga K, Bar M. 2013. The role of the parahippocampal cortex in cognition. Trends Cogn Sci 17: 379–90 - PMC - PubMed
    1. Amit E, Mehoudar E, Trope Y, Yovel G. 2012. Do object-category selective regions in the ventral visual stream represent perceived distance information? Brain Cogn 80: 201–13 - PubMed

Publication types

LinkOut - more resources