. 2019 Jun 21;13(6):e0007468.
doi: 10.1371/journal.pntd.0007468. eCollection 2019 Jun.

Assessing dengue control in Tokyo, 2014

Affiliations

Assessing dengue control in Tokyo, 2014

Baoyin Yuan et al. PLoS Negl Trop Dis. .

Abstract

Background: In summer 2014, an autochthonous outbreak of dengue occurred in Tokyo, Japan, in which Yoyogi Park acted as the focal area of transmission. Recognizing the outbreak, concerted efforts were made to control viral spread, which included mosquito control, public announcement of the outbreak, and a total ban on entering the park. We sought to assess the effectiveness of these control measures.

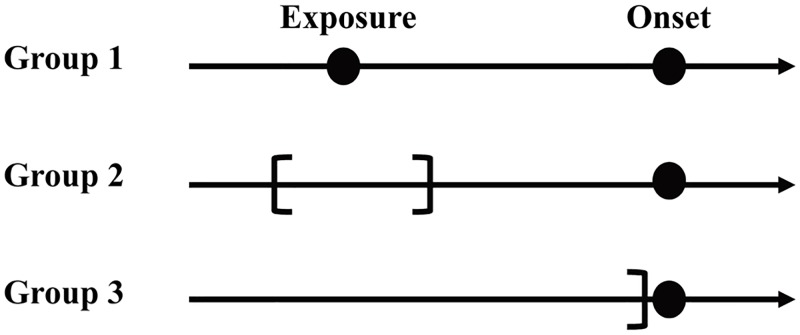
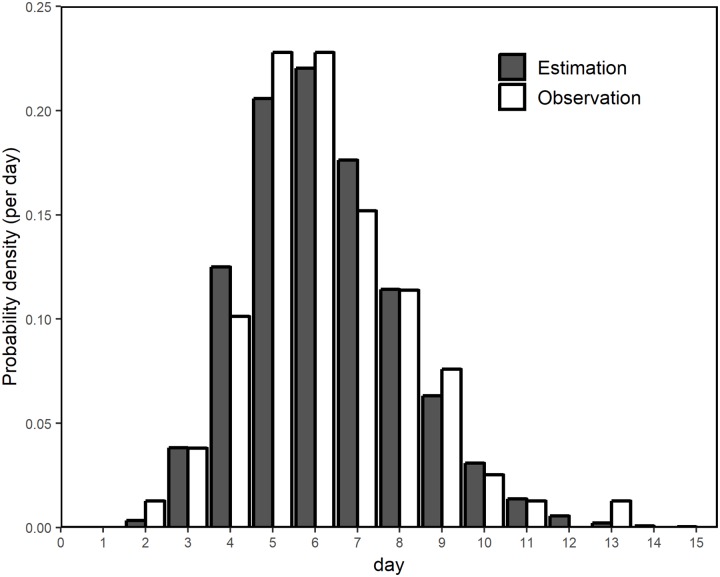
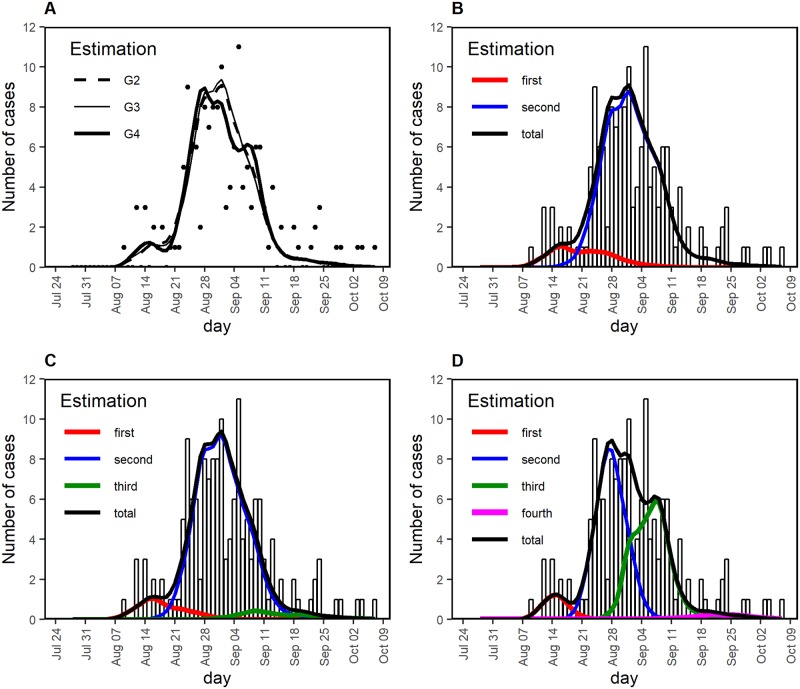
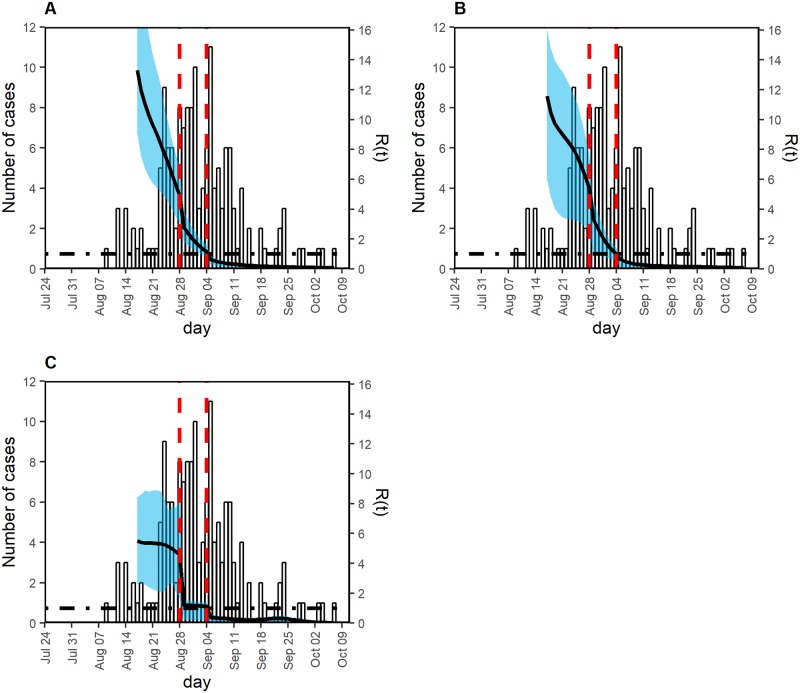
Methodology/principal findings: We used a mathematical model to describe the transmission dynamics. Using dates of exposure and illness onset, we categorized cases into three groups according to the availability of these datasets. The infection process was parametrically modeled by generation, and convolution of the infection process and the incubation period was fitted to the data. By estimating the effective reproduction number, we determined that the effect of dengue risk communication together with mosquito control from 28 August 2014 was insufficiently large to lower the reproduction number to below 1. However, once Yoyogi Park was closed on 4 September, the value of the effective reproduction number began to fall below 1, and the associated relative reduction in the effective reproduction number was estimated to be 20%-60%. The mean incubation period was an estimated 5.8 days.

Conclusions/significance: Regardless of the assumed number of generations of cases, the combined effect of mosquito control, risk communication, and park closure appeared to be successful in interrupting the chain of dengue transmission in Tokyo.


Conflict of interest statement

The authors have declared that no competing interests exist.

Figures

Fig 1
Fig 1. Illustrated time of exposure and classification of cases.
In the present study, diagnosed cases of dengue virus fell into one of three groups. In Group 1, the exact date of exposure was known. In Group 2, exposure dates were interval censored, calling for interval-censored likelihood. In Group 3, no information was available with respect to time of exposure. Depending on this grouping, we used slightly different likelihood functions.
Fig 2
Fig 2. Comparison between observed and estimated distributions of the incubation period.
Horizontal axis represents the incubation period of dengue virus infection, i.e., the time from mosquito exposure to illness onset. Grey bars represent observed frequency of the incubation period; white bars represent the estimated probability distribution.
Fig 3
Fig 3. Comparison between observed and estimated epidemic curves of the 2014 dengue outbreak in Tokyo.
(A) Total number of cases with time of illness onset. Black dots show the observed number of cases; lines are derived from mathematical models with different numbers of assumed generations of infection, G2, G3, and G4, representing a total number of generations of 2, 3, and 4, excluding generation zero. (B–D) Comparison between observed and estimated cases by different numbers of assumed generations of infection, G2, G3, and G4, corresponding to panels B, C, and D, respectively. The observed number of cases is shown as bars. Red, blue, green, and magenta lines depict the estimated cases generated by first, second, third, fourth generation cases, respectively. Black line represents the estimated total number of cases.
Fig 4
Fig 4. Effective reproduction number in three models with a different number of generations.
Left vertical axis shows the observed number of cases (i.e., incidence as a function of the date of illness onset), and the right vertical axis shows the effective reproduction number, illustrated using a black solid line. Two red vertical dashed lines indicate times at which interventions started. The earlier one (from 28 August) included mosquito control and dissemination of outbreak information via mass media. The later vertical line indicates the date on which Yoyogi Park was closed. Black dot-dashed horizontal line indicates the threshold value 1 for the effective reproduction number, below which the outbreak will eventually be controlled. The effective reproduction number was estimated, assuming three different numbers of generations of infection, i.e., (A) two, (B) three, and (C) four generations excluding generation zero. Owing to the uncertainty of estimation during the very early stage of the epidemic, the effective reproduction number was plotted from 17 August. The shaded cyan area represents the 95% confidence interval (CI) of the effective reproduction number, calculated using 100 bootstrap samples.

References

    1. Centers for Disease Control and Prevention. Dengue. 2018. San Juan: Dengue Branch. https://www.cdc.gov/dengue/entomologyecology/index.html
    1. Gubler DJ. Dengue and dengue hemorrhagic fever. Clin Microbiol Rev. 1998;11: 480–496. - PMC - PubMed
    1. Lambrechts L, Scott TW, Gubler DJ. Consequences of the expanding global distribution of Aedes albopictus for dengue virus transmission. PLoS Negl Trop Dis. 2010;4: e646 10.1371/journal.pntd.0000646 - DOI - PMC - PubMed
    1. Carrington LB, Simmons CP. Human to mosquito transmission of dengue viruses. Front Immunol. 2014;5: 290 10.3389/fimmu.2014.00290 - DOI - PMC - PubMed
    1. Simmons CP, Farrar JJ, Chau NV, Wills B. Dengue. N Engl J Med. 2012;366: 1423–1432. 10.1056/NEJMra1110265 - DOI - PubMed

Publication types

MeSH terms