. 2019 Jun 22:8:e43924.
doi: 10.7554/eLife.43924.

optoPAD, a closed-loop optogenetics system to study the circuit basis of feeding behaviors

Affiliations

optoPAD, a closed-loop optogenetics system to study the circuit basis of feeding behaviors

José-Maria Moreira et al. Elife. .

Abstract

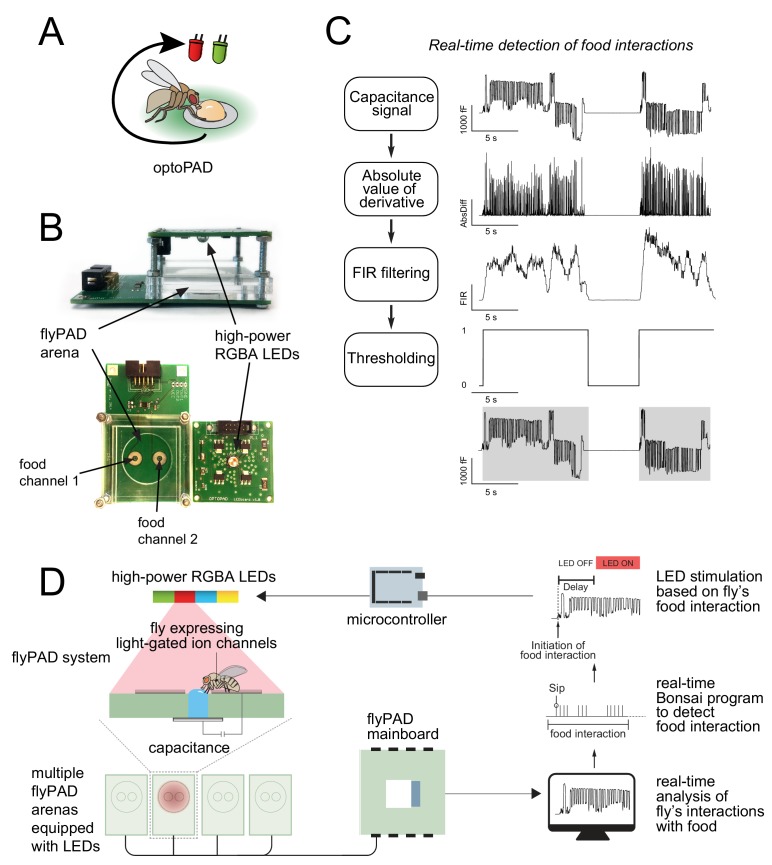
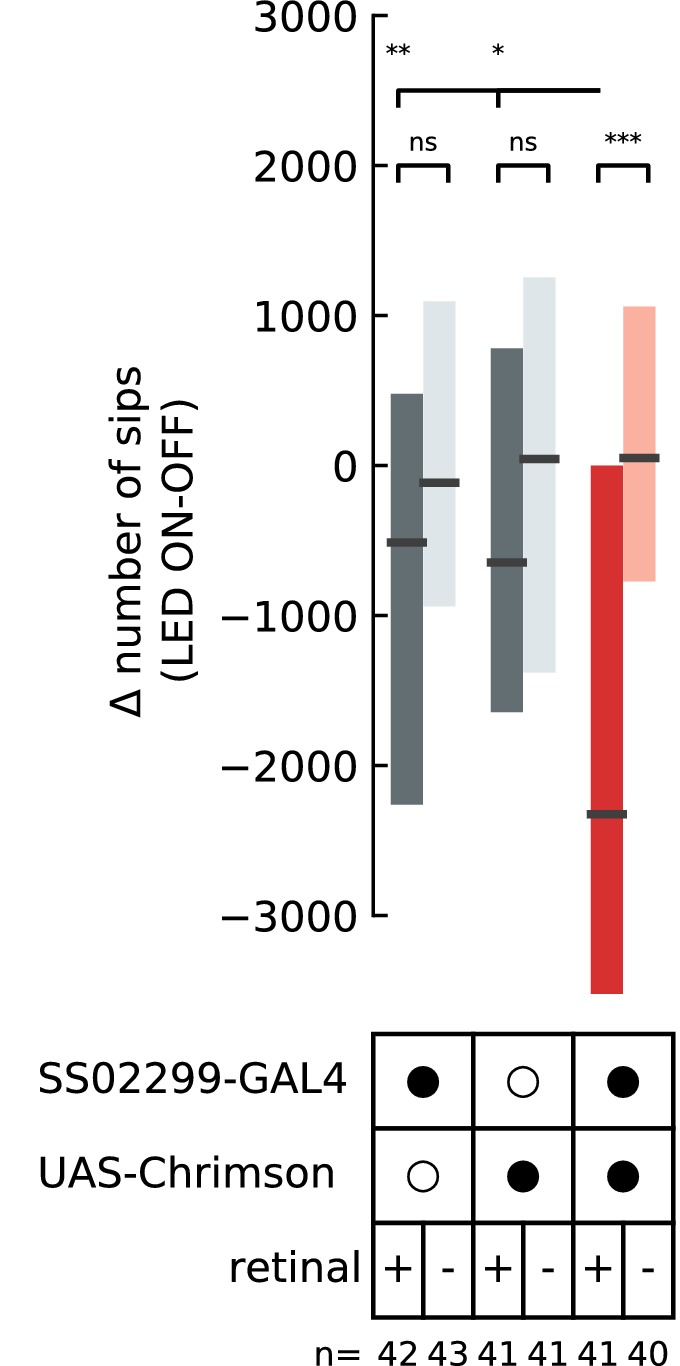
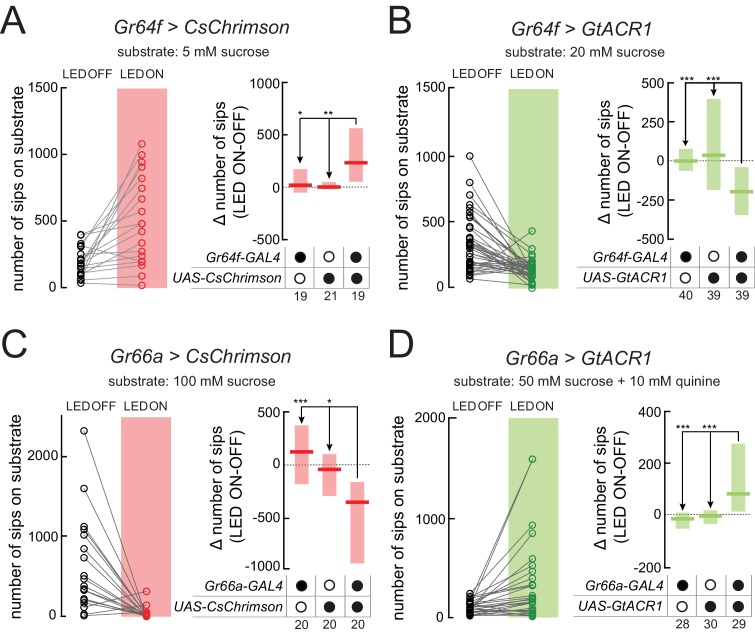
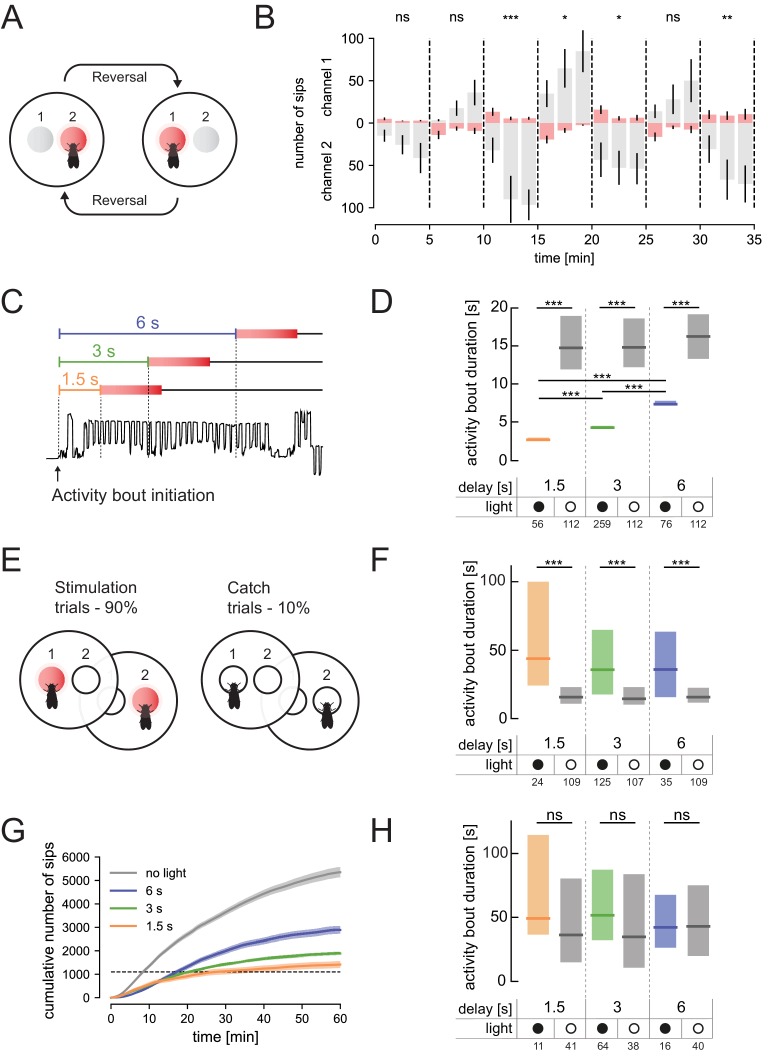
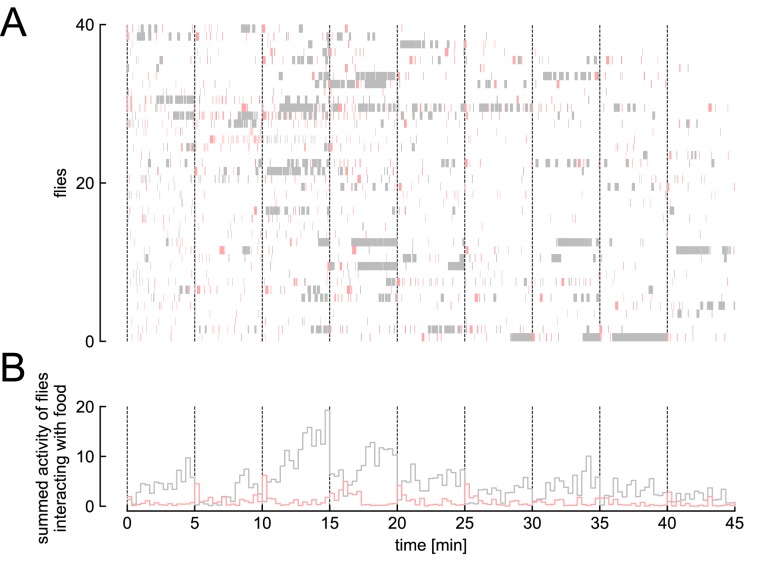
The regulation of feeding plays a key role in determining the fitness of animals through its impact on nutrition. Elucidating the circuit basis of feeding and related behaviors is an important goal in neuroscience. We recently used a system for closed-loop optogenetic manipulation of neurons contingent on the feeding behavior of Drosophila to dissect the impact of a specific subset of taste neurons on yeast feeding. Here, we describe the development and validation of this system, which we term the optoPAD. We use the optoPAD to induce appetitive and aversive effects on feeding by activating or inhibiting gustatory neurons in closed-loop - effectively creating virtual taste realities. The use of optogenetics allowed us to vary the dynamics and probability of stimulation in single flies and assess the impact on feeding behavior quantitatively and with high throughput. These data demonstrate that the optoPAD is a powerful tool to dissect the circuit basis of feeding behavior, allowing the efficient implementation of sophisticated behavioral paradigms to study the mechanistic basis of animals' adaptation to dynamic environments.

Keywords: D. melanogaster; behavior; feeding; methods; neuroscience; optogenetics; taste.


Conflict of interest statement

JM, DG, CB, KS, IT, SW, CR No competing interests declared, PI has a commercial interest in the flyPAD open-source technology.

Figures

Figure 1.
Figure 1.. The optoPAD system.
(A) Concept for the use of closed-loop capacitance measurement of feeding with optogenetic manipulation of neurons in behaving flies. The interaction of the fly with the food source triggers the activation of the LED. (B) Overview of the components of the optoPAD, the flyPAD arena and the high-power RGBA LEDs. (C) Algorithm for real-time detection of food interactions. Extracted food interaction bouts (activity bouts) are shaded in gray. (D) Schematic overview of the optoPAD experimental dataflow.
Figure 1—figure supplement 1.
Figure 1—figure supplement 1.. Quantification of the probability of the occurrence of a feeding burst onset depending on the time after activity bout onset.
Bins are 0.1 s wide and probabilities are plotted for two different genetic background controls feeding on yeast, on an optoPAD channel triggering light activation.
Figure 2.
Figure 2.. Increasing light intensity affects the feeding behavior of flies expressing different optogenetic effectors.
(A) Irradiance of all four LEDs increases linearly with increasing voltage (for red and amber above 2 V, for green and blue above 2.5 V). The average value of the three measurements is shown and error bars indicate standard error of mean. (B) Difference in total number of sips on the stimulated (ON) and unstimulated (OFF) food patches of the same arena for 24 hr starved male flies expressing CsChrimson under the control of Gr5a-GAL4, and corresponding genetic controls. Both food sources contained 5 mM sucrose solution in 1% agarose. (C) Difference in total number of sips on the stimulated (ON) and unstimulated (OFF) food patches of the same arena for 3 days yeast-deprived, mated female flies expressing GtACR1 under the control of 57 F03-GAL4, which labels taste peg GRNs, and corresponding genetic control. For genotypes, see Materials and methods and key resources table. Both food sources contained 10% yeast solution in 1% agarose. The numbers below the graphs indicate the number of flies tested in each condition. ***p<0.001, **p<0.01, *p<0.05, ns non-significance. Boxes represent median with upper/lower quartiles; groups compared by Wilcoxon rank-sum test, followed by Bonferroni multiple comparison test when more than two groups were compared.
Figure 2—figure supplement 1.
Figure 2—figure supplement 1.. Mean number of sips per feeding bursts during open-loop stimulation (1 s ON, 2 s OFF) measured on both food patches of the same arena for 3 days yeast-deprived, mated female flies expressing GtACR1 under the control of 57 F03-GAL4 or 67E03-GAL4, which both label taste peg GRNs, and corresponding genetic control (Steck et al., 2018).
Both food sources contained 10% yeast solution in 1% agarose. The numbers below the graphs indicate the number of flies tested in each condition. ****p<0.0001. Boxes represent median with upper/lower quartiles; groups compared by Wilcoxon rank-sum test, followed by Bonferroni multiple comparison test for two comparisons.
Figure 2—figure supplement 2.
Figure 2—figure supplement 2.. Difference in total number of sips on the stimulated (ON) and unstimulated (OFF) food patches of the same arena for 3 days yeast-deprived, mated female flies expressing CsChrimson under the control of SS02299-GAL4, and corresponding genetic controls.
All genotypes have been supplemented either with (+) or without (-) 5 ml of 400 mM all-trans retinal for 6 days. Both food sources contained 10% yeast solution in 1% agarose. The numbers below the graphs indicate the number of flies tested in each condition. ***p<0.001, **p<0.01, *p<0.05, ns non-significance. Boxes represent median with upper/lower quartiles; groups compared by Wilcoxon rank-sum test, followed by Bonferroni multiple comparison test when more than two groups were compared.
Figure 3.
Figure 3.. Creating virtual taste realities for Drosophila using the optoPAD.
(A–D) Total number of sips from the unstimulated (LED OFF) and the light-stimulated (LED ON) food patches of the same arena by flies expressing CsChrimson (A and C) or GtACR1 (B and D), under the control of Gr64f-GAL4 (A and B) or Gr66a-GAL4 (C and D) (left side of the panels). Difference in total number of sips on the stimulated (ON) and unstimulated (OFF) food patches for flies expressing CsChrimson or GtACR1 (A and C), under the control of Gr64f-GAL4 (A and B) or Gr66a-GAL4 (C and D), and corresponding genetic controls (right side of the panels). All flies were 24 hr starved male flies (for genotypes, see Materials and methods and key resources table). The food substrate is indicated in each panel. The numbers below the graphs indicate the number of flies tested in each condition. ***p<0.001, **p<0.01, *p<0.05. Boxes represent median with upper/lower quartiles; groups compared by Kruskal-Wallis test, followed by Dunn’s multiple comparison test.
Figure 4.
Figure 4.. The optoPAD allows for complex dynamic closed-loop experimental designs.
In all experiments, 5–7 days old female Gr66a-GAL4 > CsChrimson flies were used. (A) Schematic overview of the dynamic virtual taste reality experiment: every five minutes the contingency of the experiment is reversed (in each experimental block the fly’s interaction with a different channel triggered light stimulation). (B) Number of sips from channel 1 (upper half of the plot) and channel 2 (lower half of the plot) across time in the changing virtual taste reality setting described in A. Columns and lines represent mean and the standard error of the mean, respectively. The trials leading to LED activation are shaded in red. (C) Onset of light stimulation (red box) can be freely set to occur at different times after the initiation of an interaction with food (delay of 1.5, 3 and 6 s). The lower part of the diagram represents a representative capacitance trace with the onset of food contact marked with an arrow. (D) Duration of activity bouts in flies exposed to light after different delays relative to the initiation of food interactions and corresponding controls (experimental design described in C). Plotted are the duration of activity bouts for the stimulated flies (light) and for the same number of trials that were longer than 1.5, 3 and 6 s (from left to right) performed by the ‘no light’ control flies. (E) Schematic of the experimental design in which light activation was set to happen in a probabilistic manner. (F) Duration of activity bouts of the catch trials. Plotted are the duration of activity bouts for the stimulated flies (light) and for a selection of 10% of all the trials that were longer than 1.5, 3 and 6 s (from left to right) performed by the ‘no light’ control flies. (G) Cumulative feeding for the four different groups of the experiment described in (E). Line represents the mean and the shading the standard error of the mean. Dotted line indicates the 1100 sips threshold used to calibrate the data for the internal state of the animal. (H) Duration of activity bouts of the catch-trials for sip-calibrated flies (trials performed until the flies had reached a total of 1100 sips). Plotted are the duration of activity bouts for the stimulated flies (light) and for a selection of 10% of all the trials that were longer than 1.5, 3 and 6 s (from left to right) performed by the ‘no light’ control flies. For genotypes, see Materials and methods and key resources table. ***p<0.001, **p<0.01, *p<0.05, ns non-significance. The numbers below the graphs in D, F and H indicate the number of flies tested in each condition. In D, F, and H, boxes represent median with upper/lower quartiles. In D, F and H, groups were compared by Kruskal-Wallis test, followed by Dunn’s multiple comparison test. In B, the total number of sips for all bins in each channel during each period of 5 min was compared by Wilcoxon rank-sum test.
Figure 4—figure supplement 1.
Figure 4—figure supplement 1.. Activity bouts of individual flies in a dynamic experimental protocol experiment.
(A) Raster plot of the data shown in Figure 4B. Every line corresponds to a single fly undergoing the dynamic experimental protocol. Gray marks activity bouts with the food source not triggering light stimulation and red marks activity bouts triggering light activation and hence likely activation of bitter neurons. Dashed lines symbolize the time point at which the channel triggering light activation was changed. (B) Summed time flies are interacting with the food in a 20 s wide bin for non-light triggering channel (gray) and light triggering channel (red). Data in the bin are normalized by the total number of flies in the assay.

References

    1. Anderson DJ, Perona P. Toward a science of computational ethology. Neuron. 2014;84:18–31. doi: 10.1016/j.neuron.2014.09.005. - DOI - PubMed
    1. Branson K, Robie AA, Bender J, Perona P, Dickinson MH. High-throughput ethomics in large groups of Drosophila. Nature Methods. 2009;6:451–457. doi: 10.1038/nmeth.1328. - DOI - PMC - PubMed
    1. Brown AEX, de Bivort B. Ethology as a physical science. Nature Physics. 2018;14:653–657. doi: 10.1038/s41567-018-0093-0. - DOI
    1. Calhoun AJ, Murthy M. Quantifying behavior to solve sensorimotor transformations: advances from worms and flies. Current Opinion in Neurobiology. 2017;46:90–98. doi: 10.1016/j.conb.2017.08.006. - DOI - PMC - PubMed
    1. Carvalho-Santos Z, Ribeiro C. Gonadal ecdysone titers are modulated by protein availability but do not impact protein appetite. Journal of Insect Physiology. 2018;106:30–35. doi: 10.1016/j.jinsphys.2017.08.006. - DOI - PubMed

Publication types

LinkOut - more resources