. 2019 Sep 15;25(18):5686-5701.
doi: 10.1158/1078-0432.CCR-18-3382. Epub 2019 Jun 21.

HDAC Inhibition Enhances the In Vivo Efficacy of MEK Inhibitor Therapy in Uveal Melanoma

Affiliations

HDAC Inhibition Enhances the In Vivo Efficacy of MEK Inhibitor Therapy in Uveal Melanoma

Fernanda Faião-Flores et al. Clin Cancer Res. .

Abstract

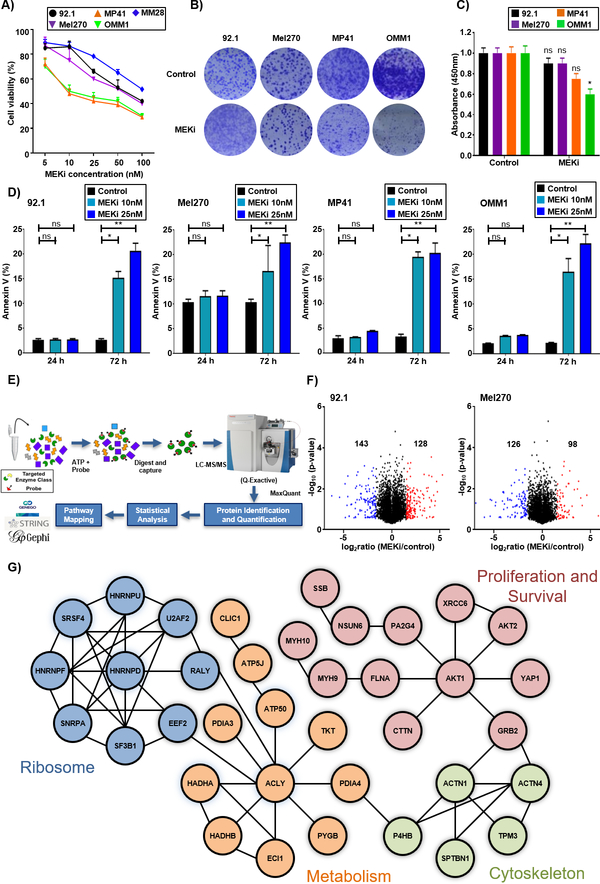
Purpose: The clinical use of MEK inhibitors in uveal melanoma is limited by the rapid acquisition of resistance. This study has used multiomics approaches and drug screens to identify the pan-HDAC inhibitor panobinostat as an effective strategy to limit MEK inhibitor resistance.Experimental Design: Mass spectrometry-based proteomics and RNA-Seq were used to identify the signaling pathways involved in the escape of uveal melanoma cells from MEK inhibitor therapy. Mechanistic studies were performed to evaluate the escape pathways identified, and the efficacy of the MEK-HDAC inhibitor combination was demonstrated in multiple in vivo models of uveal melanoma.

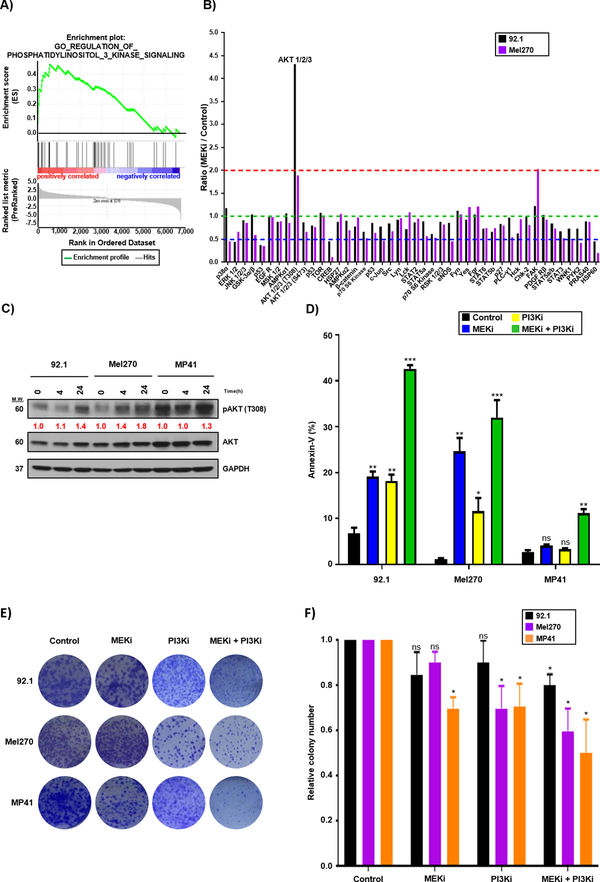
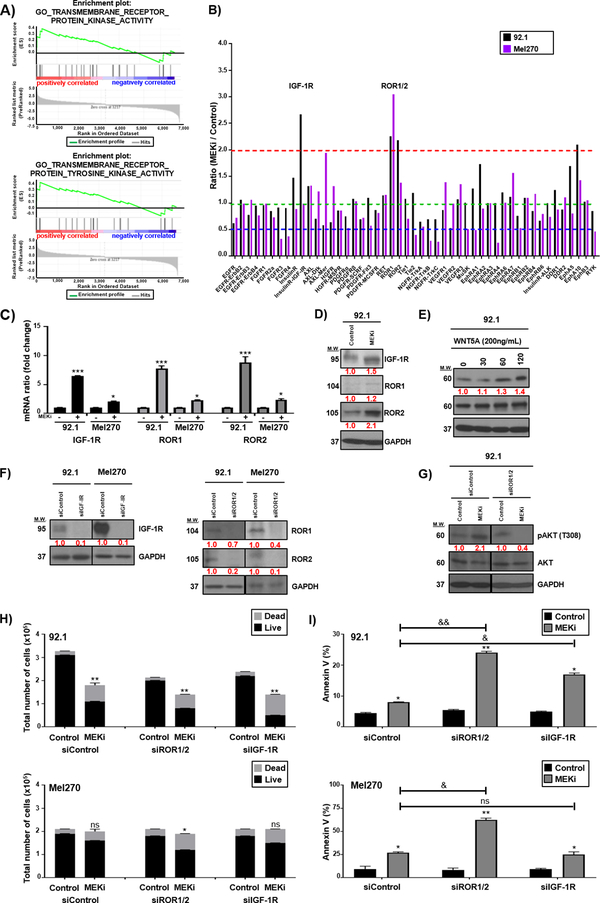
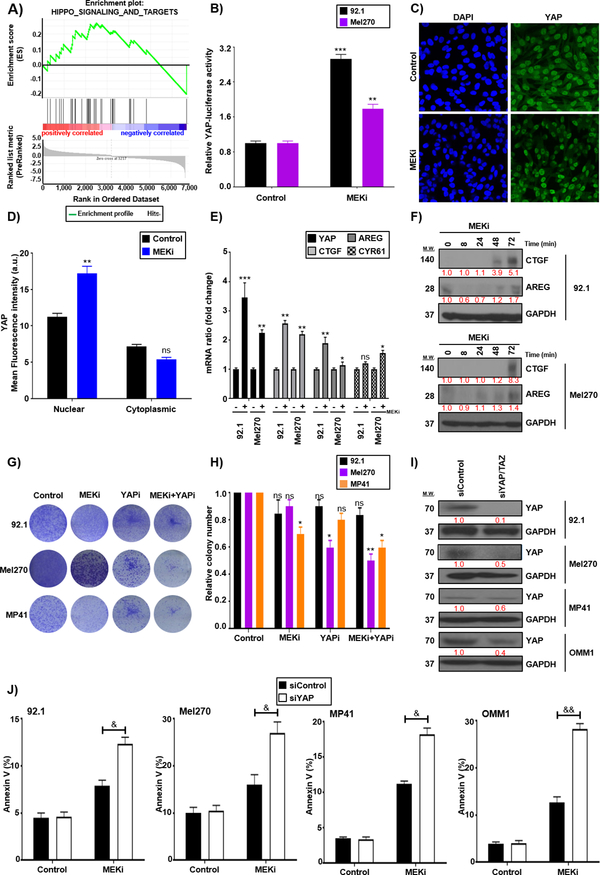
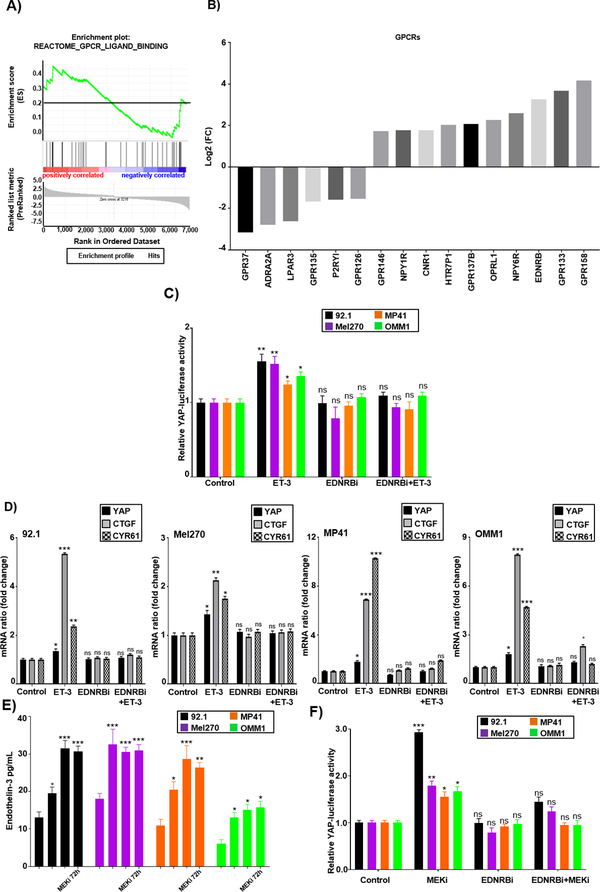
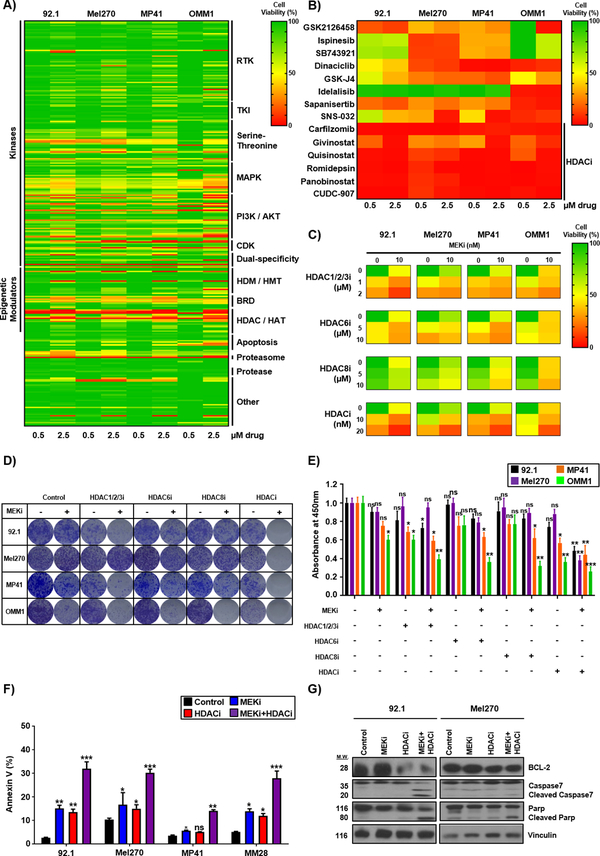
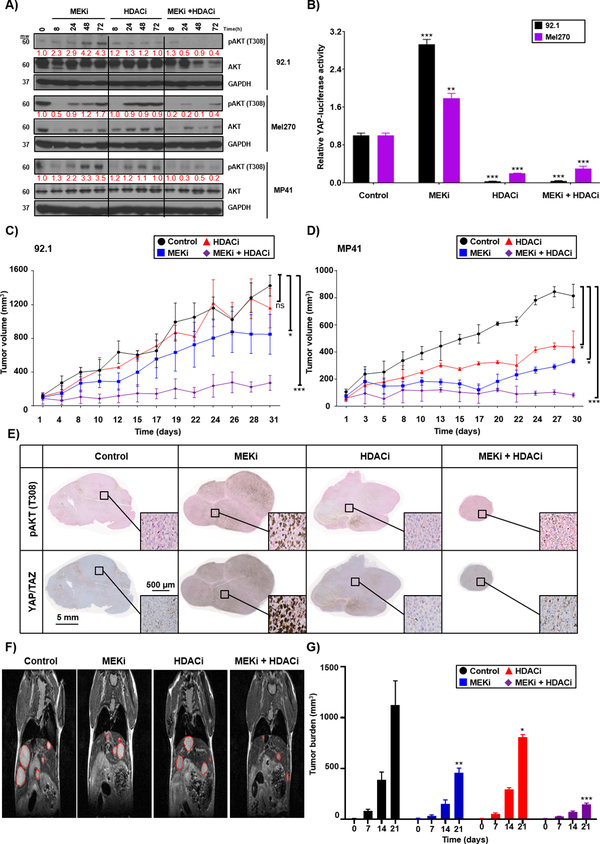
Results: We identified a number of putative escape pathways that were upregulated following MEK inhibition, including the PI3K/AKT pathway, ROR1/2, and IGF-1R signaling. MEK inhibition was also associated with increased GPCR expression, particularly the endothelin B receptor, and this contributed to therapeutic escape through ET-3-mediated YAP signaling. A screen of 289 clinical grade compounds identified HDAC inhibitors as potential candidates that suppressed the adaptive YAP and AKT signaling that followed MEK inhibition. In vivo, the MEK-HDAC inhibitor combination outperformed either agent alone, leading to a long-term decrease of tumor growth in both subcutaneous and liver metastasis models and the suppression of adaptive PI3K/AKT and YAP signaling.

Conclusions: Together, our studies have identified GPCR-mediated YAP activation and RTK-driven AKT signaling as key pathways involved in the escape of uveal melanoma cells from MEK inhibition. We further demonstrate that HDAC inhibition is a promising combination partner for MEK inhibitors in advanced uveal melanoma.


Conflict of interest statement

Conflict of interest: Dr. Harbour is a paid consultant for Castle Biosciences, licensee of intellectual property related to uveal melanoma, and he receives royalties from its commercialization. All other authors declare no conflict of interest

Figures

Figure 1:
Figure 1:. MEK inhibition rewires the signaling network of uveal melanoma cells.
A) A) MTT assay showing the anti-proliferative activity of MEKi (trametinib) against five uveal melanoma cell lines (92.1, MP41, Mel270, MM28 and OMM1). B) MEKi does not suppress uveal melanoma cell growth in long-term colony formation assays. Cells were treated with 1nM of MEKi for 4 weeks and colonies visualized using Crystal Violet. C) Quantification of experiment from B). D) MEKi is associated with limited apoptosis in uveal melanoma cells. Cells were treated with MEKi (trametinib, 10–25nM, 24, 72 h) and apoptosis measured by Annexin-V binding and flow cytometry. E) An overview of the ABPP method to comprehensively map adaptive signaling following MEK inhibition F) 92.1 and Mel270 uveal melanoma cells were treated with MEKi (trametinib 25nM, 24h) and analyzed by ABPP. Volcano plot shows the decrease in protein expression (blue) and the increase in protein expression (red) after the treatment. G) STRING analysis highlights the key cellular processes and proteins showing increased ATP uptake following MEKi treatment.
Figure 2:
Figure 2:. AKT is a major escape pathway following MEK inhibition.
A) GSEA analysis of RNA-Seq experiments of MEKi-treated uveal melanoma cells shows an enrichment for PI3K/AKT signaling. B) MEK inhibition increases T308 AKT phosphorylation in kinome arrays. 92.1 and Mel270 cell were treated with MEKi (trametinib 10nM, 48 hr) and were subjected to kinome array analysis. Bar graph shows densitometry from scanned array. C) MEKi increases AKT signaling in uveal melanoma cells. 92.1, Mel270 and MP41 cells were treated with trametinib (0–24 hr, 10nM) before being subject to Western Blot for phospho-AKT, total AKT and GAPDH. Numbers indicate the fold protein increase relative to control, normalized to the loading control. D) Combined treatment with MEKi (trametinib, 10nM) and a PI3Ki (pictlisib, 3μM) leads to enhanced apoptosis. Cells were treated with vehicle, MEKi alone, PI3Ki alone or the combination for 72h. Apoptosis was measured by Annexin-V binding and flow cytometry. E) Combined MEK-PI3Ki treatment partly limits therapeutic escape in colony formation assays. 92.1, Mel270 and MP41 cells were treated with vehicle, MEKi alone (1nM), PI3Ki alone (300nM) or the combination for 4 weeks before being stained with Crystal Violet. F) Quantification of the experiment from E).
Figure 3:
Figure 3:. IGF1R and ROR1/2 activate AKT escape signaling following MEK inhibition.
A) GSEA analysis of RNA-Seq experiments of MEKi-treated uveal melanoma cells shows an enrichment for receptor protein kinase activity and receptor tyrosine kinases. B) MEKi increases ROR1/2 and IGF-1R signaling activity. 92.1 and Mel270 uveal melanoma cells were treated with MEKi (10nM, 48 h) before being analyzed by RTK array. MEK inhibition (10nM, 72 h) increases IGF-1R, ROR1 and ROR2 C) mRNA expression by RT-PCR and D) protein expression in 92.1 and Mel270 cells. E) WNT5A activates AKT signaling in 92.1 cells. Cell cultures were treated with WNT5A (200ng/mL, 0–120 min) and probed for pAKT expression. Numbers indicate the fold protein increase relative to time 0, normalized to the loading control. F) Validation of ROR1/2 and IGF-1R knockdown by Western Blot. G) ROR1/2 knockdown prevents MEKi-mediated AKT signaling. ROR1/2 was silenced by siRNA and cells treated with MEKi. pAKT was measured by Western Blot H) Knockdown of ROR1/2 or IGF-1R sensitizes uveal melanoma cells to MEKi-induced cell death. Data show total number of 92.1 and Mel270 cells by Trypan Blue exclusion. I) Silencing of ROR1/2 enhances MEKi-induced apoptosis in 92.1 and Mel270 cells. Following siRNA knockdown cells were treated with MEKi (10nM, 72h) and apoptosis was measured by Annexin-V binding and flow cytometry. Values are expressed as mean ±s.d. Significance is indicated by *p<0.05, **p<0.01 and ***p<0.001 when comparing Control vs MEKi group and is indicated by &p<0.05 and &&p<0.01 when comparing shControl treated with MEKi with shIGFR-1R or sh ROR1/2 treated with MEKi.
Figure 4:
Figure 4:. Activation of YAP signaling following MEK inhibition.
A) GSEA analysis of RNA-Seq experiments of MEKi-treated uveal melanoma cells shows an enrichment for Hippo pathway activity. B) MEKi (trametinib 10nM, 48 hr) induces YAP activity in 92.1 and Mel270 cells in a reporter assay and C) enhances YAP nuclear accumulation in 92.1 cells. D) The nuclear and cytoplasmic fluorescence intensity of YAP was analyzed using the Definiens Tissue Studio software suite. E) MEKi increases expression of YAP target genes. Data shows q-RT-PCR for 92.1 and Mel270 cells following treatment with MEKi (10nM, 48 h) for YAP, AREG, CTGF and CYR61. F) MEKi increases expression of CTGF and AREG in uveal melanoma cells by Western Blot. G) YAP inhibition limits MEKi-mediated therapeutic escape. Images show a colony formation assay following treatment with MEKi (1nM), YAPi (Verteporfin, 100nM) or the combination of both for 4 weeks. H) Quantification of experiment from G). I) Western Blot showing YAP silencing. J) Silencing of YAP enhances MEKi-mediated apoptosis. Cells were treated with MEKi (10nM) for 72h and apoptosis quantified by Annexin-V binding and flow cytometry. Analysis was performed with one-way analysis of variance (ANOVA) followed by Tukey–Kramer post hoc analysis. Values are expressed as mean ± s.d. Significance is indicated by *p<0.05, **p<0.01 and ***p<0.001. For the siRNA experiments significance is indicated by &p<0.05 and &&p<0.01.
Figure 5:
Figure 5:. Adaptive YAP signaling results from MEKi-mediated release of ET-3.
A) GSEA analysis of RNA-Seq experiments of MEKi-treated uveal melanoma cells shows an enrichment for GPCR activity. B) Graph showing the Log2 fold change in expression of individual GPCRs following MEKi treatment. C) Endothelin-3 (ET-3) activates YAP reporter activity in 4 uveal melanoma cell lines. Cells were treated with either ET-3 (100nM, 1 hr), EDNRB antagonist (bosentan, pre-treatment with 80μM, 1h) or ET-3 + bosentan (100nM and 80μM, respectively). D) ET-3 increases expression of YAP target mRNAs in 92.1, Mel270, MP41 and OMM1 cells. Data shows q-RT-PCR analysis of YAP, CTGF and CYR61. E) MEKi leads to ET-3 release from uveal melanoma cells. Cells were treated with MEKi (10nM 0–72 h) and the supernatant analyzed by ELISA. F) The EDNRB antagonist bosentan blocks MEKi-mediated YAP activation. Uveal melanoma cells were treated with vehicle, MEKi (10nM, 48h), EDRNBi (bosentan, pre-treatment with 80μM, 1h) and the combination for 48 h before being subjected to the YAP reporter assay. Analysis was performed with one-way analysis of variance (ANOVA) followed by Tukey–Kramer post hoc analysis. Values are expressed as mean ± s.d. Significance is indicated by *p<0.05, **p<0.01 and ***p<0.001.
Figure 6:
Figure 6:. Identification of HDAC inhibitors as a strategy to limit escape from MEK inhibition.
A) Response of individual uveal melanoma cell lines to each drug in the panel of 289 compounds. Scale indicates the percentage growth inhibition at 0.5 and 2.5μM of drug relative to vehicle. B) Detailed view of the responses of the drugs selected for follow-up in the cell line panel. Data shows the inhibition of growth per cell line at 0.5 and 2.5μM of drug relative to vehicle. C) HDACi increase the cytotoxic effects of MEKi. Data show heatmaps showing the inhibition of the growth of uveal melanoma cell lines (92.1, MP41, Mel270 and OMM1) treated with MEKi (trametinib, 10nM) alone and in combination with inhibitors of HDAC1/2/3 (etinostat), HDAC6 (tubastatin), HDAC8 (PCI-03451) and pan-HDAC (panobinostat) for 72 hr before being subjected to the MTT assay. D) HDACi prevents escape from MEK inhibitor therapy. 92.1, Mel270, MP41 and OMM1 cells were treated with vehicle, MEKi alone, HDACi alone or the combination for 4 weeks before being stained with Crystal Violet. E) Quantification of data from D). F) The MEK-HDACi combination shows increased apoptosis compared to either drug alone. 92.1, Mel270, MP41, MM28 cells were treated with MEKi (trametinib, 10nM), HDACi (panobinostat, 10nM) or combination of both for 72h and apoptosis was measured by Annexin-V binding and flow cytometry. G) The MEK-HDACi combination is associated with decreased BCL-2 and increased expression of cleaved caspase-7 and PARP by Western Blot. Cells were treated with with MEKi (trametinib, 10nM), HDACi (panobinostat, 10nM) or combination of both for 48h.
Figure 7:
Figure 7:. The MEK-HDAC inhibitor is effective against subcutaneous xenograft and liver metastasis models of uveal melanoma through combined YAP and AKT inhibition.
A) The MEKi-HDACi combination inhibits adaptive AKT signaling in uveal melanoma cells. Cells were treated with vehicle, MEKi (trametinib, 10nM), HDACi (panobinostat, 10nM) or a combination of the two for 0–72 and probed for phospho-AKT, AKT and GAPDH expression. B) HDAC inhibition limits MEKi-induced YAP activity. Data shows YAP activity in uveal melanoma cells following treatment with vehicle, MEKi, HDACi or a combination of the two drugs. After the formation of palpable tumors, mice were treated with vehicle (Control group), MEKi (Trametinib, 1mg/kg po daily), HDACi (Panobinostat, 20mg/kg, IP, 3X week) or the combination for 31 days. Data shows tumor volume.C) The MEK-HDACi combination delivers durable responses in the 92.1 uveal melanoma subcutaneous xenograft model. D) The MEK-HDACi combination delivers durable responses in the MP41 uveal melanoma subcutaneous xenograft model. Data show the mean ± SD. E) The combination of MEKi and HDACi suppresses pAKT and YAP/TAZ in uveal melanoma xenografts. Representative images of pAKT and YAP/TAZ expression by IHC. Magnification x100 in all images. Scale bar= 5mm for the whole images and scale bar= 500μm for inserts on the right side. Brown staining indicates positivity for either YAP/TAZ or pAKT. F) The combination of MEKi and HDACi suppresses growth of uveal melanoma liver metastases. Panel shows representative MRI images of representative mice at day 21 of treatment. The red circles indicate individual liver metastases. G) Mean liver metastasis volumes following 0–21 days of treatment with vehicle, MEKi, HDACi and the drug combination. Analysis was performed with one-way analysis of variance (ANOVA) followed by Tukey–Kramer post hoc analysis. Values are expressed as mean ±s.d. Significance is indicated by *p<0.05, **p<0.01 and ***p<0.001.

Similar articles

Cited by

References

    1. Landreville S, Agapova OA, Harbour JW. Emerging insights into the molecular pathogenesis of uveal melanoma. Future oncology (London, England). 2008;4:629–36. - PMC - PubMed
    1. Van Raamsdonk CD, Bezrookove V, Green G, Bauer J, Gaugler L, O’brien JM, et al. Frequent somatic mutations of GNAQ in uveal melanoma and blue naevi. Nature. 2009;457:599. - PMC - PubMed
    1. Van Raamsdonk CD, Griewank KG, Crosby MB, Garrido MC, Vemula S, Wiesner T, et al. Mutations in GNA11 in uveal melanoma. New England Journal of Medicine. 2010;363:2191–9. - PMC - PubMed
    1. Goldsmith Z, Dhanasekaran D. G protein regulation of MAPK networks. Oncogene. 2007;26:3122. - PubMed
    1. Chen X, Wu Q, Tan L, Porter D, Jager MJ, Emery C, et al. Combined PKC and MEK inhibition in uveal melanoma with GNAQ and GNA11 mutations. Oncogene. 2014;33:4724. - PMC - PubMed

Publication types

MeSH terms