

Microbial Dynamics of Biosand Filters and Contributions of the Microbial Food Web to Effective Treatment of Wastewater-Impacted Water Sources
- PMID: 31227556
- PMCID: PMC6696957
- DOI: 10.1128/AEM.01142-19
Microbial Dynamics of Biosand Filters and Contributions of the Microbial Food Web to Effective Treatment of Wastewater-Impacted Water Sources
Abstract
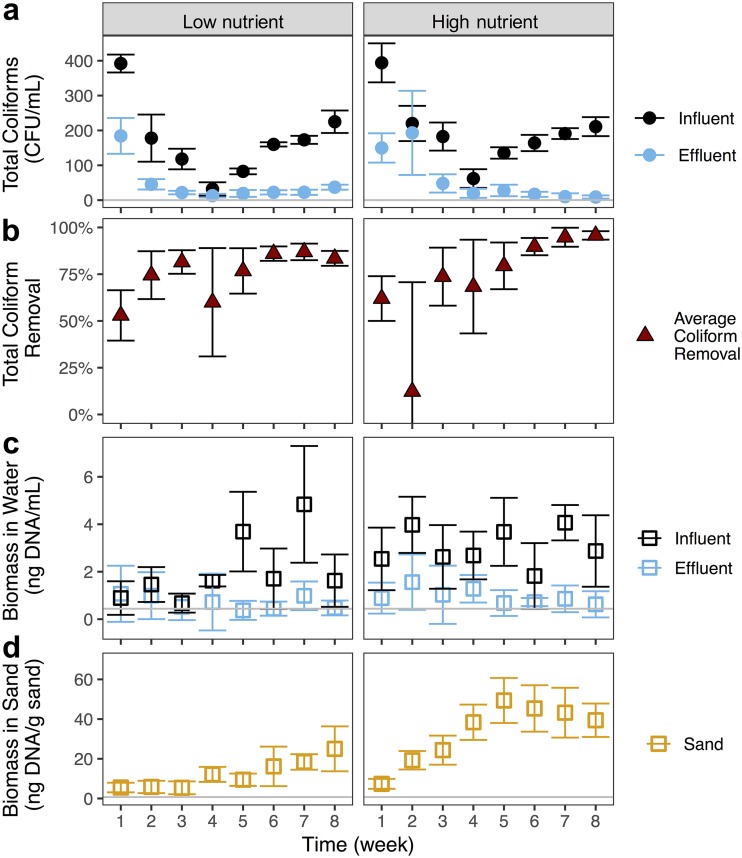
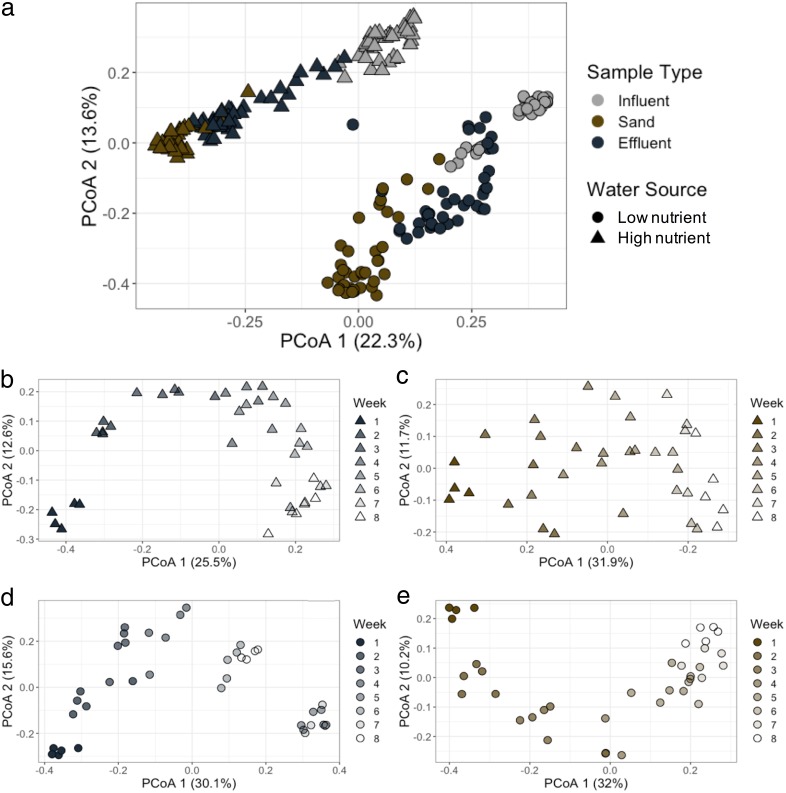
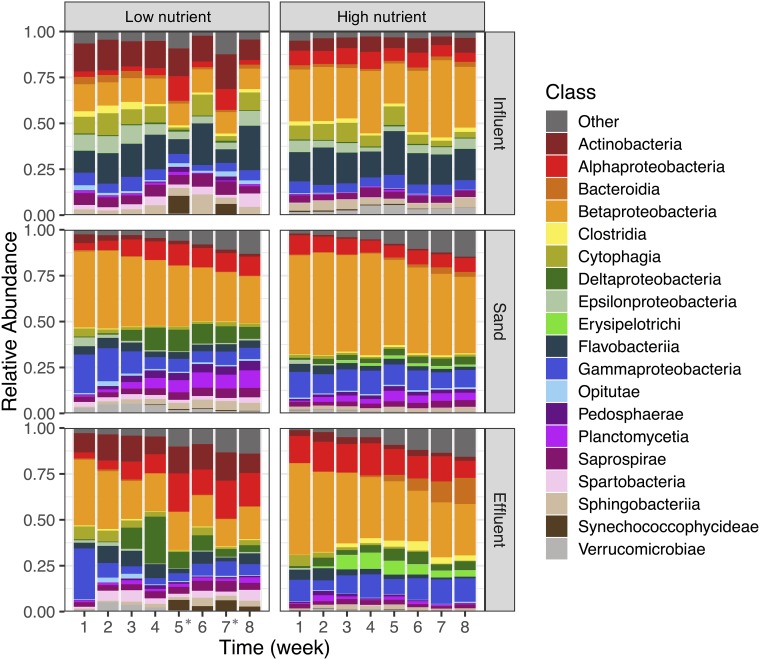
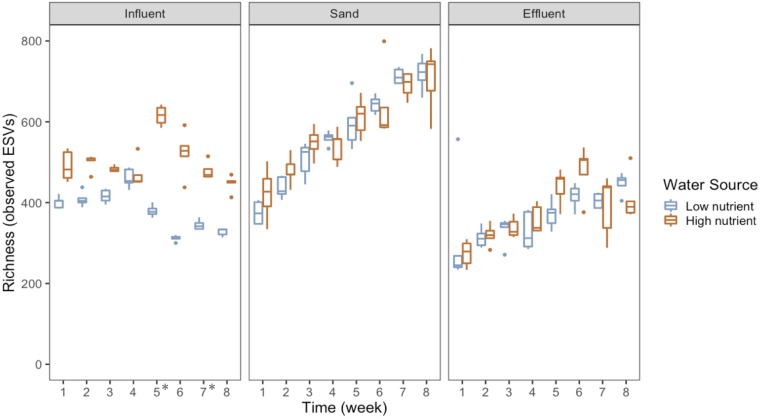
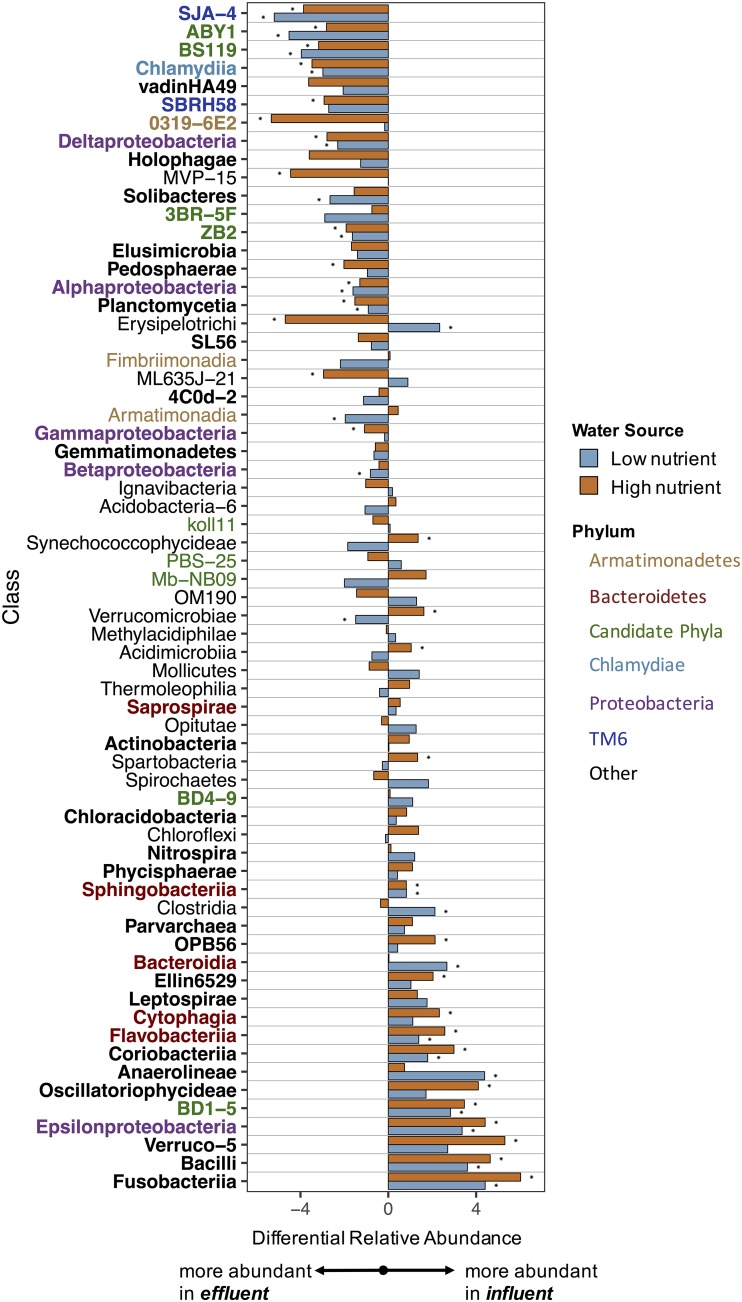
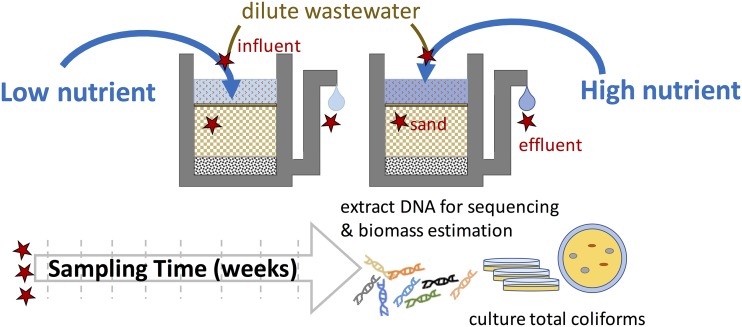
Biosand filtration systems are widely used for drinking water treatment, from household-level, intermittently operated filters to large-scale continuous municipal systems. While it is well-established that microbial activity within the filter is essential for the removal of potential pathogens and other contaminants, the microbial ecology of these systems and how microbial succession relates to their performance remain poorly resolved. We determined how different source waters influence the composition, temporal dynamics, and performance of microbial communities in intermittently operated biosand filters. We operated lab-scale biosand filters, adding daily inputs from two contrasting water sources with differing nutrient concentrations and found that total coliform removal increased and became less variable after 4 weeks, regardless of water source. Total effluent biomass was also lower than total influent biomass for both water sources. Bacterial community composition, assessed via cultivation-independent DNA sequencing, varied by water source, sample type (influent, effluent, or sand), and time. Despite these differences, we identified specific taxa that were consistently removed, including common aquatic and wastewater bacteria. In contrast, taxa consistently more abundant in the sand and effluent included predatory, intracellular, and symbiotic bacteria.IMPORTANCE Although microbial activities are known to contribute to the effectiveness of biosand filtration for drinking water treatment, we have a limited understanding of what microbial groups are most effectively removed, colonize the sand, or make it through the filter. This study tracked the microbial communities in the influent, sand, and effluent of lab-scale, intermittently operated biosand filters over 8 weeks. These results represent the most detailed and time-resolved investigation of the microbial communities in biosand filters typical of those implemented at the household level in many developing countries. We show the importance of the microbial food web in biosand filtration, and we identified taxa that are preferentially removed from wastewater-impacted water sources. We found consistent patterns in filter effectiveness from source waters with differing nutrient loads and, likewise, identified specific bacterial taxa that were consistently more abundant in effluent waters, taxa that are important targets for further study and posttreatment.
Keywords: biosand filtration; drinking water; microbial ecology.
Copyright © 2019 American Society for Microbiology.
Figures
References
-
- Ngai T, Coff B, Baker D, Lentz R. 2014. Global review of the adoption, use and performance of the biosand filter, p 309–317. In Progress in slow sand and alternative biofiltration processes. International Water Association, London, UK.
-
- Haig SJ, Collins G, Davies RL, Dorea CC, Quince C. 2011. Biological aspects of slow sand filtration: past, present and future. Water Supply 11:468–472. doi:10.2166/ws.2011.076. - DOI
-
- Weber-Shirk ML, Dick RI. 1997. Biological mechanisms in slow sand filters. J Am Water Works Assoc 89:72. doi:10.1002/j.1551-8833.1997.tb08180.x. - DOI
Publication types
MeSH terms
Substances
LinkOut - more resources
Full Text Sources
Miscellaneous
