

Comment
doi: 10.1136/gutjnl-2019-318977.
Epub 2019 Jun 20.
Tracing the accumulation of in vivo human oral microbiota elucidates microbial community dynamics at the gateway to the GI tract
Affiliations
- PMID: 31227588
- PMCID: PMC7306975
- DOI: 10.1136/gutjnl-2019-318977
Item in Clipboard
Comment
Tracing the accumulation of in vivo human oral microbiota elucidates microbial community dynamics at the gateway to the GI tract
Gut.
2020 Jul.
No abstract available
Keywords: bacterial translocation; gastrointestinal cancer; intestinal microbiology.
Conflict of interest statement
Competing interests: None declared.
Figures
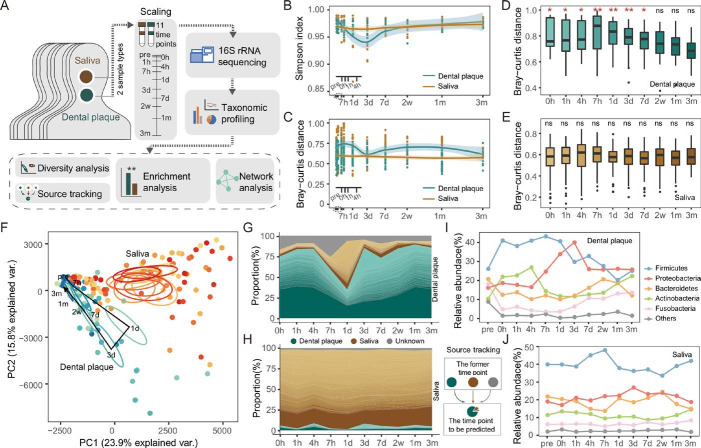
Longitudinal dynamics of in vivo human oral microbiota. (A) Overview of the study design and sample collection. (B) The alpha diversity of the dental plaque and salivary microbiota over time. The shadow around the line shows a 95% CI. (C) The Bray-Curtis distance calculated at the operational taxonomic unit (OTU) level across individual microbiota of the same time point. (D–E) The Bray-Curtis distance between microbiota of each time point and pre. Significance was measured using Wilcoxon rank-sum test (0.01>p>0.001, **; 0.05>p>0.01, *; p>0.05, ns). (F) The principal component (PC) analysis of dental plaque and saliva microbiota at each time point. The circle shows a 10% CI. (G–H) Tracing the source of OTUs in each time point. The dental plaque and saliva samples of the former time point were taken as potential sources of the latter time point. The bands of each colour indicate the top 100 most abundant OTUs. Green, brown and grey bands represent the sources of dental plaque, salivary and unknown, respectively. (I–J) The temporal changes of bacterial abundance at the phylum level.
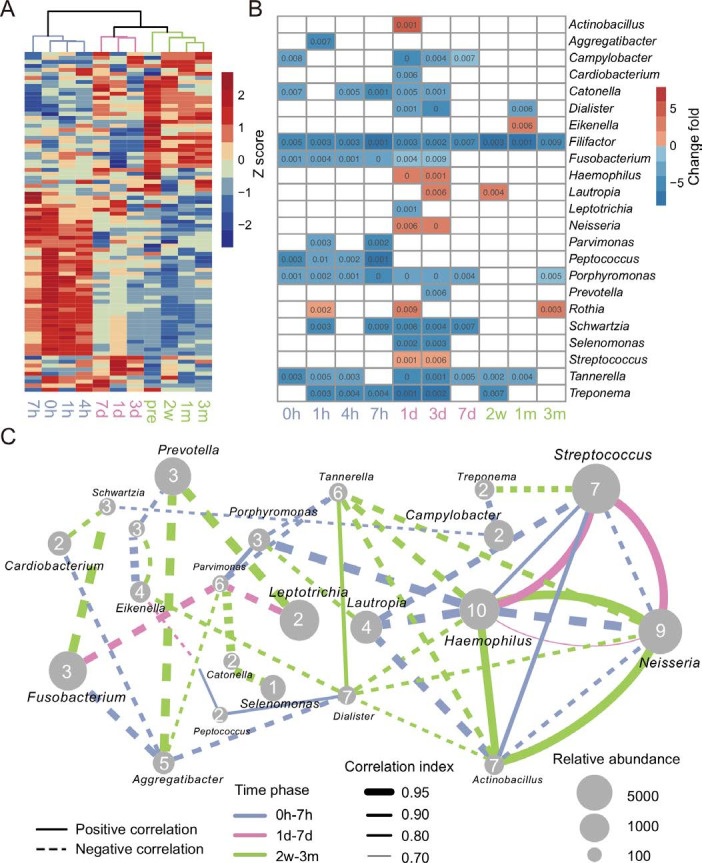
Microbial taxonomy and interaction of oral biofilms over time. (A) Clustering of the dental plaque microbiota at the genus level. (B) Significantly different genera of each time point compared with the time point pre. Wilcoxon rank-sum test with false discovery rate correction, p≤0.01. (C) Co-occurrence network of the significantly different genera. The thresholds of SparCC correlations were r≥0.7 and p≤0.05. The blue, pink and green lines represent the connection of two genera in the early phase (0 hour, 1 hour, 4 hours, 7 hours), the medium phase (1 day, 3 days, 7 days) and the late phase (2 weeks, 1 month, 3 months, pre), respectively. The dotted and solid lines indicate negative correlation and positive correlation, respectively. The thickness of the line is proportional to the value of correlation. The size of the nodes is proportional to their relative abundance, and the number marked on each node represents the degree of this node.
Comment on
-
Enrichment of oral microbiota in early cystic precursors to invasive pancreatic cancer.Gut. 2019 Dec;68(12):2186-2194. doi: 10.1136/gutjnl-2018-317458. Epub 2019 Mar 14. Gut. 2019. PMID: 30872392 Free PMC article.
References
Publication types
MeSH terms
LinkOut - more resources
Full Text Sources
Medical