. 2019 Nov;68(11):2019-2031.
doi: 10.1136/gutjnl-2019-318912. Epub 2019 Jun 21.

Integrated multiomic analysis reveals comprehensive tumour heterogeneity and novel immunophenotypic classification in hepatocellular carcinomas

Affiliations

Integrated multiomic analysis reveals comprehensive tumour heterogeneity and novel immunophenotypic classification in hepatocellular carcinomas

Qi Zhang et al. Gut. 2019 Nov.

Abstract

Objective: Hepatocellular carcinoma (HCC) is heterogeneous, especially in multifocal tumours, which decreases the efficacy of clinical treatments. Understanding tumour heterogeneity is critical when developing novel treatment strategies. However, a comprehensive investigation of tumour heterogeneity in HCC is lacking, and the available evidence regarding tumour heterogeneity has not led to improvements in clinical practice.

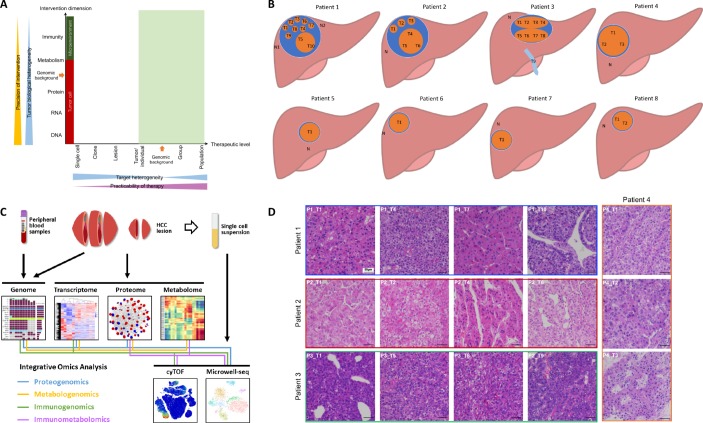
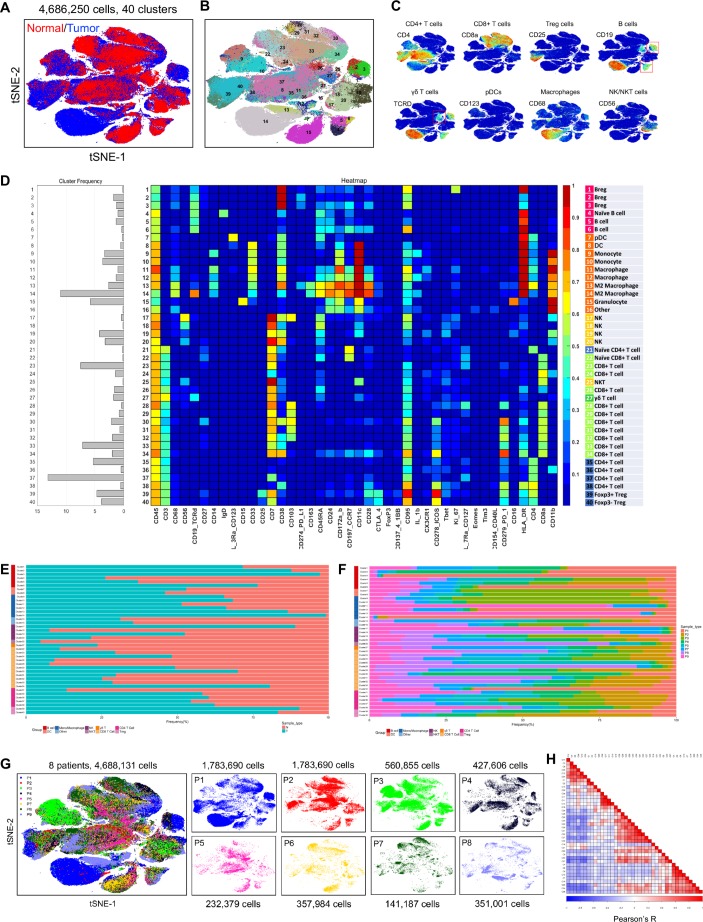
Design: We harvested 42 samples from eight HCC patients and evaluated tumour heterogeneity using whole-exome sequencing, RNA sequencing, mass spectrometry-based proteomics and metabolomics, cytometry by time-of-flight, and single-cell analysis. Immunohistochemistry and quantitative polymerase chain reactions were performed to confirm the expression levels of genes. Three independent cohorts were further used to validate the findings.

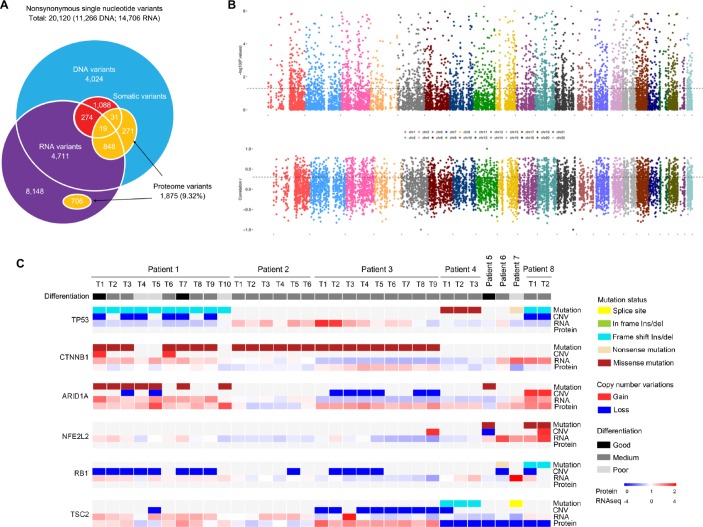
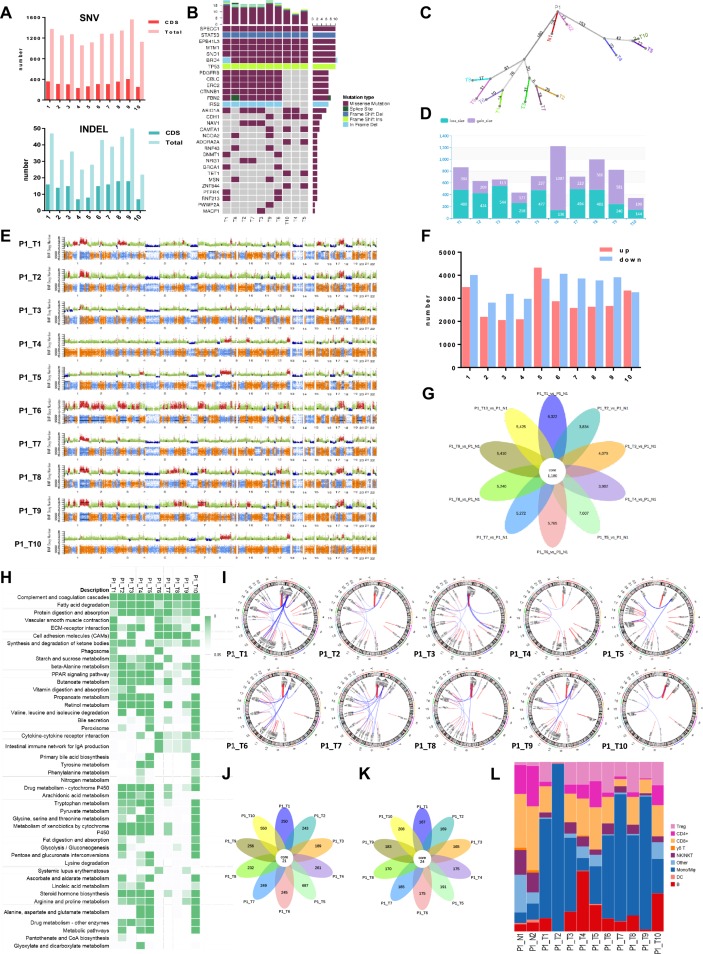
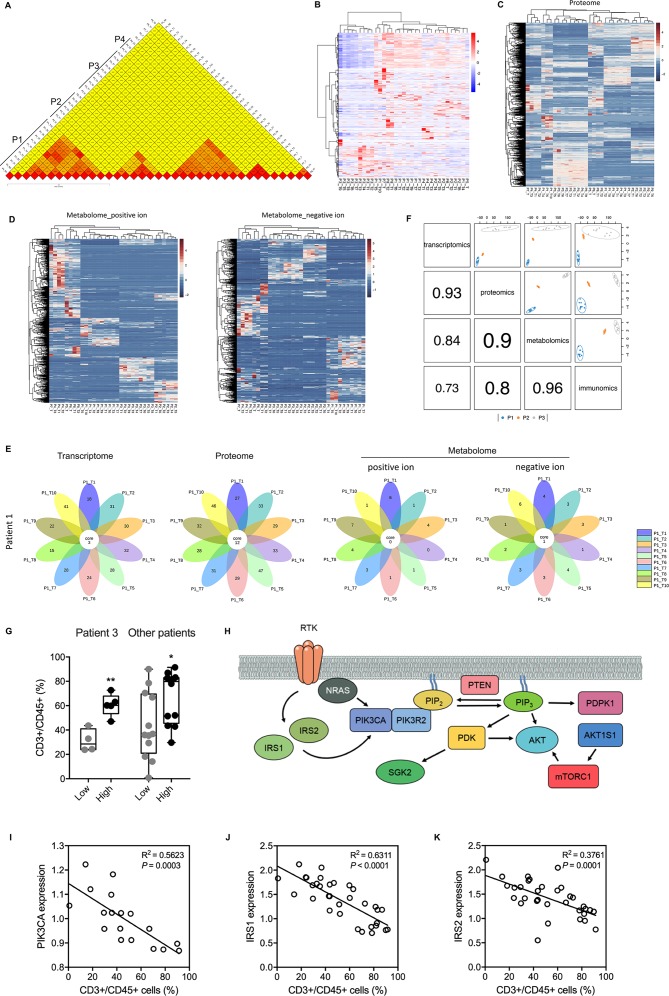
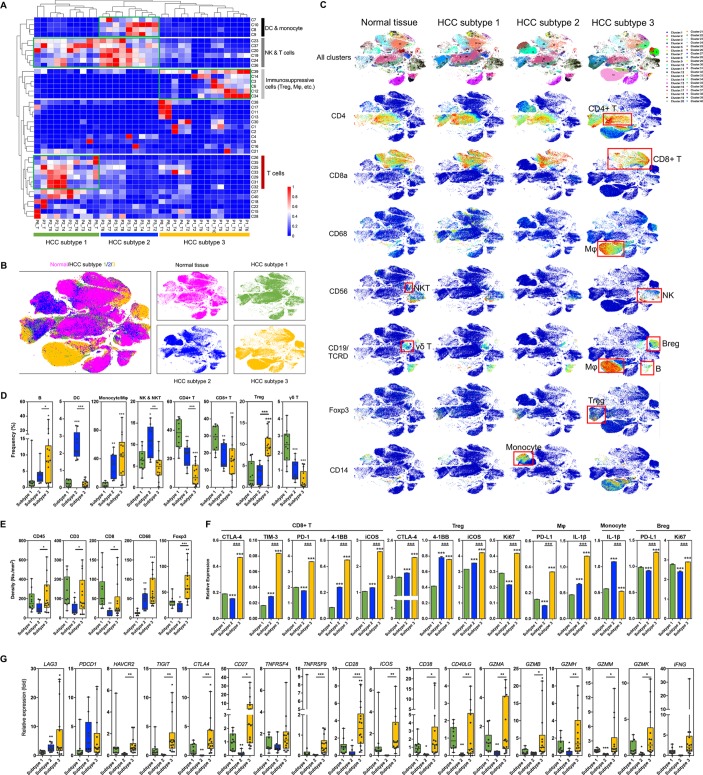
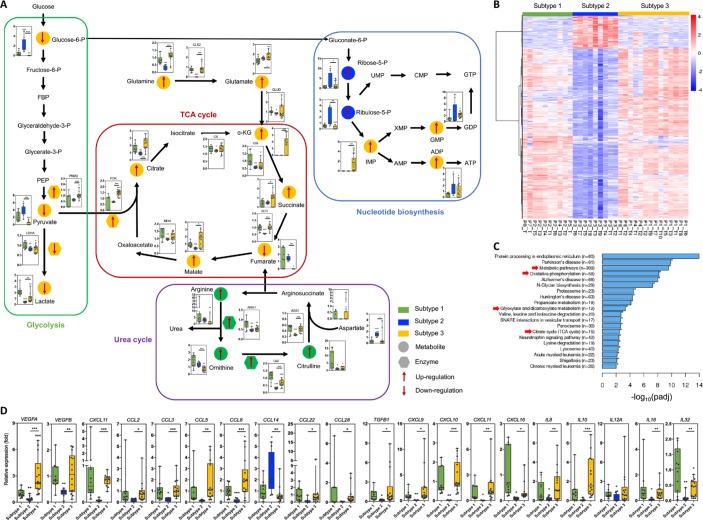
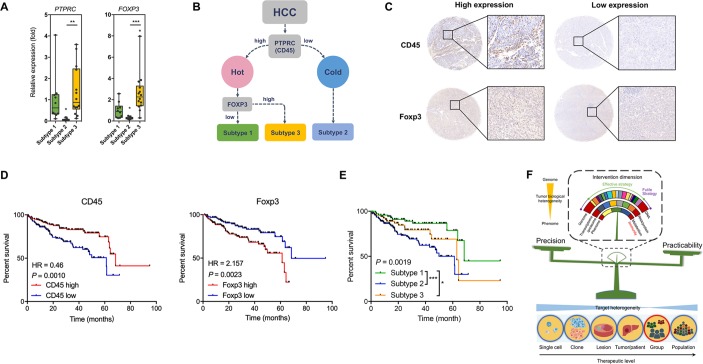
Results: Tumour heterogeneity is considerable with regard to the genomes, transcriptomes, proteomes, and metabolomes of lesions and tumours. The immune status of the HCC microenvironment was relatively less heterogenous. Targeting local immunity could be a suitable intervention with balanced precision and practicability. By clustering immune cells in the HCC microenvironment, we identified three distinctive HCC subtypes with immunocompetent, immunodeficient, and immunosuppressive features. We further revealed the specific metabolic features and cytokine/chemokine expression levels of the different subtypes. Determining the expression levels of CD45 and Foxp3 using immunohistochemistry facilitated the correct classification of HCC patients and the prediction of their prognosis.

Conclusion: There is comprehensive intratumoral and intertumoral heterogeneity in all dimensions of HCC. Based on the results, we propose a novel immunophenotypic classification of HCCs that facilitates prognostic prediction and may support decision making with regard to the choice of therapy.

Keywords: cancer immunobiology; energy metabolism; hepatocellular carcinoma; immunogenetics; immunotherapy.


Conflict of interest statement

Competing interests: None declared.

Figures

Figure 1
Figure 1
Comprehensive exploration of heterogeneity in HCC contributes to development of suitable therapeutic strategies. (A) Scheme showing the relation among precision of intervention, practicability of therapy, and tumour heterogeneity. Tumour biological heterogeneity decreases from genome to phenome, while target heterogeneity has a complicated change from single-cell level to a whole population due to the involvement of genomic background between individuals. Green shadow (individual level to population level) indicates practicable levels for developing therapies. (B) The locations of samples required in each patient the current study. (C) A scheme showing experiments and integrated analyses which were performed. (D) The morphological heterogeneity of typical samples under microscope.
Figure 2
Figure 2
Effects of genomic alterations on RNA and protein levels. (A) Overlap of nonsynonymous single nucleotide variants/single amino acid variants detected in whole-exome sequencing, RNA-seq, and LC-MS/MS. (B) Correlation between copy number variation and mRNA expression in all tumour samples. Spearman’s correlation P (upper) and r values (lower) between copy number and gene expression (y axis) are shown. Genes are ordered by their chromosome positions (x axis). Black lines denote P = 0.05 (upper) and r = 0.3 (lower). (C) Heatmap of mutations, CNV, and their associations with RNA and protein expression of HCC-relevant genes across lesions and tumours. Tumour differentiation status is annotated.
Figure 3
Figure 3
Heterogeneity of lesions within a tumour in various dimensions (Patient 1). (A) The differences of SNV, INDEL, and driven mutations in all HCC lesions. (B) Frequent driver mutations were shown in each lesion. (C) A phylogenic tree showing the genomic similarity of all HCC lesions. (D and E) Comparison of copy number variations. (F) Comparison of differentially expressed RNAs. Up- and down-regulation as compared to normal tissue. (G) A flower plot showing common and specific differentially expressed RNAs. (H) KEGG pathways differentially expressed RNAs enriched in different lesions. (I) Fusion genes detected in these lesions. (J) A flower plot showing common and specific differentially expressed proteins. (K) A flower plot showing common and specific differentially detected metabolites. (L) Comparison of frequencies of some key types of immune cells in HCC lesions.
Figure 4
Figure 4
Comparison of heterogeneity in different dimensions and various levels. (A) Jaccard scoring showed genomic difference between lesions and between patients. (B) Hierarchical clustering differentially expressed RNAs of all lesions. (C) Hierarchical clustering differentially expressed proteins of all lesions. (D) Hierarchical clustering differentially detected metabolites of all HCC lesions. (E) Flower plots showed common and specific enriched KEGG pathways using differentially expressed RNAs, proteins, and metabolites. (F) plotDIABLO shows the correlation between transcriptome, proteome, metabolome, and immunome. Three patients with more than five samples tested were analyzed. (G) A high enrichment score was associated with a high level of tumor infiltrating T cells in samples from Patient 3 and other patients. *, P < 0.05; **, P < 0.01. (H) Scheme showing main components of the PI3K-Akt signaling pathway. (I-K) The negative correlations between protein levels of PIK3CA (I), IRS1 (J), IRS2 (K) and infiltrating T cell level. Protein levels were derived from the proteomic data.
Figure 5
Figure 5
The detailed heterogeneity in the local immunity of HCC lesions. (A) A tSNE plot compares the difference in local immunity of the tumour and normal tissue. (B) A total of 40 clusters were identified, and were shown in a tSNE plot. (C) tSNE plots color-coded for expression of marker genes for eight main types of immune cells. (D) A heatmap showing the differential expression of 42 immune markers in the 40 cell clusters. Certain clusters were identified as known cell types according to typically expressed markers. (E) Frequencies of the 40 clusters in tumour and normal tissue. (F) Frequencies of the 40 clusters in different patients. (G) tSNE plots showing distinct immune landscape of tumours in different patients. (H) Correlation between different cell clusters.
Figure 6
Figure 6
The novel immunophenotypic classification of HCCs and the characteristics of different subtypes. (A) Hierarchical clustering of all HCC lesions according to the 40 clusters resulted in three obvious subtypes. (B) The difference in immune landscape of the three HCC subtypes. (C) tSNE plots color-coded for expression of marker genes for several main types of immune cells in the three HCC subtypes and normal tissue. Red boxes indicate main types of immune cells. (D) Frequencies of eight main types of immune cells in the three HCC subtypes. (E) Immunohistochemistry showing the differential expression of marker genes for immune cells. (F) Expression of functional genes in five key types of immune cells. Data derived from CyTOF. (G) Expression of functional genes in the three HCC subtypes. Data derived from RNA-seq. *P< 0.05; **P<0.01; ***P<0.001.
Figure 7
Figure 7
Differences in tumour cell metabolism and cytokine/chemokine expression among the three HCC subtypes. (A) Metabolomic analysis revealed featured alterations of TCA cycle, glycolysis, urea cycle, and nucleotide biosynthesis pathway in different HCC subtypes. (B) Hierarchical clustering of differentially expressed genes in the three HCC subtypes. (C) KEGG pathway enrichment of RNA- seq data showed significant changes in metabolism among the three HCC subtypes. Arrows indicate metabolism-related pathways. (D) Expression of important chemokines, cytokines, and other secretory biomaterials among the three HCC subtypes is shown. Data derived from RNA-seq. *P<0.05; **P< 0.01; ***P< 0.001.
Figure 8
Figure 8
The clinical value of the novel immunophenotypic classification of HCC. (A) Expression of PTPRC (CD45) and FOXP3 in the three HCC subtypes. Data derived from RNA-seq of the eight patients. (B) Scheme showing the classification of HCCs according to marker genes PTPRC and FOXP3. (C) Representative of IHC staining for subtype analysis using HCC tissue microarray. For CD45, the cut-off value for high and low expression was a density of 100 cells/mm2. For Foxp3, the cut-off value for high and low expression was a density of 25 cells/mm2. (D) Survival curves showing the predictive role of marker genes for patients’ prognosis. Data derived from a tissue microarray containing a cohort of 298 HCC patients. (E) Survival curves showing the distinctive prognosis of different HCC subtypes. Data derived from the tissue microarray. (F) Scheme showing that immunity would be a suitable invention dimension to treat HCC by balancing precision and practicability. *P<0.05; **P<0.01; ***P<0.001.

Comment in

References

    1. El-Serag HB. Hepatocellular carcinoma. N Engl J Med 2011;365:1118–27. 10.1056/NEJMra1001683 - DOI - PubMed
    1. Li C, Li R, Zhang W. Progress in non-invasive detection of liver fibrosis. Cancer Biol Med 2018;15:124–36. 10.20892/j.issn.2095-3941.2018.0018 - DOI - PMC - PubMed
    1. Cancer Genome Atlas Research Network. Electronic address wbe, Cancer Genome Atlas Research N. Comprehensive and Integrative Genomic Characterization of Hepatocellular Carcinoma. Cell 2017;169:1327–41. - PMC - PubMed
    1. Llovet JM, Ricci S, Mazzaferro V, et al. . Sorafenib in advanced hepatocellular carcinoma. N Engl J Med 2008;359:378–90. 10.1056/NEJMoa0708857 - DOI - PubMed
    1. Zhu AX, Finn RS, Edeline J, et al. . Pembrolizumab in patients with advanced hepatocellular carcinoma previously treated with sorafenib (KEYNOTE-224): a non-randomised, open-label phase 2 trial. Lancet Oncol 2018;19:940–52. 10.1016/S1470-2045(18)30351-6 - DOI - PubMed

Publication types

MeSH terms

Substances