. 2019 Jul;29(7):1047-1056.
doi: 10.1101/gr.239756.118. Epub 2019 Jun 21.

Exome-wide assessment of the functional impact and pathogenicity of multinucleotide mutations

Affiliations

Exome-wide assessment of the functional impact and pathogenicity of multinucleotide mutations

Joanna Kaplanis et al. Genome Res. 2019 Jul.

Abstract

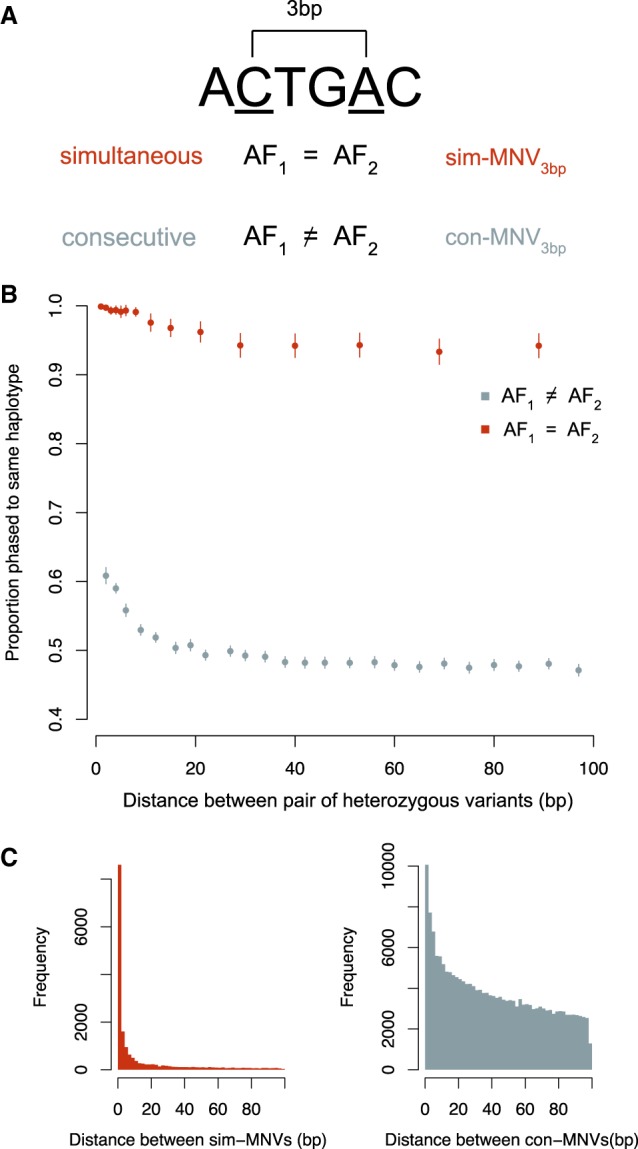
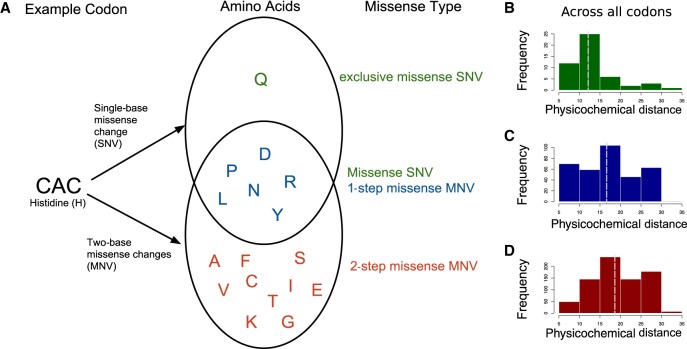
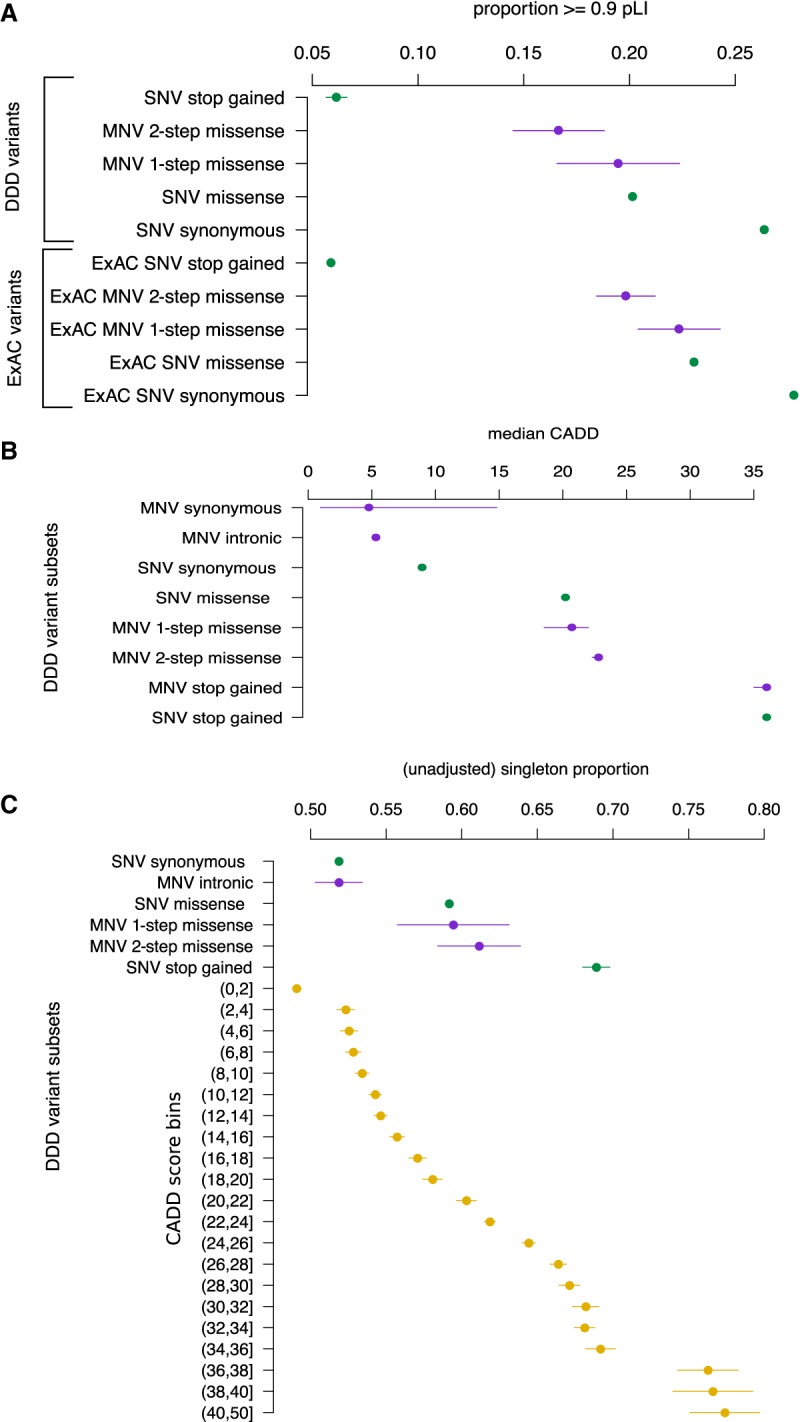
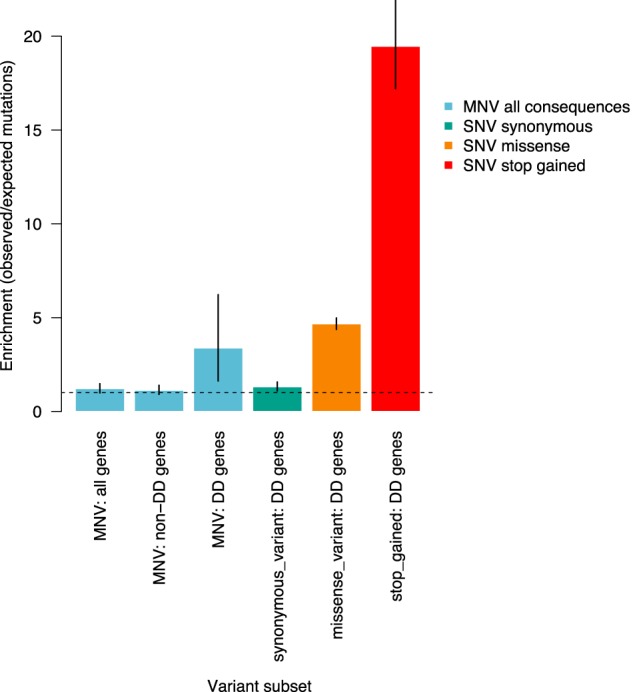
Approximately 2% of de novo single-nucleotide variants (SNVs) appear as part of clustered mutations that create multinucleotide variants (MNVs). MNVs are an important source of genomic variability as they are more likely to alter an encoded protein than a SNV, which has important implications in disease as well as evolution. Previous studies of MNVs have focused on their mutational origins and have not systematically evaluated their functional impact and contribution to disease. We identified 69,940 MNVs and 91 de novo MNVs in 6688 exome-sequenced parent-offspring trios from the Deciphering Developmental Disorders Study comprising families with severe developmental disorders. We replicated the previously described MNV mutational signatures associated with DNA polymerase zeta, an error-prone translesion polymerase, and the APOBEC family of DNA deaminases. We estimate the simultaneous MNV germline mutation rate to be 1.78 × 10⁻¹⁰ mutations per base pair per generation. We found that most MNVs within a single codon create a missense change that could not have been created by a SNV. MNV-induced missense changes were, on average, more physicochemically divergent, were more depleted in highly constrained genes (pLI ≥ 0.9), and were under stronger purifying selection compared with SNV-induced missense changes. We found that de novo MNVs were significantly enriched in genes previously associated with developmental disorders in affected children. This shows that MNVs can be more damaging than SNVs even when both induce missense changes, and are an important variant type to consider in relation to human disease.


Figures

Figure 1.
Figure 1.
Properties of MNVs. (A) Schematic showing how sim-MNVs, two variants that occur simultaneously, are defined as having two variants with identical allele frequencies, and con-MNVs, two variants that occur consecutively, as having different allele frequencies. (B) Proportion of pairs of heterozygous variants (possible MNVs) that phase to the same haplotype as a function of distance separated by sim and con. (C) The number of sim-MNVs and con-MNVs by distance between the two variants.
Figure 2.
Figure 2.
Classification of intra-codon MNV missense mutations. (A) Example of how one-step missense MNVs and two-step missense MNVs are classified using a single codon “CAC.” Venn diagram shows amino acids that can be created with either a single-base change or a two-base change in the codon “CAC.” (BD) Across all codons, the distribution of physicochemical distances for the amino acid changes caused by different types of missense variants: (B) exclusive SNV missense; (C) one-step MNV missense; and (D) two-step MNV missense. Dashed line indicates the median of the distribution.
Figure 3.
Figure 3.
Quantifying the pathogenicity of MNVs. (A) Proportion of variants that fall in genes with pLI ≥ 0.9 over different classes of variants for both DDD and ExAC data sets. SNVs are green; MNVs, purple. Lines are 95% confidence intervals. (B) The median CADD score over different classes of variants identified from DDD data with bootstrapped 95% confidence intervals. (C) Singleton proportion for different classes of DDD variants. In yellow are SNVs stratified by binned CADD scores with their corresponding singleton proportions. Lines are 95% confidence intervals.
Figure 4.
Figure 4.
Enrichment of de novo MNVs in DDD study. Ratio of observed number of de novo MNVs versus the expected number of de novo MNVs based on the estimate of the MNV mutation rate. Compared with enrichment of SNVs in DD genes in consequence classes synonymous, missense, and stop-gain.

References

    1. Aggarwala V, Voight BF. 2016. An expanded sequence context model broadly explains variability in polymorphism levels across the human genome. Nat Genet 48: 349–355. 10.1038/ng.3511 - DOI - PMC - PubMed
    1. Alexandrov LB, Nik-Zainal S, Wedge DC, Aparicio SA, Behjati S, Biankin AV, Bignell GR, Bolli N, Borg A, Børresen-Dale AL, et al. 2013. Signatures of mutational processes in human cancer. Nature 500: 415–421. 10.1038/nature12477 - DOI - PMC - PubMed
    1. Amirnovin R. 1997. An analysis of the metabolic theory of the origin of the genetic code. J Mol Evol 44: 473–476. 10.1007/PL00006170 - DOI - PubMed
    1. Amos W. 2010. Even small SNP clusters are non-randomly distributed: Is this evidence of mutational non-independence? Proc Biol Sci 277: 1443–1449. 10.1098/rspb.2009.1757 - DOI - PMC - PubMed
    1. Besenbacher S, Sulem P, Helgason A, Helgason H, Kristjansson H, Jonasdottir A, Jonasdottir A, Magnusson OT, Thorsteinsdottir U, Masson G, et al. 2016. Multi-nucleotide de novo mutations in humans. PLoS Genet 12: e1006315 10.1371/journal.pgen.1006315 - DOI - PMC - PubMed

Publication types