. 2019 Jun 21;10(1):2741.
doi: 10.1038/s41467-019-10401-y.

Monitoring biomolecule concentrations in tissue using a wearable droplet microfluidic-based sensor

Affiliations

Monitoring biomolecule concentrations in tissue using a wearable droplet microfluidic-based sensor

Adrian M Nightingale et al. Nat Commun. .

Abstract

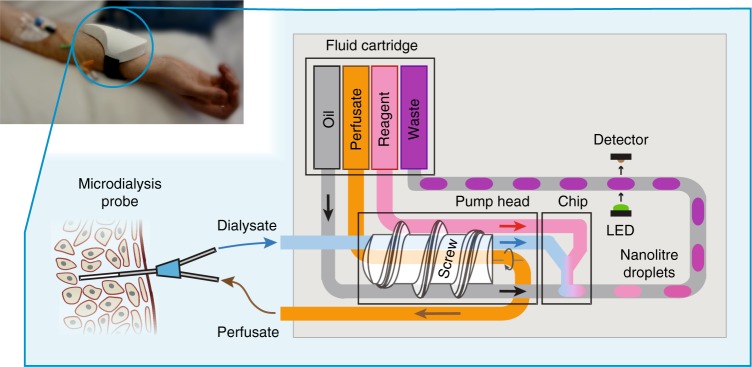
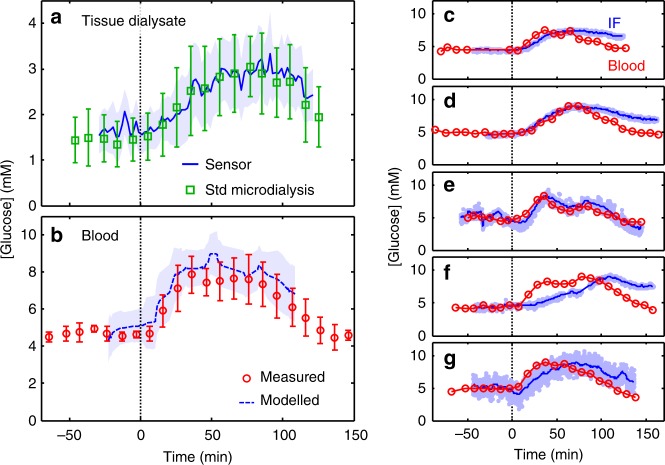
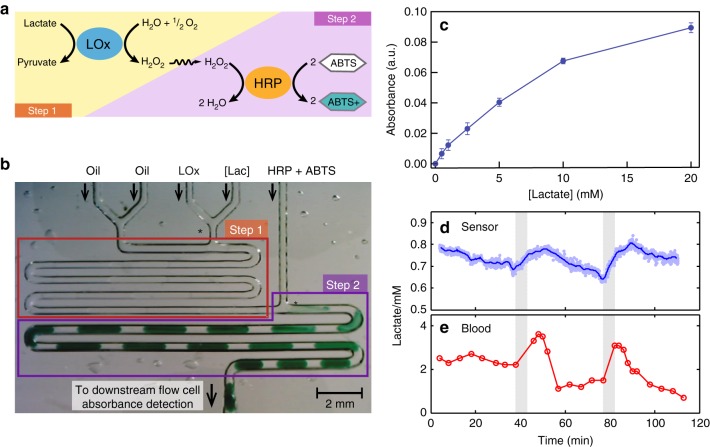
Knowing how biomarker levels vary within biological fluids over time can produce valuable insight into tissue physiology and pathology, and could inform personalised clinical treatment. We describe here a wearable sensor for monitoring biomolecule levels that combines continuous fluid sampling with in situ analysis using wet-chemical assays (with the specific assay interchangeable depending on the target biomolecule). The microfluidic device employs a droplet flow regime to maximise the temporal response of the device, using a screw-driven push-pull peristaltic micropump to robustly produce nanolitre-sized droplets. The fully integrated sensor is contained within a small (palm-sized) footprint, is fully autonomous, and features high measurement frequency (a measurement every few seconds) meaning deviations from steady-state levels are quickly detected. We demonstrate how the sensor can track perturbed glucose and lactate levels in dermal tissue with results in close agreement with standard off-line analysis and consistent with changes in peripheral blood levels.


Conflict of interest statement

X.N. is the founder of SouthWestSensor Ltd., which develops chemical sensor technology based on droplet microfluidics. Remaining authors declare no competing interests.

Figures

Fig. 1
Fig. 1
Schematic diagram illustrating the operation of the device. The screw-driven peristaltic pump simultaneously feeds perfusate into a microdialysis probe and withdraws the resulting dialysate into the device. From the pump, dialysate is delivered into a microfluidic chip, where an analyte-specific reagent is added, and the resultant flow immediately segmented into a stream of droplets by the addition of an immiscible oil. Within the droplets, the reagent reacts with the analyte to produce a measurable optical response. The droplets flow out of the chip into low-volume PTFE tubing and downstream to an optical flow cell where the product of the reaction is quantified. A microcontroller (not shown) saves the result to a micro SD card and relays it via Bluetooth to an external device. The analysed droplets are collected in a waste sachet for later disposal. An image illustrating a sensor being used in a clinical setting to monitor tissue is shown top-left
Fig. 2
Fig. 2
Anti-phase pulsatile flow and its use in droplet generation. a, b Flow rate over a three-pulse period for three aqueous lines (a): perfusate (probe push), dialysate (probe pull) and reagent, and the two oil lines (b). c Downstream velocity of droplets generated by the pulsatile flows (a, b) at a T-junction. d The linear droplet velocity for a single pumping period composed of one aqueous and oil pulse. The dashed lines correlate the velocity data to droplet generation at the T-junction (en) showing the controlled generation of a single droplet in the single pumping period. Scale bar in (e), 1 mm. o The droplet generation rate increases linearly with motor speed (and hence flow rate) for both 3 mm (blue circles) and 4 mm (red squares) screw thread pitches. The points fit on a straight line of unity gradient indicating that one droplet is produced in one turn of the pump. p Droplet volume is constant with respect to motor speed (and hence total flow rate) with different values for different pitch sizes. Error bars show the standard deviation in droplet size. q, r Droplet generation rate and volume remain constant when run at constant conditions (0.37 Hz, 3 mm pitch) over several hours. Error bars in (r) show the standard deviation in droplet size. s, t Comparison of the composition and size of droplets produced immediately after start-up using the screw-driven pump with 3 mm pitch (blue circles) and syringe pumps (green squares). The screw-driven pump instantaneously produces droplets of uniform composition (s) and volume (t), while the syringe pump shows significant drift over time
Fig. 3
Fig. 3
Glucose assay and sensor calibration. a The reaction mechanism for the glucose assay. Glucose is broken down by glucose oxidase (GOx) to yield gluconolactone and hydrogen peroxide (H2O2), which is then catalysed by horseradish peroxidase (HRP) in the presence of phenol and 4-aminoantipyrine (4-AAP) to form a red-violet coloured product quinoneimine. b Examples of raw data from the flow cell (top) converted to absorbance (bottom) using a pre-recorded blank measurement of droplets with 0 mM sample. c The measured absorbance was linear with respect to glucose concentration up to 8 mM. d Flow schematic diagram for droplet flow (left) and continuous flow (right) experiments. e Comparison of the sensor’s temporal response to a concentration step change when operating in droplets (blue) and continuous flow (red). In droplet flow, it took 38 s, or 13 droplets, to reach the step plateau whilst the continuous stream took 80 s. f Comparison of dynamic in vitro microdialysis response when operating in droplets (blue) and continuous flow (red). For microdialysis sampling, we imposed concentration change at the probe of varying durations, from 2 min to 30 s, to simulate transient events in tissues. The response is normalised relative to the response obtained when the glucose solution was directly aspirated, bypassing the microdialysis probe. Hence, the dotted line represents the relative recovery of the microdialysis probe
Fig. 4
Fig. 4
In vivo measurement of glucose in subcutaneous interstitial fluid. a Average (n = 5) dialysate glucose measured by the sensor (blue line and shaded area) and standard microdialysis sampling and offline analysis (green squares and error bars). Each is shown as a function of time since oral glucose administration (vertical dashed line, t = 0) and the error bars/area represent the standard deviation from subject-to-subject variation. b Mean (n = 5) venous blood glucose (red circles and error bars) shown as a function of time since oral glucose administration (vertical dashed line, t = 0). The error bars represent the standard deviation from subject-to-subject variation. The blue dashed line indicates the blood glucose predicted from the sensor data calculated using a two-compartment model, (see Methods and Supplementary Fig. 14). The shaded blue area show the standard deviation of the model output, while the dashed blue is a running average (median ± 20 min). cg Plots showing the blood glucose (red circles) and estimated interstitial fluid glucose (IF, light blue points with blue line showing a rolling average) for each individual
Fig. 5
Fig. 5
Lactate assay, calibration, and in vivo testing. a Reaction scheme for the lactate assay. Step 1—Lactate is broken down by lactate oxidase (GOx) to yield hydrogen peroxide (H2O2) and pyruvate. Step 2—The H2O2 is then catalysed by horseradish peroxidase (HRP) to oxidise 2,2′-azino-bis(3-ethylbenzothiazoline-6-sulfonic acid) (ABTS) to a blue-green coloured species (ABTS+). b Image of the lactate assay being performed on-chip. The asterisks (*) denote T junctions. Transparent droplets containing lactate samples and LOx at a 1:1 ratio are generated at the T-junction in Step 1. They then travel through the serpentine channel with enough time for the LOx reaction to run to completion. Upon dosing with HRP/ABTS at the second T-junction in Step 2, an intense blue-green colour starts to develop. c The two-step lactate assay (blue circles) gives a monotonic increase to 20 mM, with a near linear response at lower concentrations. Error bars refer to the standard deviation from measurement of multiple droplets. d In vivo sensor measurement of dialysate lactate from subcutaneous interstitial fluid. Each data point represents a measurement from a single droplet with the line indicating the running average. The shaded areas indicate periods of blood occlusion to the tissue. e Blood lactate during the same period

References

    1. Rogers, M. L. & Boutelle, M. G. In Annual Review of Analytical Chemistry, Vol 6.Annual Review of AnalyticalChemistry (eds R. G. Cooks & J. E. Pemberton) 427–453 (Annual Reviews, Palo Alto, 2013). - PubMed
    1. Agnesi F, et al. Wireless instantaneous neurotransmitter concentration system-based amperometric detection of dopamine, adenosine, and glutamate for intraoperative neurochemical monitoring laboratory investigation. J. Neurosurg. 2009;111:701–711. doi: 10.3171/2009.3.JNS0990. - DOI - PMC - PubMed
    1. Kishida KT, et al. Subsecond dopamine fluctuations in human striatum encode superposed error signals about actual and counterfactual reward. Proc. Natl Acad. Sci. USA. 2016;113:200–205. doi: 10.1073/pnas.1513619112. - DOI - PMC - PubMed
    1. Booth MA, et al. Chemical monitoring in clinical settings: recent developments toward real-time chemical monitoring of patients. Anal. Chem. 2018;90:2–18. doi: 10.1021/acs.analchem.7b04224. - DOI - PubMed
    1. Schazmann B, et al. A wearable electrochemical sensor for the real-time measurement of sweat sodium concentration. Anal. Methods. 2010;2:342–348. doi: 10.1039/b9ay00184k. - DOI

Publication types