. 2019 Jun 21;10(1):2757.
doi: 10.1038/s41467-019-10688-x.

Reduced subcutaneous adipogenesis in human hypertrophic obesity is linked to senescent precursor cells

Affiliations

Reduced subcutaneous adipogenesis in human hypertrophic obesity is linked to senescent precursor cells

Birgit Gustafson et al. Nat Commun. .

Abstract

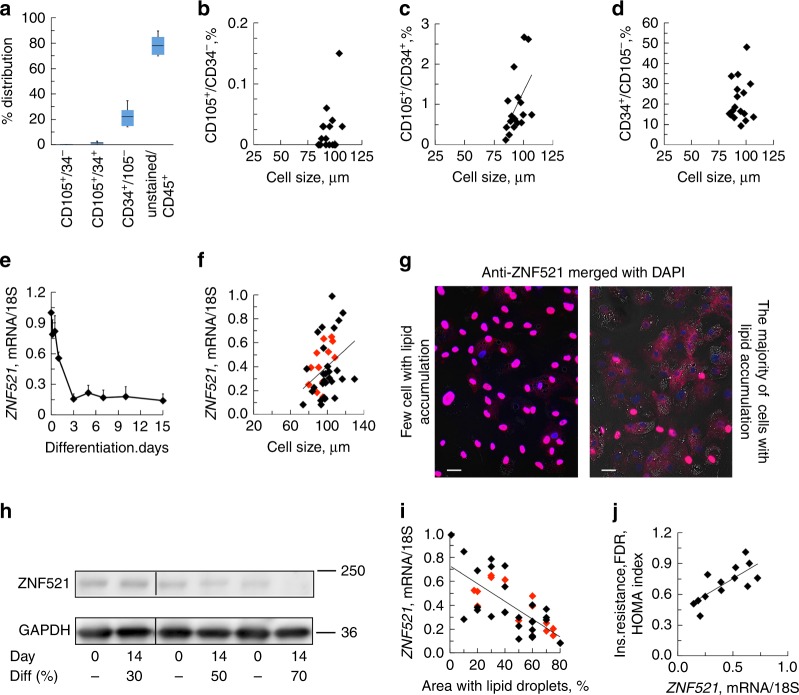
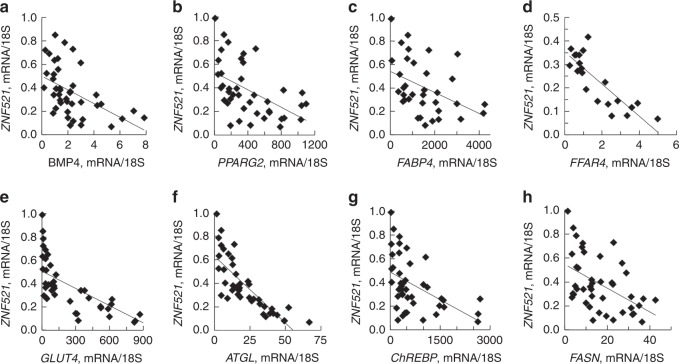
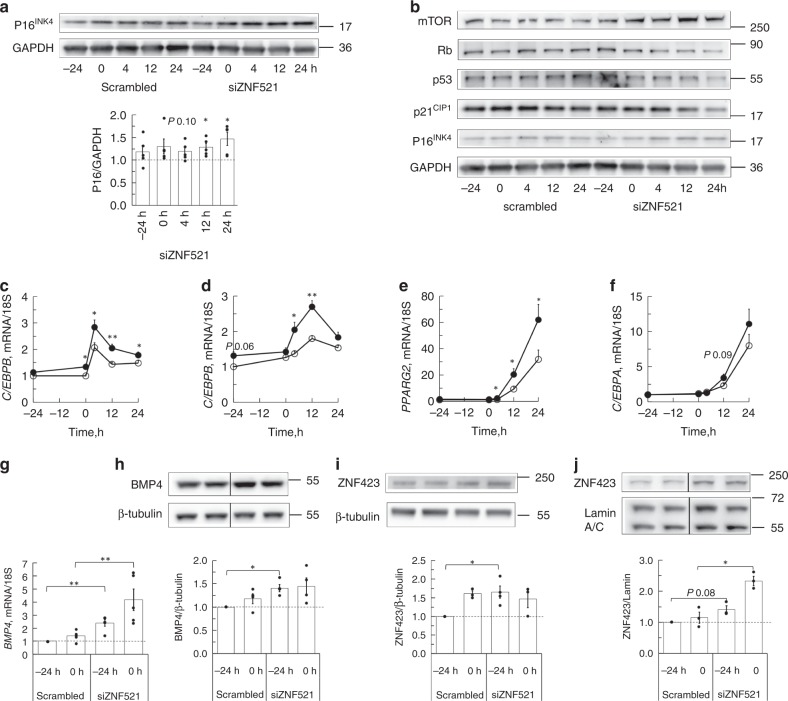
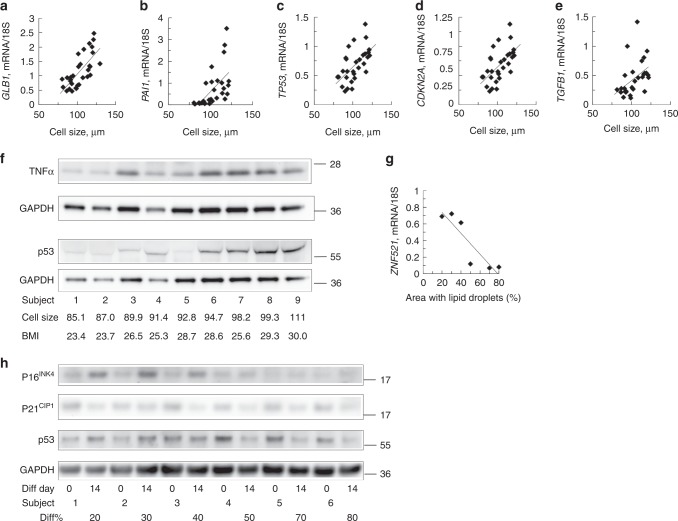
Inappropriate expansion of the adipose cells in the subcutaneous adipose tissue (SAT) is a characteristic of hypertrophic obesity and of individuals with genetic predisposition for T2D (first-degree relatives; FDR). It is associated with insulin resistance, a dysfunctional, adipose tissue and reduced adipogenesis. We examined the regulation of adipogenesis in human SAT precursor cells and found ZNF521 to be a critical regulator of early adipogenic commitment and precursor cells leaving the cell cycle. However, neither altered upstream signalling nor lack of SAT progenitor cells could explain the reduced adipogenesis in hypertrophic obesity. Instead, we show that progenitor cells undergoing poor differentiation are characterized by senescence, inability to suppress p53/P16INK4 and secretion of factors reducing adipogenesis in non-senescent cells. We found aging, FDR and established T2D to be associated with increased progenitor cell senescence, reduced adipogenesis and hypertrophic expansion of the SAT adipose cells.


Conflict of interest statement

The authors declare no competing interests.

Figures

Fig. 1
Fig. 1
Elevated expression of ZNF521 in SVF cells is associated with impaired adipogenic differentiation. a FACS analysis of the distribution of SVF cells isolated from human subcutaneous adipose tissue. Range CD105+/CD34 0–0.15%, range CD34+/CD105+, 0.12–2.7%, range CD34+/CD105 9.2–34.7%, and range unstained/CD45+ 49.3–89.6%. Data represent ±SEM, n = 17 biologically independent samples. bd Inter-relationship cell size vs. progenitor cells. c CD105+/CD34+ cells vs. adipose cell size, P= 0.012. Spearman´s correlation coefficient was used due to not normal distribution. e ZNF521 decreased during differentiation of SVF cells and reached a low plateau at day 3 n = 3 independent experiments. f Ratio of ZNF521 expression at differentiation day 14 and day 0 vs. adipose cell size of donor. Association were determined using Pearson correlation analysis P< 0.01, n = 43 biological independent samples. Controls black diamonds and FDR red diamonds. g Immunofluorescence of ZNF521 shows that SVF cells that acquire few lipids during differentiation retain ZNF521 in the nucleus. Differentiation day 6, double staining with DAPI. Scale bar 50 µm. h Immunoblot of ZNF521 in SVF cells with different degree of differentiation. Immunoblots from the same membrane. Variations at day 0 can be due to committed cells. i Correlation between lipid accumulation, and ZNF521 at day 14. Spearman′s correlation coefficient was used due to not normal distribution, P< 0.001, n = 43 biological independent samples. Individuals from f. j Association with ZNF521 and HOMA-IR in FDR. Association were determined using Pearson correlation analysis. P< 0.01, n = 13 biologically independent samples. f, i, j mRNA results were first normalized to 18S and then normalized to expression levels in the undifferentiated sample (=1)
Fig. 2
Fig. 2
ZNF521 is a key marker of adipogenic differentiation. ae Inter-relationship between expression of the adipogenic markers and ZNF521. FABP4; fatty acid binding protein 4 and GLUT4; solute carrier family 2 member 4 (SLC2A4). fh Inter-relationship between expression of the lipid markers palatin like phospholipase domain containing 2 (PNPLA2 also known as ATGL), MLX interacting protein like (MLXIPL also known as ChREBP) and FASN. ah mRNA results were first normalized to 18S and then normalized to expression levels in the undifferentiated sample (=1). Spearman′s correlation coefficient was used since ZNF521 was not normally distributed. FABP4 P< 0.01 n = 37 biological independent samples, remaining tested genes P< 0.001, n = 42 biological independent samples
Fig. 3
Fig. 3
Silencing ZNF521 activates progenitor cell commitment and induces expression of early adipogenic factors. Silencing of ZNF521 was performed 72 h before initiation of differentiation (0 h). a Immunoblot of P16INK4 after silencing ZNF521. Immunoblots from one individual. Graph shows normalization to scrambled cells at the same time point, n = 4 independent experiments, mean ± SEM. Paired two-tailed Student′s t-test was used for comparison with scrambled cells. b Immunoblots showing cell cycle proteins. Representative immunoblots from one individual of four. cf Expression of the early adipogenic genes. Paired two-tailed Student′s t-test was used for comparison of silenced with scrambled cells. Data represent means ± SEM *P< 0.05 and ** P< 0.01 n = 5 independent experiments. g Induction of BMP4 when ZNF521 is silenced. Data represent means ± SEM, n = 5. gj mRNA results were first normalized to 18 S and then normalized to expression levels in the undifferentiated scrambled cells at -24 h before initiation of differentiation. h Immunoblots of BMP4, n = 4 independent experiments and i ZNF423 in whole cell lysates, n = 4 independent experiments and j in nuclear extracts, n = 3 independent experiments. gj Paired two-tailed Student′s t-test was used for comparison of silenced with scrambled cells. *P< 0.05 and ** P< 0.01
Fig. 4
Fig. 4
Gene and protein levels of senescence markers are increased in hypertrophic obesity. ae Correlation of senescence markers and cell size in fresh SAT biopsies from lean, obese and obese T2D, GLB1 (P< 0.001), PAI1 (P< 0.001), TP53 (P< 0.003), CDKN2A/P16 INK4 (P< 0.001), and TGFB1 (P < 0.01), n = 28 biological independent samples. Comparisons were made with Spearman’s correlation coefficient. f Immunoblots of p53 and TNFα in SAT biopsies. g ZNF521 mRNA was reduced in cells with good differentiation measured as area with lipid droplets. Individuals from h. h Immunoblot from six individuals with different degree of differentiation. SVF cell were differentiated 14 days. ae mRNA expression was first normalized to 18 S and then normalized to expression in undifferentiated sample (=1)
Fig. 5
Fig. 5
Cell senescence induces proinflammatory signals and reduces lipid accumulation. a Double staining of differentiated SVF cells with ORO and β-galactosidase. Result from two individuals with different degree of differentiation. Scale bar 200 µm. b TNFA vs. IL6 in whole adipose tissue, P< 0.001, n = 28 biological independent samples. Comparisons were made with Spearman’s correlation coefficient. mRNA expression was first normalized to 18 S and then normalized to expression in undifferentiated sample (=1). cf Nutlin3a, inhibitor of p53 degradation, was added to the differentiation cocktail at time 0 h and was present throughout differentiation. Expression of adipogenic and senescence markers. Differentiation for 3 days (ce) and 12 days (f). Results from five independent experiments, means ± SEM. f Images from differentiation day 10 of the cells in figure (e). Scale bar 100 µm. cf Comparisons were made with Spearman’s correlation coefficient. *P< 0.05, **P< 0.01, and ***P< 0.001

References

    1. Arner E, et al. Adipocyte turnover: relevance to human adipose tissue morphology. Diabetes. 2010;59:105–109. doi: 10.2337/db09-0942. - DOI - PMC - PubMed
    1. Gustafson B, et al. BMP4 and BMP antagonists regulate human white and beige adipogenesis. Diabetes. 2015;64:1670–1681. doi: 10.2337/db14-1127. - DOI - PubMed
    1. Hammarstedt A, Gogg S, Hedjazifar S, Nerstedt A, Smith U. Impaired adipogenesis and dysfunctional adipose tissue in human hypertrophic obesity. Physiol. Rev. 2018;98:1911–1941. doi: 10.1152/physrev.00034.2017. - DOI - PubMed
    1. Gustafson B, Hammarstedt A, Hedjazifar S, Smith U. Restricted adipogenesis in hypertrophic obesity: the role of WISP2, WNT, and BMP4. Diabetes. 2013;62:2997–3004. doi: 10.2337/db13-0473. - DOI - PMC - PubMed
    1. Arner P, Arner E, Hammarstedt A, Smith U. Genetic predisposition for Type 2 diabetes, but not for overweight/obesity, is associated with a restricted adipogenesis. PLoS One. 2011;6:e18284. doi: 10.1371/journal.pone.0018284. - DOI - PMC - PubMed

Publication types

MeSH terms

Substances