. 2019 Jun 21;10(1):2735.
doi: 10.1038/s41467-019-10676-1.

IL-33-mediated mast cell activation promotes gastric cancer through macrophage mobilization

Affiliations

IL-33-mediated mast cell activation promotes gastric cancer through macrophage mobilization

Moritz F Eissmann et al. Nat Commun. .

Abstract

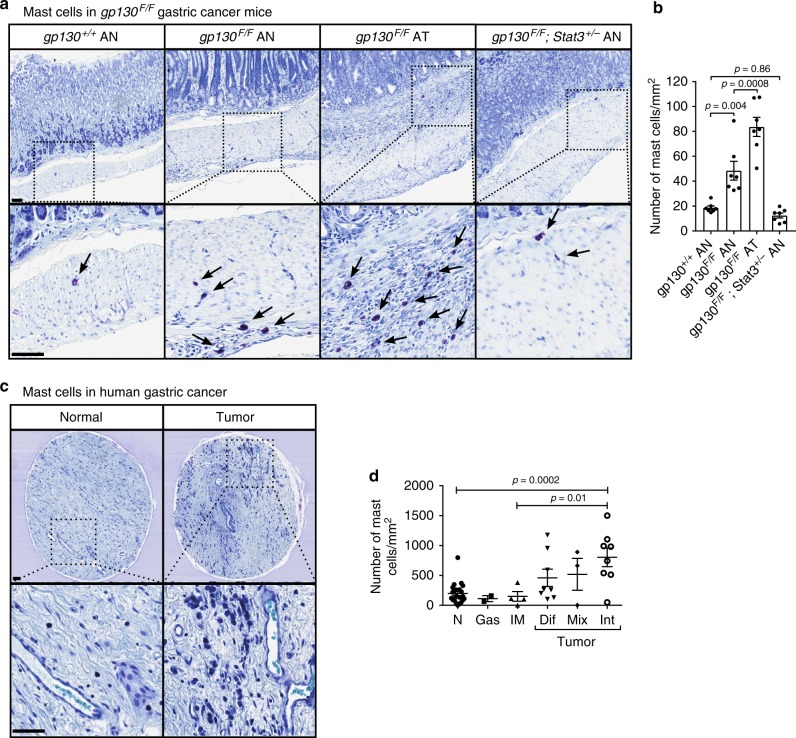
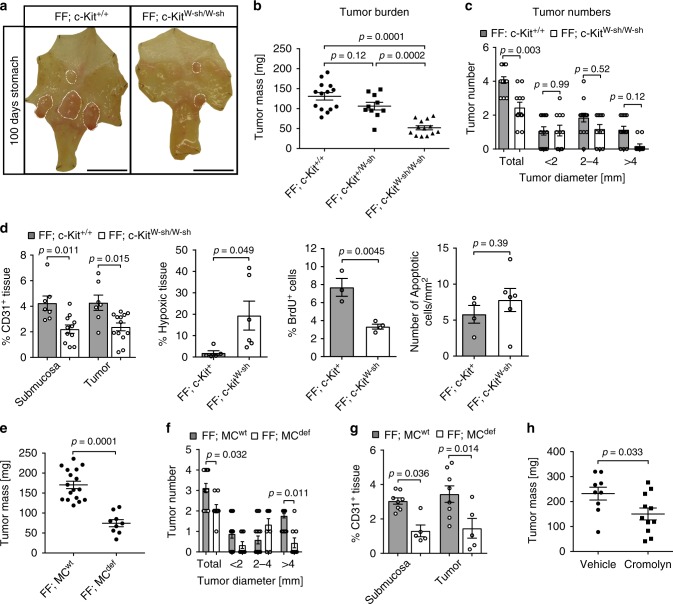
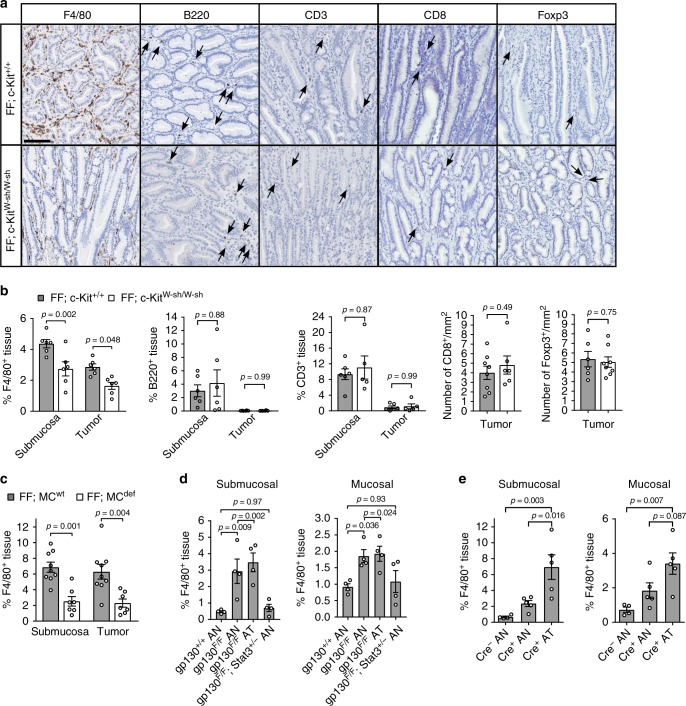
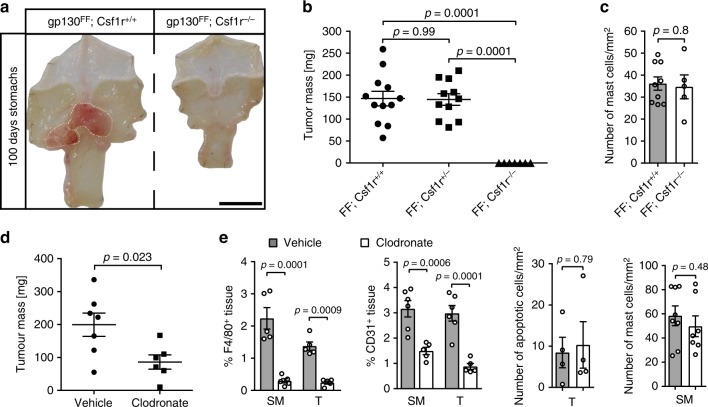
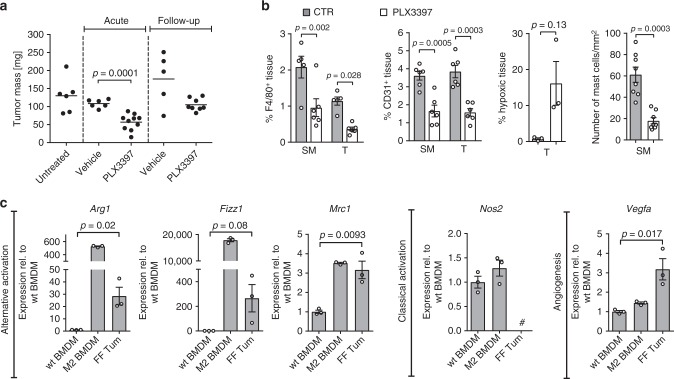
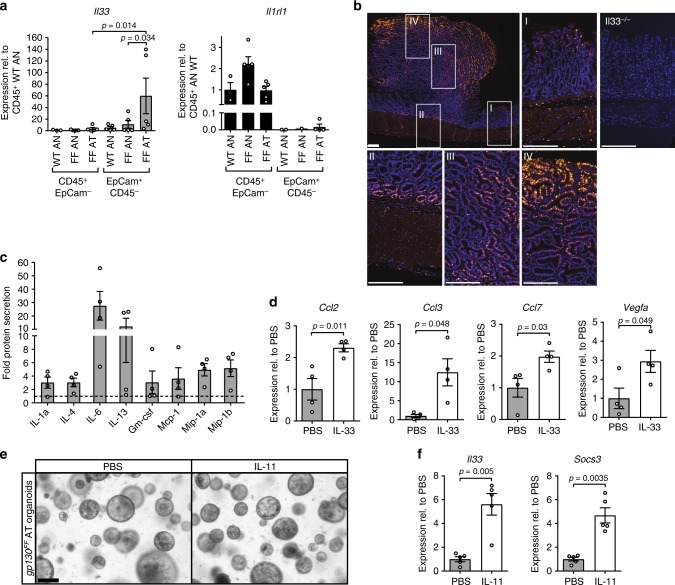
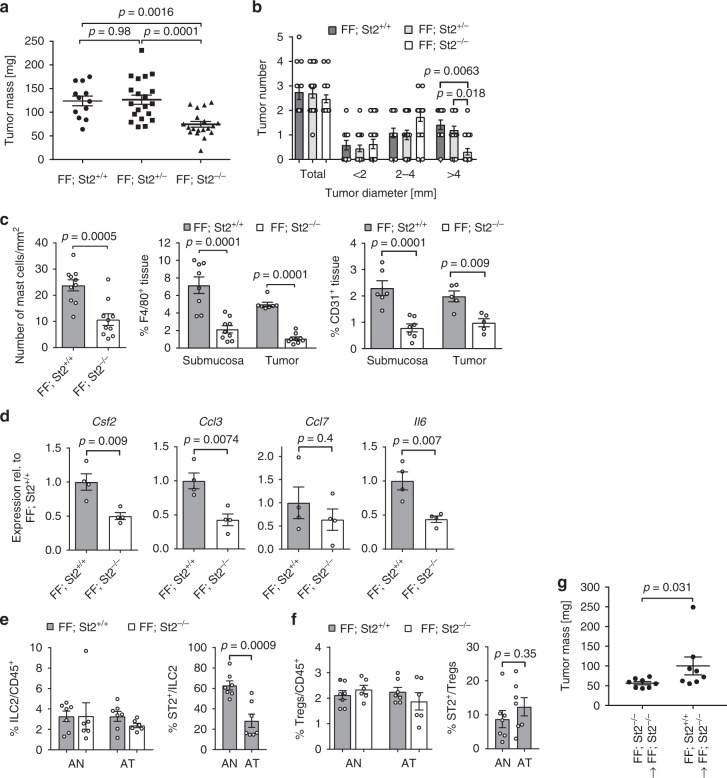
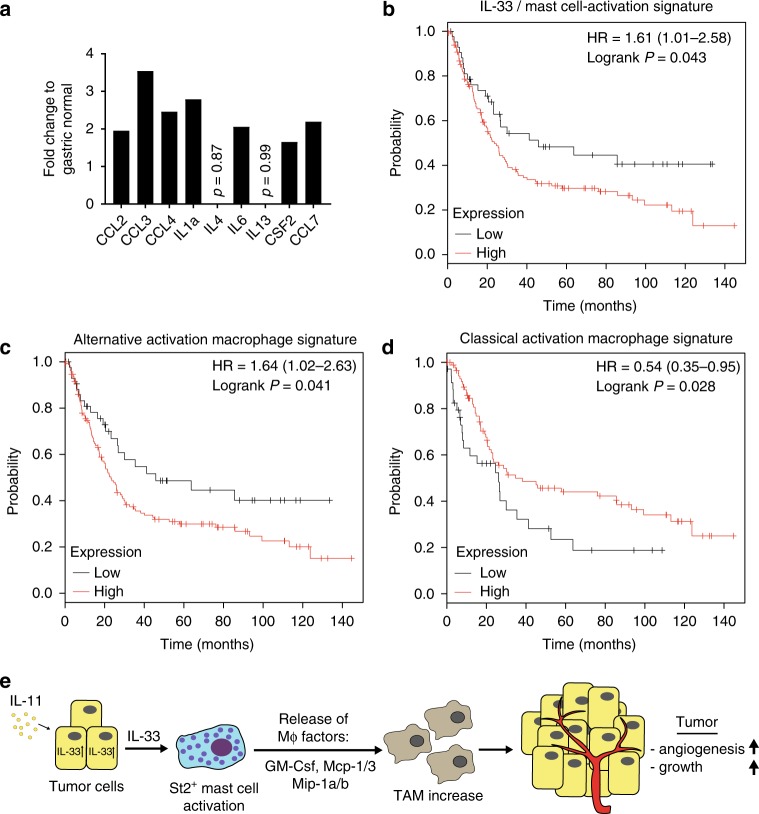
The contribution of mast cells in the microenvironment of solid malignancies remains controversial. Here we functionally assess the impact of tumor-adjacent, submucosal mast cell accumulation in murine and human intestinal-type gastric cancer. We find that genetic ablation or therapeutic inactivation of mast cells suppresses accumulation of tumor-associated macrophages, reduces tumor cell proliferation and angiogenesis, and diminishes tumor burden. Mast cells are activated by interleukin (IL)-33, an alarmin produced by the tumor epithelium in response to the inflammatory cytokine IL-11, which is required for the growth of gastric cancers in mice. Accordingly, ablation of the cognate IL-33 receptor St2 limits tumor growth, and reduces mast cell-dependent production and release of the macrophage-attracting factors Csf2, Ccl3, and Il6. Conversely, genetic or therapeutic macrophage depletion reduces tumor burden without affecting mast cell abundance. Therefore, tumor-derived IL-33 sustains a mast cell and macrophage-dependent signaling cascade that is amenable for the treatment of gastric cancer.


Conflict of interest statement

The authors declare no competing interests.

Figures

Fig. 1
Fig. 1
Submucosal mast cell numbers are increased in gastric cancer in mice and humans. a Representative cross sections of stomachs of 100 day old gp130 mutant mice of the indicated genotype and stained with toluidine blue showing the affected antrum (AN) and antral tumor (AT), respectively. Mast cells appear purple (arrows). Scale bars = 50 µm. b Quantification of submucosal mast cell in sections depicted in (a). n = 7 mice per cohort obtained from two independent experiments, one-way ANOVA F (DFn = degree of freedom nominator, Dfd = degree of freedom denominator) = 34.96 (3, 24). c Representative sections of toluidine blue-stained biopsy cores of human gastric cancer (GC) and adjacent submucosa and of normal stomach submucosa. Scale bars = 50 µm. d Quantification of submucosal mast cell in sections depicted in c. Each symbol represents an individual patient biopsy from submucosa of normal (N; n = 22), gastritis (Gas; n = 2), intestinal metaplasia (IM; n = 4), diffuse (Dif; n = 8), mixed (Mix; n = 3), and intestinal-type (Int; n = 8) gastric cancer. One-way ANOVA F (DFn, Dfd) = 5.809 (5, 41). Data are represented as mean ± SEM, with p < 0.05 considered significant. Source data are provided as a Source Data file. See also related Supplementary Fig. 1
Fig. 2
Fig. 2
Gastric tumor burden is reduced in mast cell–deficient gp130FF tumor mice. a Representative whole mounts of pinned out stomachs, from 100-day-old gp130FF; c-Kit+/+ and mast cell-deficient gp130FF; c-KitW-sh/W-sh mice. Scale bars = 1 mm. b Quantification of total tumor burden per mouse as in (a). Each symbol represents an individual mouse. One-way ANOVA F (DFn, Dfd) = 25.97 (2, 24). c Enumeration of total tumor number and tumor size distribution as in a from gp130FF; c-Kit+/+ (n = 14) and gp130FF; c-KitW-sh/W-sh mice (n = 11). One-way ANOVA F (DFn, Dfd) = 24.59 (7, 92). d Quantification of CD31, Hypoxyprobe (hypoxia), BrdU (proliferation), or ApopTag (apoptosis) on immunostained gastric tumors sections. Number of mice (n) for CD31: FF; c-Kit+/+ n = 7, FF; c-KitW-sh/W-sh n = 11 with ANOVA F (DFn, Dfd) = 7.075 (3, 34); Hypoxyprobe: FF; c-Kit+ n = 5, FF; c-KitW-sh n = 6 with t-test + Welch correction’s t (df) = 2.55 (5.256); BrdU: FF; c-Kit+ n = 3, FF; c-KitW-sh n = 4 with t-test’s t (df) = 4.905 (5); Apoptosis: FF; c-Kit+ n = 4, FF; c-KitW-sh n = 6 with t-test’s t (df) = 0.89 (8). e Quantification of total tumor burden per mouse of mast FF; MCwt (genotypes: FF; Cpa3-Creneg; Mcl1fl/fl and FF,Cpa-Cre;Macl1+/+) and mast cell-deficient FF; MCdef (genotype: FF; Cpa3-Cre; Mcl1fl/fl) mice. t-test’s t (df) = 6.72 (24). f Enumeration of the tumor number per mouse of FF; MCwt (n = 17 mice) and mast cell-deficient FF; MCdef (n = 9 FF; Cpa3-Cre; Mcl1fl/fl mice). One-way ANOVA F (DFn, Dfd) = 23.25 (7, 96). g CD31 angiogenic staining quantification of stomachs from (e, f). FF; MCwt (n = 8 mice) and FF; MCdef (n = 5) with one-way ANOVA F (DFn, Dfd) = 6.79 (3, 22). h Quantification of total tumor burden in gp130FF mice after 6 weeks administration of cromolyn (mast cell degranulation inhibitor) or vehicle. Each symbol represents an individual mouse and data was generated in three independent experiments. t-test’s p value is shown and t (df) = 2.313 (18). Data are represented as mean ± SEM, with p values p < 0.05, being considered significant. Source data are provided as a Source Data file. See also related Supplementary Fig 2
Fig. 3
Fig. 3
Mast cell depletion reduces macrophage infiltration in gastric tumors of gp130FF mice. a Representative images of tissue sections immunostained for macrophages (F4/80), B cells (B220) or T cells (CD3, CD8, Foxp3) in gastric tumor sections of gp130FF; c-Kit+/+ and mast cell-deficient gp130FF; c-KitW-sh/W-sh mice. Arrows indicate specific positive cell staining; scale bars = 100 µm. b Quantification of F4/80, B220, or CD3 expressing cells in tumor and tumor-associated submucosal layers of sections from (a). F4/80: n = 6 each group, one-way ANOVA F (DFn, Dfd) = 13.43 (3, 20); B220: n = 6 each group, one-way ANOVA F (DFn, Dfd) = 3.782 (3, 20); CD3: FF; c-Kit+/+ n = 6, FF; c-KitW-sh/W-sh n = 5, one-way ANOVA F (DFn, Dfd) = 11.55 (3, 18); CD8: FF, c-Kit+/+ n = 8, FF; c-KitW-sh/W-sh n = 6, t-test t (df) = 0.71 (12); Foxp3: FF, c-Kit+/+ n = 6, FF; c-KitW-sh/W-sh n = 8, t-test t (df) = 0.33 (12). Data from two independent experiments were analyzed. c F4/80+ cells frequency in stomach submucosa and tumors of FF; MCwt mice (n = 9) and mast cell-deficient FF; MCdef mice (n = 7 FF;Cpa3-Cre; Mcl1fl/fl). One-way ANOVA F (DFn, Dfd) = 10.81 (3, 28). d Quantification of F4/80+ cells in unaffected antrum (AN) or antrum tumor (AT) in submucosa or mucosa of mice of the indicated genotype. All groups n = 4. Submucosal: one-way ANOVA F (DFn, Dfd) = 10.12 (3, 12); Mucosal: one-way ANOVA F (DFn, Dfd) = 5.086 (3, 12). e Quantification of F4/80+ cells in unaffected antrum (AN) or antrum tumors (AT) in submucosa or mucosa of mice from the Tg(Tff1-CreERT2); Pik3caH1047R/+; Ptenfl/fl strain that either harbor (Cre+) or lack (Cre) the Tff1-CreERT2 driver. Cre AN n = 4, Cre+ AN and Cre+ AT n = 5 for both. Analyses from two independent experiments. Submucosal: one-way ANOVA F (DFn, Dfd) = 10.52 (2, 11); Mucosal: one-way ANOVA F (DFn, Dfd) = 7.485 (2, 11). Data are represented as mean ± SEM, with p values p < 0.05 considered being significant. Source data are provided as a Source Data file. See also related Supplementary Fig. 3
Fig. 4
Fig. 4
Tumor burden in gp130FF mice diminishes upon macrophage depletion. a Representative whole mount of stomachs from 100-day-old mice of the indicated genotype. Scale bar = 1 mm. b Quantification of total tumor burden per mouse as in (a). Each symbol represents an individual mouse. Due to ill health some gp130F/F; Csf1r/− mice had to be analyzed before the 100 day endpoint; average mouse age per groups were: gp130F/F; Csf1r+/+ 88.2 days, gp130F/F; Csf1r+/− 90.4 days, and gp130F/F; Csf1r−/− 81.6 days. One-way ANOVA F (DFn, Dfd) = 27.55 (2, 27). c Quantification of mast cell density in antral submucosa of indicated genotype was performed with gp130F/F; Csf1r+/+ n = 9 and gp130F/F; Csf1r/− n = 5 biological samples from two independent experiments t-test t (df) = 0.262 (12). d Assessment of total tumor burden in gp130FF mice after 6 weeks administration of clodronate (50 μl of a clodrosome solution containing 5 mg/ml clodronate) or vehicle. Each symbol represents an individual mouse; data from two independent experiments (t-test t (df) = 2.622 (11)). e Quantification of F4/80, CD31, ApopTag, or toluidine blue (for detection of mast cells) stained sections of gastric tumors (T) and tumor-associated submucosa (SM) from gp130FF mice of the indicated treatment cohort. F4/80: all n = 5, one-way ANOVA F (DFn, Dfd) = 27.17 (3, 16); CD31: n = 6 (SM tissues), n = 5 (T tissues), one-way ANOVA F (DFn, Dfd) = 18.15 (3, 18); apoptotic cells: n = 4 (both groups), t-test t (df) = 0.27 (6); mast cells: n = 8 (vehicle) and n = 7 (Clodronate), t-test t (df) = 0.73 (13). Data are represented as mean ± SEM, with p values p < 0.05 considered being significant. Source data are provided as a Source Data file. See also related Supplementary Fig. 4
Fig. 5
Fig. 5
Pharmacological macrophage targeting and macrophage polarization in gp130FF tumors. a Total tumor burden in gp130FF mice was quantified either acutely after a 4-week-treatment period with PLX3397 (Csf1r/c-Kit/Flt3 tyrosine kinase receptor inhibitor) or vehicle or after a 4 weeks treatment-free follow-up period. Each symbol represents an individual mouse. Data from three independent experiments are presented. t-test t (df) = 5.23 (14). b Quantification of F4/80, CD31, Hypoxyprobe or toluidine-blue-stained sections of submucosa (SM) or gastric tumors (T) of gp130FF mice of the indicated acute treatment cohort. F4/80: n = 5 (Vehicles) and n = 6 (PLX3397), one-way ANOVA F (DFn, Dfd) = 12.34 (3, 18); CD31: n = 6, one-way ANOVA F (DFn, Dfd) = 18.33 (3,20); hypoxic tissue: n = 3, t-test with Welch’s correction t (df) = 2.53 (2); mast cells: n = 8 (both groups), and t-test with Welch’s correction t (df) = 5.59 (9.27). c qPCR expression analysis of genes associated with alternative activation (Arg1, Fizz1, Mrc1), classical activated (Nos2) and angiogenesis (Vegfa) of purified F4/80+ tumor-associated macrophages (FF Tum) or following stimulation of bone marrow-derived macrophages (BMDM) from wild-type mice and stimulated either with vehicle (wt BMDM) or with IL-4/IL-13 (20 ng/ml) to induce an alternative activated endotype (M2 BMDM). n = 3 mice. Hash indicates that expression was below detection limit. Arg1: t-test t (df) = 3.8 (4); Fizz1: t-test t (df) = 2.39 (4); Mrc1: t-test t (df) = 4.69 (4); Vegfa: t-test t (df) = 3.96 (4). Data are represented as mean ± SEM, with p values p < 0.05 considered being significant. Source data are provided as a Source Data file. See also related Supplementary Fig. 4
Fig. 6
Fig. 6
IL-33 expression in gastric tumors of gp130FF mice and mast cell activation analysis. a qPCR expression analysis of Il33 and full-length St2 (Il1rl1) genes associated with hematopoietic (CD45+; EpCam) and epithelial (EpCam+; CD45) cells purified from unaffected antrum (AN) or antrum tumors (AT) from wild-type and gp130FF (FF) mice. Data are normalized to Gapdh and plotted as relative expression to CD45+; EpCAM WT AN expression. n = 5 mice. Il1rl1 expression in EpCam+; CD45 cells was for several samples below detection limit. Data was pooled from two independent experiments. For IL33 data, one-way ANOVA was performed with F (DFn, Dfd) = 2.871(5, 22); b Immunofluorescence staining for IL-33 in stomachs of tumor-bearing gp130FF mice with insets referring to unaffected antrum (I), submucosal-tumor junction (II), tumor core (III), and tumor edge (IV). Stomachs from Il33−/− mice were used for specificity controls. Scale bars = 200 µm. c Multiplex cytokine analysis of supernatant of FACS-purified tumor-associated mast cells stimulated with IL-33 (30 ng/ml) for 3 h. Data are shown only for factors with > 3 fold increase relative to unstimulated control cultures. n = 4 from four independent experiments. d qPCR gene expression analysis in FACS-purified tumor-associated mast cells stimulated with IL-33 (30 ng/ml) for 3 h or vehicle. n = 4 from four independent experiments. Ccl2: t-test t (df) = 3.61 (6); Ccl3: t-test t (df) = 3.2 (3.09); Ccl7: t-test t (df) = 2.84 (6); Vegfa: t-test t (df) = 2.45 (6). e Representative images of organoids derived from antral tumors (AT) of gp130FF mice stimulated either with PBS or IL-11 (100 ng/ml for 2 days). Scale bar = 200 µm. f Il33 gene expression analysis of gp130FF tumor-derived epithelial organoids either stimulated with IL-11 (100 ng/ml) or with PBS for 4 h. For comparison expression of Stat3-target gene, Socs3, was also analyzed. n = 5 from two independent experiments. Stat3: t-test t (df) = 4.96 (4.42); Socs3: t-test t (df) = 5.6 (4.48). Data are represented as mean ± SEM, with p values p < 0.05 considered being significant. Source data are provided as a Source Data file. See also related Supplementary Fig. 5
Fig. 7
Fig. 7
Tumor burden is reduced in St2 receptor-deficient gp130FF mice. a Quantification of total tumor burden in 100-day-old mice of the indicated genotype. Each symbol represents an individual mouse. One-way ANOVA was performed with F (DFn, Dfd) = 11.83 (2, 48). b Enumeration of total tumor number from mice in a, and of tumors following classification according to their size. n = 12 (FF, St2+/+), n = 20 (FF, St2+/), and n = 19 (FF, St2−/−) mice. One-way ANOVA was performed with F (DFn, Dfd) = 22.79 (11, 192). c Quantification of toluidine blue (for detection of mast cells; submucosal tissue), F4/80 and CD31 stained sections of gastric tumors of mice of the indicated genotype. Mast cells: n = 10 mice, t-test t (df) = 4.25 (18); F4/80: n = 8 (FF; St2+/+), n = 9 (FF; St2/−), one-way ANOVA F (DFn, Dfd) = 27.52 (3,29); CD31: n = 6 (Submucosa) n = 5 (Tumor), and one-way ANOVA F (DFn, Dfd) = 13.6 (3,19). d qPCR expression analysis of chemokines expressed by FACS-purified tumor-associated mast cells from stomachs of either FF; St2+/+ or FF; St2−/− mice. All n = 4 from two independent experiments. Csf2: t-test t (df) = 3.81 (6); Ccl3: t-test t (df) = 3.97 (6); Ccl7: t-test t (df) = 0.88(6); Il6:: t-test t (df) = 4.02 (6); e, f Flow cytometric analysis of unaffected antrum (AN) and antrum tumors (AT) of indicated genotype for the frequency of ILC2 cells (lineage, Cd11b, Gata3+), Tregs (Foxp3+, CD4+), and proportion of St2+ cells within these cell types. FF; St2+/+ n = 7 and FF; St2−/− n = 6, from two independent experiments. ST2+/ILC2: t-test t (df) = 4.39 (12); ST2+/Treg: t-test t (df) = 0.98 (12). g Enumeration of total tumor burden at 14 weeks of age of FF; St2−/− host mice, which received tail vein injections of either FF; St2−/− or FF, St2+/+ bone marrow-derived mast cells (BMMC) (n = 8 mice per group). Mann–Whitney test was performed with Mann–Whitney U = 11.5. Data are represented as mean ± SEM, with p values p < 0.05 considered being significant. Source data are provided as a Source Data file. See also related Supplementary Fig. 6
Fig. 8
Fig. 8
Kaplan–Meier analysis for an IL-33 - mast cell activation gene expression signature. a Expression analysis of genes associated with IL-33 dependent mast cell activation derived from the DERRICO gastric data set (GEO: GSE13911, extracted from oncomine.org) and comparing normal gastric mucosa (n = 31) and gastric intestinal-type adenocarcinoma (n = 29). The p-value for the genes is p < 0.05 except where indicated. bd Kaplan–Meyer survival analysis was performed for human intestinal-type gastric cancer (iGC) with IL-33/ mast cell activation signature consisting of CCL2, CCL3, CCL4, IL1a, IL6, CSF2, and CCL7 (b), with alternative activation macrophage expression signature (CD163, CD204, MARCO, ARG1) (c) and classical activation macrophage expression signature (NOS2A, HLA-DRA, CD80, CD86, CD169) (d). e Schematic illustration of the proposed gastric cancer growth promoting IL-11/IL-33/mast cell/TAM signaling axis. Source data are provided as a Source Data file. See also related Supplementary Fig. 7

References

    1. Joyce JA. Therapeutic targeting of the tumor microenvironment. Cancer Cell. 2005;7:513–520. doi: 10.1016/j.ccr.2005.05.024. - DOI - PubMed
    1. Fridman WH, Pagès F, Sautès-Fridman C, Galon J. The immune contexture in human tumours: impact on clinical outcome. Nat. Rev. Cancer. 2012;12:298–306. doi: 10.1038/nrc3245. - DOI - PubMed
    1. Qian B-Z, Pollard JW. Macrophage diversity enhances tumor progression and metastasis. Cell. 2010;141:39–51. doi: 10.1016/j.cell.2010.03.014. - DOI - PMC - PubMed
    1. Galli SJ, Nakae S, Tsai M. Mast cells in the development of adaptive immune responses. Nat. Immunol. 2005;6:135–142. doi: 10.1038/ni1158. - DOI - PubMed
    1. Blank U, Rivera J. The ins and outs of IgE-dependent mast-cell exocytosis. Trends Immunol. 2004;25:266–273. doi: 10.1016/j.it.2004.03.005. - DOI - PubMed

Publication types

MeSH terms