. 2019 Jun 21;9(1):9060.
doi: 10.1038/s41598-019-45515-2.

Open chromatin dynamics in prosensory cells of the embryonic mouse cochlea

Affiliations

Open chromatin dynamics in prosensory cells of the embryonic mouse cochlea

Brent A Wilkerson et al. Sci Rep. .

Abstract

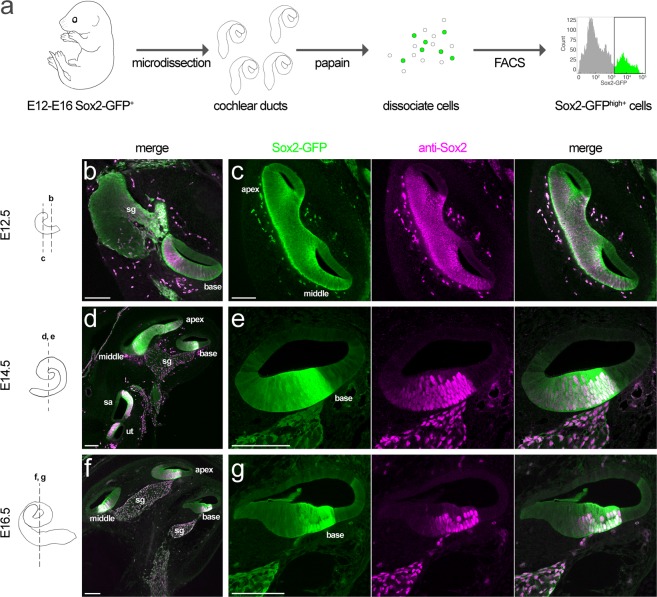
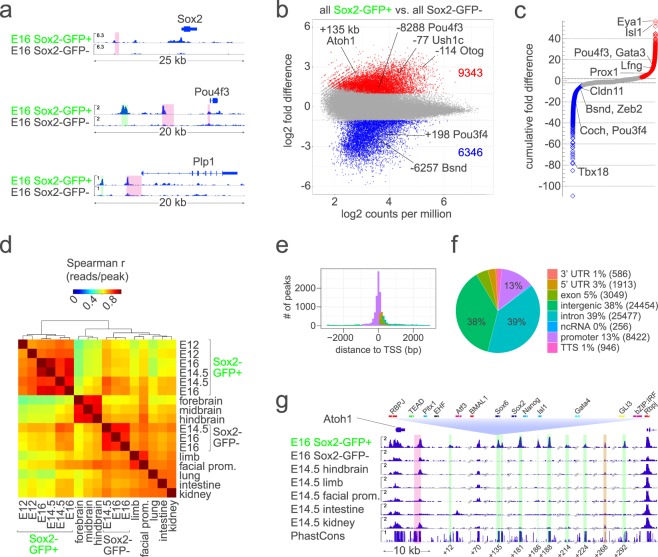
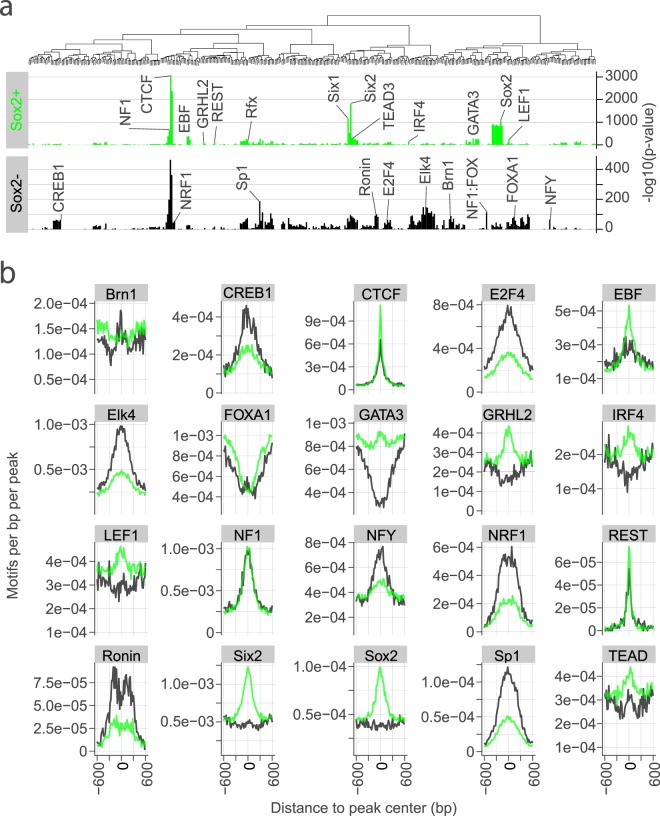
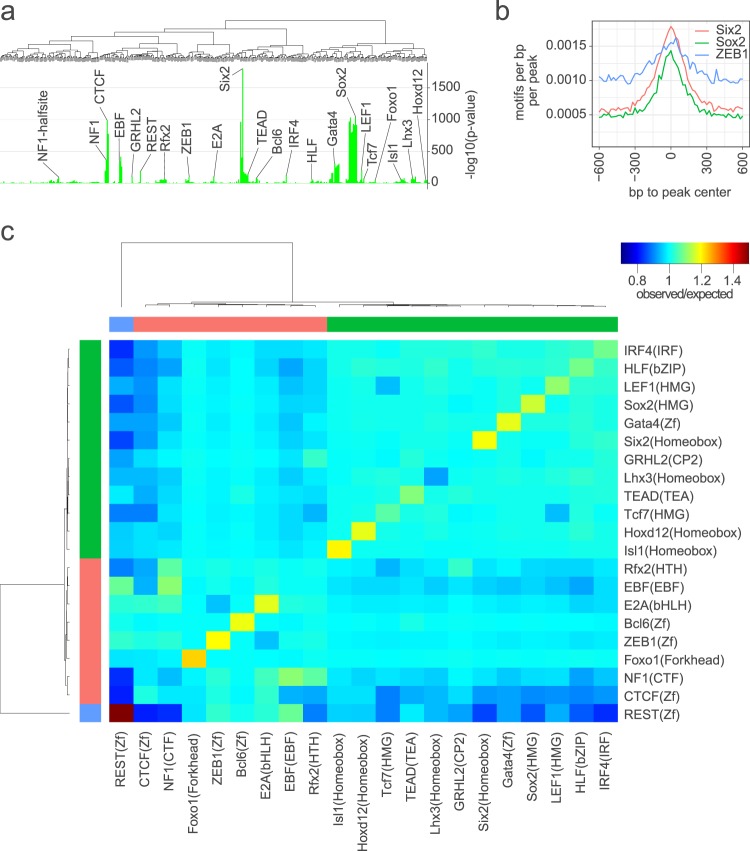
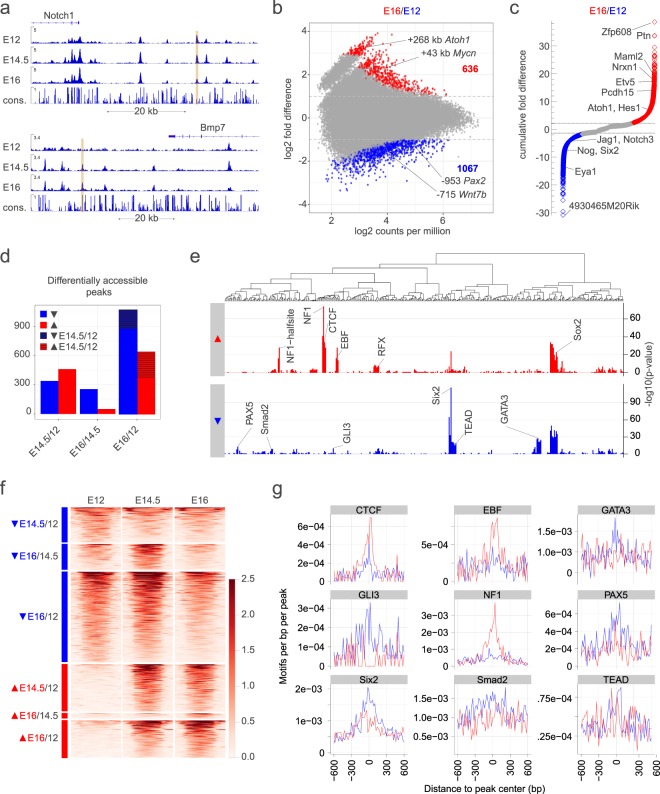
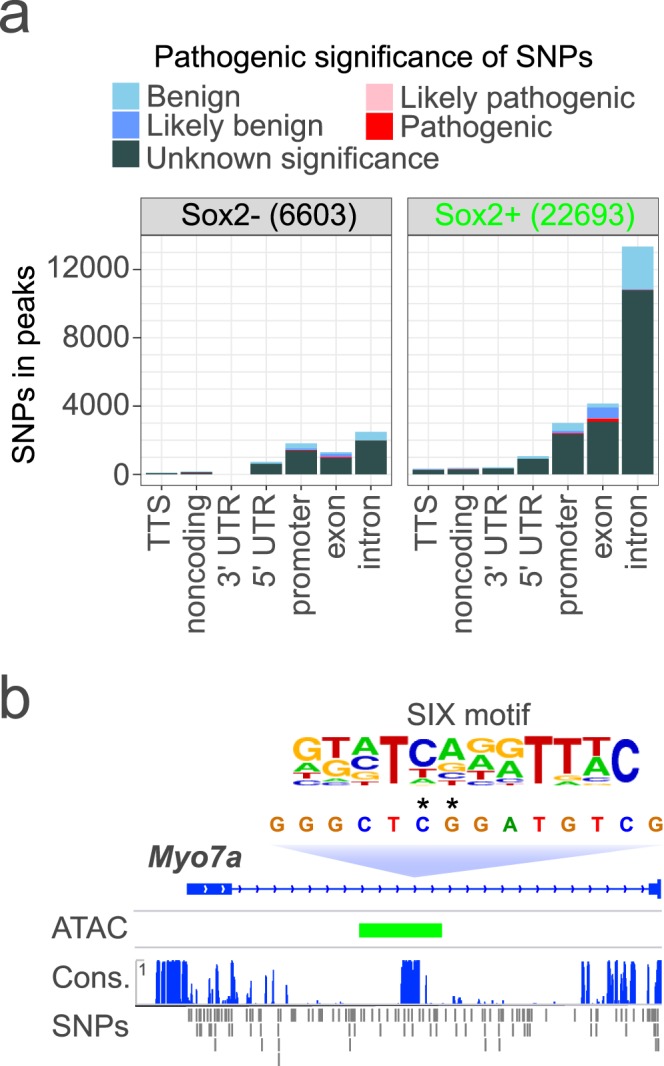
Hearing loss is often due to the absence or the degeneration of hair cells in the cochlea. Understanding the mechanisms regulating the generation of hair cells may therefore lead to better treatments for hearing disorders. To elucidate the transcriptional control mechanisms specifying the progenitor cells (i.e. prosensory cells) that generate the hair cells and support cells critical for hearing function, we compared chromatin accessibility using ATAC-seq in sorted prosensory cells (Sox2-EGFP+) and surrounding cells (Sox2-EGFP-) from E12, E14.5 and E16 cochlear ducts. In Sox2-EGFP+, we find greater accessibility in and near genes restricted in expression to the prosensory region of the cochlear duct including Sox2, Isl1, Eya1 and Pou4f3. Furthermore, we find significant enrichment for the consensus binding sites of Sox2, Six1 and Gata3-transcription factors required for prosensory development-in the open chromatin regions. Over 2,200 regions displayed differential accessibility with developmental time in Sox2-EGFP+ cells, with most changes in the E12-14.5 window. Open chromatin regions detected in Sox2-EGFP+ cells map to over 48,000 orthologous regions in the human genome that include regions in genes linked to deafness. Our results reveal a dynamic landscape of open chromatin in prosensory cells with potential implications for cochlear development and disease.


Conflict of interest statement

The authors declare no competing interests.

Figures

Figure 1
Figure 1
Sox2-EGFP expression in prosensory cells of the embryonic cochlea. (a) Shows the tissue isolation and FACS pipeline used to generate the cells. (bf) Show Sox2-EGFP expression (green) in vibratome sections of cochlea at the indicated stages of embryonic development. Sox2 immunofluorescence (magenta) demonstrates both the prosensory cells in the cochlear duct and the glia of the spiral ganglion. Note that Sox2-EGFP expression corresponds to Sox2 immunofluorescence and that Sox2-EGFP developmental dynamics mirror those of endogenous Sox2 expression. For example, the Sox2+/Sox2-EGFP+ field of cells in the floor of the cochlear duct narrows between E12.5-16.5—first at the base of the duct, then apically (compare b,d and f) and first at the lateral side of the duct, then medially (compare c, e and g). The localization of Sox2-EGFP expression shown here is representative of that in at least three temporal bones. Scale bars = 100 μm. sg, spiral ganglion; sa, saccule; ut, utricle.
Figure 2
Figure 2
ATAC-seq detects gene regulatory features that include known otic enhancers in Sox2-EGFPhigh+ cells of the embryonic cochlear duct. (a) Shows ATAC-seq signal in E16 Sox2-EGFPhigh+ cochlear cells relative to that in E16 Sox2-EGFP cochlear cells collected in parallel at the Sox2, Pou4f3, and Plp1 loci. Highlighted in pink are known enhancer regions. Highlighted in green are novel open chromatin regions detected only in Sox2-EGFPhigh+ cells of the embryonic cochlear duct. (b) Shows fold difference relative to the normalized read counts for ATAC-seq peaks determined to be significantly increased (red), significantly decreased (blue) or unchanged (grey) in Sox2-EGFPhigh+ cells from E12-16 cochlear duct versus Sox2-EGFP cells from E14.5-16 cochlear duct. (c) Shows the cumulative fold differences (i.e. the sum of the fold differences of all peaks nearest to each gene) in accessibility of each gene in Sox2-EGFPhigh+ cells from E12-16 cochlear duct versus Sox2-EGFP cells from E14.5-16 cochlear duct. In the highlighted genes, accessibility corresponds to known differential patterns of gene expression. (d) shows a clustered Spearman correlation matrix of the reads in peaks from ATAC-seq of FACS-sorted cochlear cells and of various E14.5 tissues. Note that reads in cochlear ATAC-seq samples are highly correlated. (e) Shows the frequency of ATAC-seq peaks relative to the distance to transcription start sites. (f) Shows the percentages of all replicated peaks detected in Sox2-EGFPhigh+ cells of the E12-16 cochlear duct mapping to the indicated genomic features. (g) Shows ATAC-seq signal at the Atoh1 locus in E16 Sox2-EGFPhigh+ cochlear cells aligned to that in E16 Sox2-EGFP cochlear cells collected in parallel; several other E14.5 tissues, and PhastCons 30-way vertebrate conservation. As an example of transcription factor binding motifs in peaks, we show those predicted in the +135 kb peak. Highlighted in pink is the known 3′ enhancer. Highlighted in green are 7 open chromatin regions specific to Sox2-EGFPhigh+ cells of the embryonic cochlear duct downstream of Atoh1. Highlighted in gold is a region that increased in accessibility in E14.5 vs. E12 Sox2-EGFPhigh+ cells of the embryonic cochlear duct. Transcription factor families having similar bindings motifs are color-coded. Highest scoring members of each family are indicated.
Figure 3
Figure 3
Motif enrichment in open chromatin regions in Sox2-EGFPhigh+ cells of the embryonic cochlear duct. (a) Plots qualitative differences in motif enrichment in Sox2-EGFPhigh+ cells from E12-16 cochlear duct and Sox2-EGFP cells from E14.5-16 cochlear duct as −log10 of the p-value in replicated peaks. Motifs are clustered based on similarity. The most highly enriched members of transcription factor families/clusters are selectively labeled based on differential enrichment in the samples. Differences in enrichment might be indicative of context-specific transcription factor activity. Scales in (a) vary due to differences in peak number and coverage. (b) Plots quantitative differences in enrichment of representative motifs as the frequency of motifs relative to peak center. Note that high enrichment (a) often corresponds to greater central localization in peaks (b).
Figure 4
Figure 4
Motif enrichment and co-occurrence in prosensory-specific open chromatin regions of the embryonic cochlear duct. (a) Shows the motif enrichment as -log10 of the p-value in the subset of replicated peaks detected only in Sox2-EGFPhigh+ cells from E12-16 cochlear duct (i.e., not detected in Sox2-EGFP- cells or other ENCODE datasets examined). (b) Plots quantitative differences in enrichment of representative motifs as the frequency of motifs relative to peak center. (c) Plots clustered matrix of the ratio of the observed frequency of co-occurrence of each combination of enriched motifs in the prosensory-specific peaks relative to the expected frequency of co-occurrence.
Figure 5
Figure 5
Developmentally-dynamic open chromatin in Sox2-EGFPhigh+ cells of the embryonic cochlear duct. (a) Shows examples of developmentally dynamic ATAC-seq peaks (gold) in Sox2-EGFPhigh+ cells of the E12-16 cochlear duct at the indicated loci. (b) Shows the fold difference relative to the normalized read counts for ATAC-seq peaks determined to be significantly increased (red), significantly decreased (blue) or unchanged (grey) in Sox2-EGFPhigh+ cells from E16 cochlear duct versus those from E12 cochlear duct. (c) Shows the cumulative fold differences (i.e. the sum of the fold differences of all peaks nearest to each gene) in accessibility of each gene in Sox2-EGFPhigh+ cells from E16 cochlear duct versus those from E12 cochlear duct. (d) Shows the numbers of differentially accessible peaks detected in Sox2-EGFPhigh+ cells at the indicated stages. Note that most significant changes were detected in the E12-14.5 window. (e) Shows differential motif enrichment in peaks increasing in accessibility in E12-16 Sox2-EGFPhigh+ cells from the cochlear duct relative to those decreasing in accessibility. (f) Plots normalized reads in the differentially accessible regions. (g) Plots the frequency of differentially enriched motifs relative to peak center.
Figure 6
Figure 6
Human deafness gene SNPs in orthologous regions to ATAC-seq peaks detected in Sox2-EGFPhigh+ cells of the embryonic cochlear duct. Numbers of SNPs in the Deafness Variation Database (DVD) overlapping regions orthologous to ATAC-seq peaks in the indicated genomic features are shown in (a). Colors indicate pathogenicity as classified in the DVD. In (b), asterisks indicate two SNPs of unknown significance in MYO7A intron 1 that potentially affect binding at a SIX motif in a region of high evolutionary conservation (Cons.) that is orthologous to an ATAC-seq peak (ATAC) detected in Myo7a in embryonic mouse Sox2-EGFPhigh+ cochlear duct cells.

Similar articles

Cited by

References

    1. Hudspeth AJ. Integrating the active process of hair cells with cochlear function. Nature Reviews Neuroscience. 2014;15:600. doi: 10.1038/nrn3786. - DOI - PubMed
    1. Morton CC, Nance WE. Newborn hearing screening–a silent revolution. N Engl J Med. 2006;354:2151–2164. doi: 10.1056/NEJMra050700. - DOI - PubMed
    1. Van Laer L, et al. The grainyhead like 2 gene (GRHL2), alias TFCP2L3, is associated with age-related hearing impairment. Hum Mol Genet. 2008;17:159–169. doi: 10.1093/hmg/ddm292. - DOI - PubMed
    1. Oonk AM, et al. Progressive hereditary hearing impairment caused by a MYO6 mutation resembles presbyacusis. Hear Res. 2013;299:88–98. doi: 10.1016/j.heares.2012.12.015. - DOI - PubMed
    1. Manche SK, Jangala M, Putta P, Koralla RM, Akka J. Association of oxidative stress gene polymorphisms with presbycusis. Gene. 2016;593:277–283. doi: 10.1016/j.gene.2016.08.029. - DOI - PubMed

Publication types

MeSH terms