Proximity proteomics identifies cancer cell membrane cis-molecular complex as a potential cancer target
- PMID: 31228215
- PMCID: PMC6676139
- DOI: 10.1111/cas.14108
Proximity proteomics identifies cancer cell membrane cis-molecular complex as a potential cancer target
Abstract
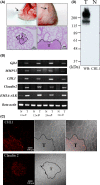
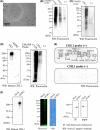
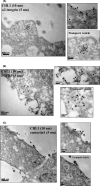
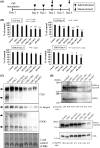
Cancer-specific antigens expressed in the cell membrane have been used as targets for several molecular targeted strategies in the last 20 years with remarkable success. To develop more effective cancer treatments, novel targets and strategies for targeted therapies are needed. Here, we examined the cancer cell membrane-resident "cis-bimolecular complex" as a possible cancer target (cis-bimolecular cancer target: BiCAT) using proximity proteomics, a technique that has attracted attention in the last 10 years. BiCAT were detected using a previously developed method termed the enzyme-mediated activation of radical source (EMARS), to label the components proximal to a given cell membrane molecule. EMARS analysis identified some BiCAT, such as close homolog of L1 (CHL1), fibroblast growth factor 3 (FGFR3) and α2 integrin, which are commonly expressed in mouse primary lung cancer cells and human lung squamous cell carcinoma cells. Analysis of cancer specimens from 55 lung cancer patients revealed that CHL1 and α2 integrin were highly co-expressed in almost all cancer tissues compared with normal lung tissues. As an example of BiCAT application, in vitro simulation of effective drug combinations used for multiple drug treatment strategies was performed using reagents targeted to BiCAT molecules. The combination treatment based on BiCAT information moderately suppressed cancer cell proliferation compared with single administration, suggesting that the information about BiCAT in cancer cells is useful for the appropriate selection of the combination among molecular targeted reagents. Thus, BiCAT has the potential to contribute to several molecular targeted strategies in future.
Keywords: cancer therapy; lipid raft; lung cancer; membrane protein; protein-protein interaction.
© 2019 The Authors. Cancer Science published by John Wiley & Sons Australia, Ltd on behalf of Japanese Cancer Association.
Figures


Similar articles
-
Identification of cell-surface molecular interactions under living conditions by using the enzyme-mediated activation of radical sources (EMARS) method.Sensors (Basel). 2012 Nov 22;12(12):16037-45. doi: 10.3390/s121216037. Sensors (Basel). 2012. PMID: 23443365 Free PMC article.
-
Integrative Analysis of Subcellular Quantitative Proteomics Studies Reveals Functional Cytoskeleton Membrane-Lipid Raft Interactions in Cancer.J Proteome Res. 2016 Oct 7;15(10):3451-3462. doi: 10.1021/acs.jproteome.5b01035. Epub 2016 Sep 2. J Proteome Res. 2016. PMID: 27384440
-
Tumor-dependent secretion of close homolog of L1 results in elevation of its circulating level in mouse model for human lung tumor.Biochem Biophys Res Commun. 2018 Jul 2;501(4):982-987. doi: 10.1016/j.bbrc.2018.05.096. Epub 2018 May 22. Biochem Biophys Res Commun. 2018. PMID: 29775614
-
Analysis of lipid raft molecules in the living brain slices.Neurochem Int. 2018 Oct;119:140-150. doi: 10.1016/j.neuint.2017.08.012. Epub 2017 Aug 24. Neurochem Int. 2018. PMID: 28844489
-
Enzyme-mediated activation of radical sources (EMARS)-based molecular interaction analysis.2021 Aug 11 [updated 2022 Mar 28]. In: Nishihara S, Angata K, Aoki-Kinoshita KF, Hirabayashi J, editors. Glycoscience Protocols (GlycoPODv2) [Internet]. Saitama (JP): Japan Consortium for Glycobiology and Glycotechnology; 2021–. 2021 Aug 11 [updated 2022 Mar 28]. In: Nishihara S, Angata K, Aoki-Kinoshita KF, Hirabayashi J, editors. Glycoscience Protocols (GlycoPODv2) [Internet]. Saitama (JP): Japan Consortium for Glycobiology and Glycotechnology; 2021–. PMID: 37590745 Free Books & Documents. Review. No abstract available.
Cited by
-
Proximity extracellular protein-protein interaction analysis of EGFR using AirID-conjugated fragment of antigen binding.Nat Commun. 2023 Dec 14;14(1):8301. doi: 10.1038/s41467-023-43931-7. Nat Commun. 2023. PMID: 38097606 Free PMC article.
-
Construction and validation of an EGFR-related risk signature identified SHC1 as a prognostic biomarker for lung adenocarcinoma.Transl Cancer Res. 2025 Jul 30;14(7):4331-4347. doi: 10.21037/tcr-24-1812. Epub 2025 Jul 14. Transl Cancer Res. 2025. PMID: 40792150 Free PMC article.
References
-
- Terstappen GC, Schlüpen C, Raggiaschi R, Gaviraghi G. Target deconvolution strategies in drug discovery. Nat Rev Drug Discov. 2007;6:891‐903. - PubMed
-
- Rajendran L, Knölker H‐J, Simons K. Subcellular targeting strategies for drug design and delivery. Nat Rev Drug Discov. 2010;9:29‐42. - PubMed
-
- Goldenberg DM, Sharkey RM, Paganelli G, Barbet J, Chatal J‐F. Antibody pretargeting advances cancer radioimmunodetection and radioimmunotherapy. J Clin Oncol. 2006;24:823‐834. - PubMed
MeSH terms
Substances
Grants and funding
LinkOut - more resources
Full Text Sources
Medical
Molecular Biology Databases
Research Materials
Miscellaneous

