. 2019 Oct;37(10):2122-2129.
doi: 10.1002/jor.24396. Epub 2019 Jul 26.

Sexually Dimorphic Influence of Neonatal Antibiotics on Bone

Affiliations

Sexually Dimorphic Influence of Neonatal Antibiotics on Bone

Matteo M Pusceddu et al. J Orthop Res. 2019 Oct.

Abstract

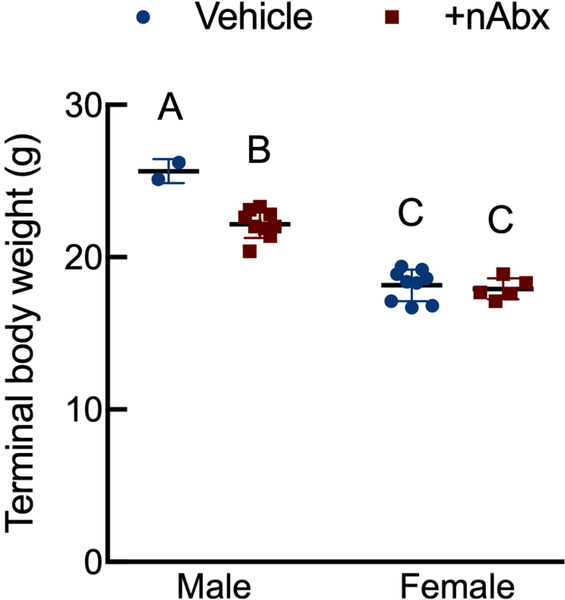
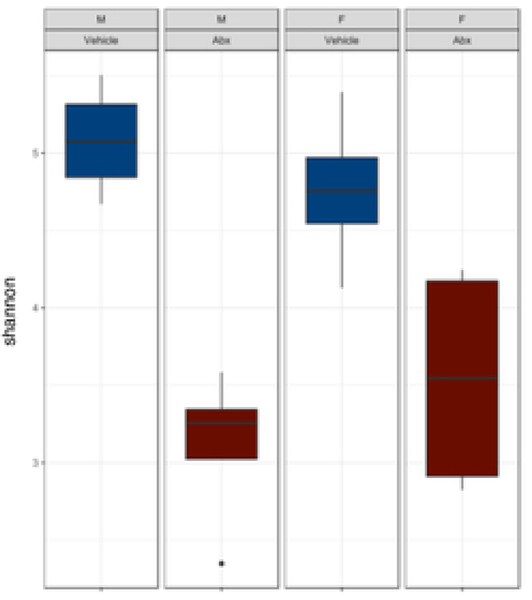
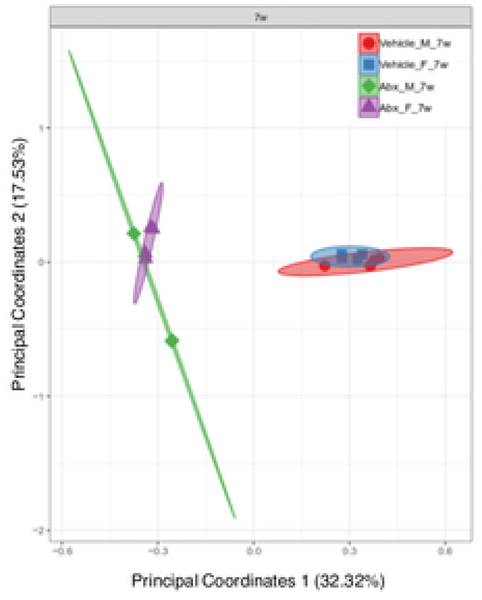
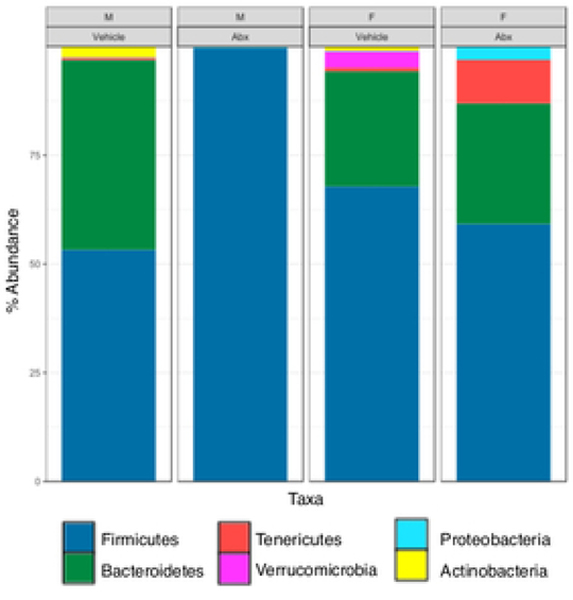
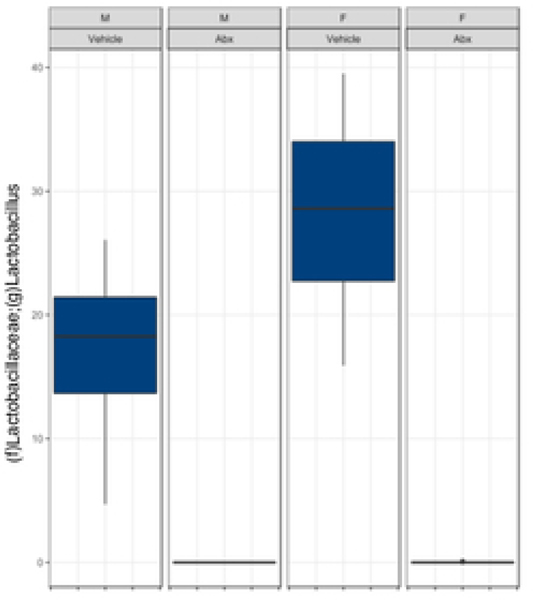
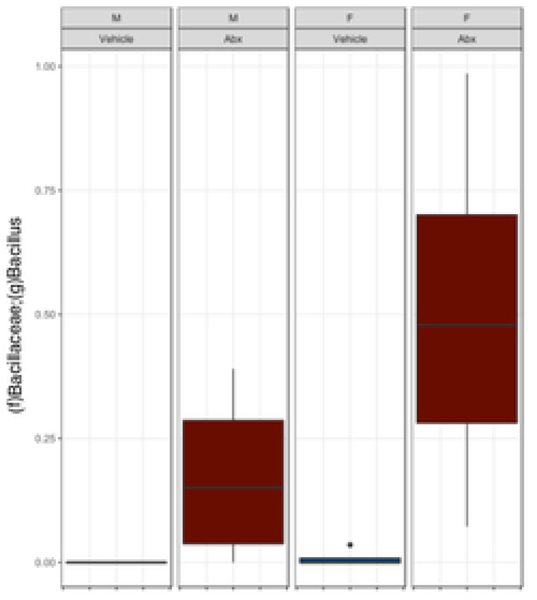
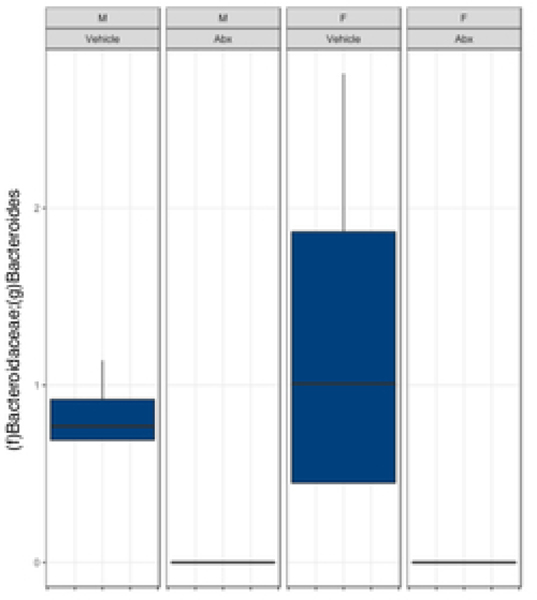
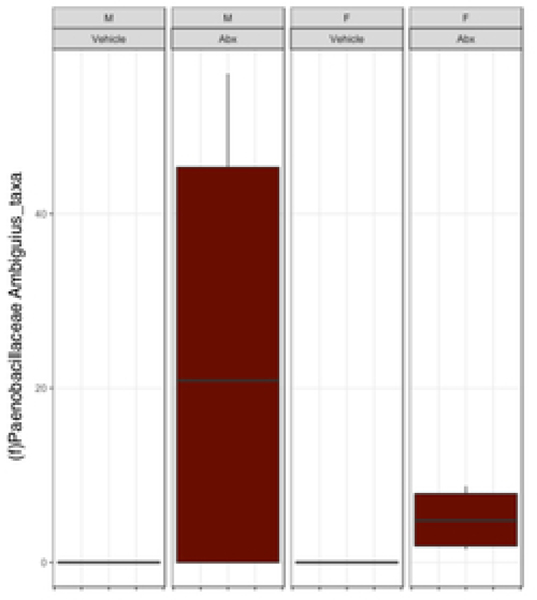
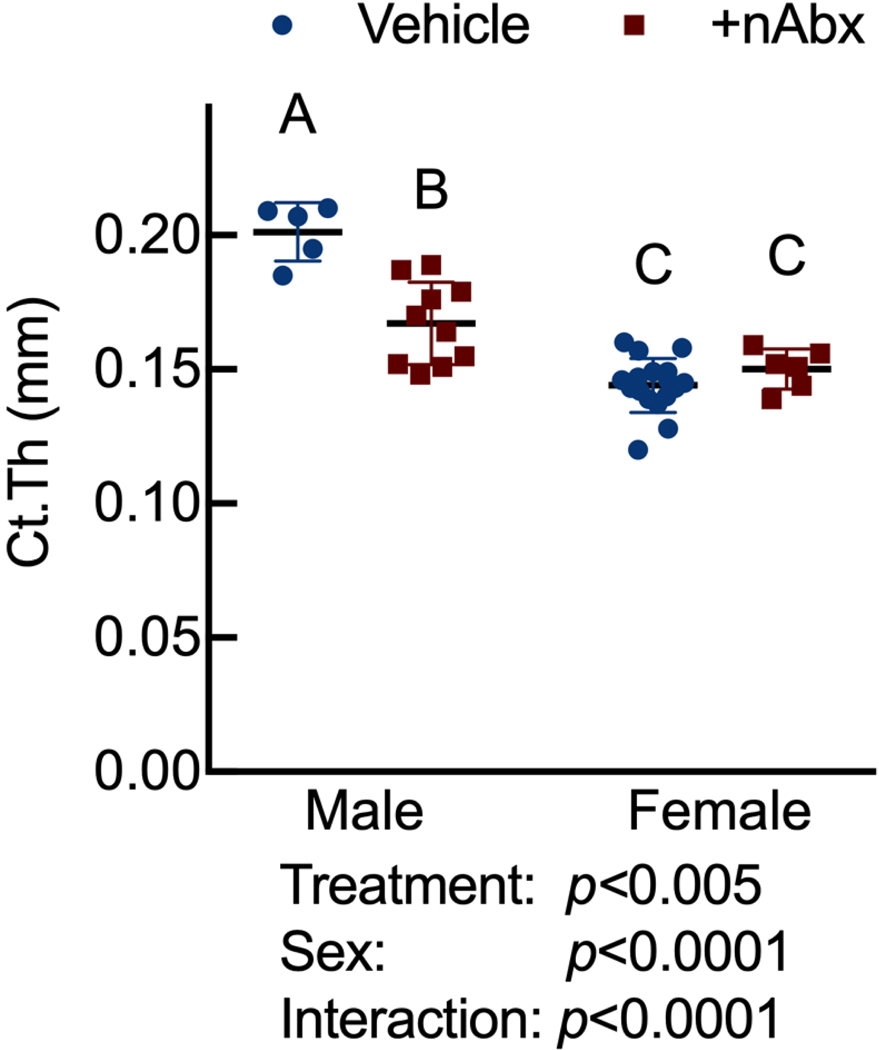
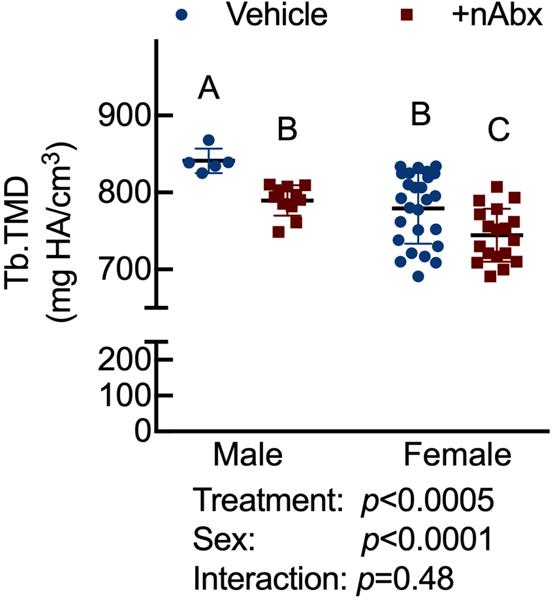
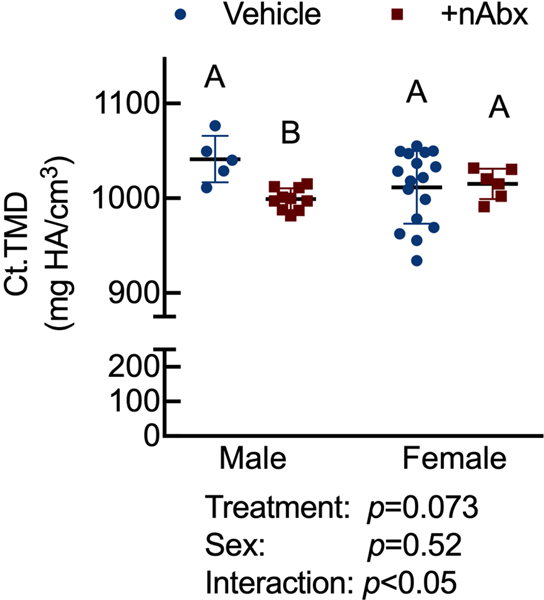
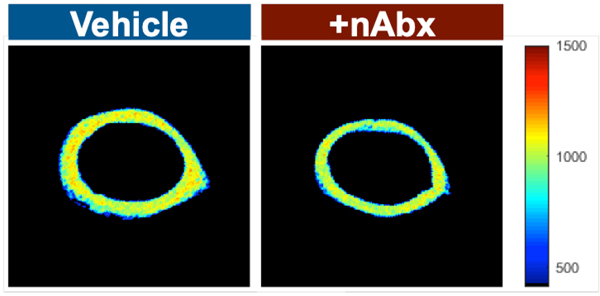
The gut microbiome (GM) contributes to host development, metabolism, and disease. Perturbations in GM composition, elicited through chronic administration of oral antibiotics (Abx) or studied using germ-free environments, alter bone mass, and microarchitecture. However, studies primarily involved chronic Abx exposure to adult mice prior to evaluating the skeletal phenotype. Children are more prone to infection with bacterial pathogens than adults and are thus treated more frequently with broad-spectrum Abx; consequently, Abx treatment disproportionately occurs during periods of greatest skeletal plasticity to anabolic cues. Because early-life exposures may exert long-lasting effects on adult health, we hypothesized that acute Abx administration during a developmentally sensitive period would elicit lasting effects on the skeletal phenotype. To test this hypothesis, neonatal mice were treated with Abx (P7-P23; oral gavage) or vehicle (water); GM composition, gut physiology, and bone structural and material properties were assessed in adulthood (8 weeks). We found sexually dimorphic effects of neonatal Abx administration on GM composition, gut barrier permeability, and the skeleton, indicating a negative role for neonatal Abx on bone mass and quality. © 2019 Orthopaedic Research Society. Published by Wiley Periodicals, Inc. J Orthop Res 37:2122-2129, 2019.

Keywords: antibiotics; bone; gut microbiota; intestinal barrier.


Figures

Figure 1.
Figure 1.. Neonatal Abx influence on terminal body weight and gut microbiota composition.
(A) Sexually-dimorphic effects of neonatal Abx on terminal body weight; n= 2–9 male or 5–9 female mice per condition. (B) Shannon measure of alpha diversity, (C) Bray-Curtis measure of β-diversity, (D) Phylum level abundances and, (E) relative abundance of selected genera; n= 4 male or 4 female mice per condition. Columns represent mean ± standard deviation; groups with different letters are statistically different from each other.
Figure 2.
Figure 2.. Neonatal Abx increase colonic permeability without causing colonic inflammation.
(A) Baseline short-circuit current (Isc, [μA/cm2]), (B) forskolin (FSK)-induced increases in Isc (ΔIsc), or (C) conductance (G, mS/cm2) were evaluated in segments of proximal colon. Activation of NF-κB signaling (D) IkbA or pro-inflammatory cytokine (E) Il10 or (F) Tnfa expression in colons from male or female mice neonatally gavaged with water or Abx. Columns represent mean ± standard error of the mean; n=7–8 mice per sex per condition. Groups with different letters are statistically different from each other.
Figure 3.
Figure 3.. Disturbed cortical and trabecular bone architecture in mice receiving acute neonatal Abx.
(A) Representative distal femur secondary spongiosa of male and female mice gavaged with water or neonatal Abx from p7 to p23 and euthanized at 8 weeks. (B) microCT-derived trabecular bone volume fraction (Tb.BV/TV) in distal femur secondary spongiosa; n=5–11 male or 18–27 female mice per condition. (C) microCT-derived midshaft femur cortical thickness (Ct.Th); n=5–10 male or 6–18 female mice per condition. Columns represent mean ± standard deviation; groups with different letters are statistically different from each other.
Figure 4.
Figure 4.. Influence of neonatal Abx on bone tissue material properties.
(A) Tissue mineral density in distal femur secondary spongiosa; n=5–11 male or 18–26 female mice per condition. (B) Tissue mineral density in midshaft femur; n=5–10 male or 6–17 female mice per condition. (C) Hydroxyapatite-calibrated heatmap of tissue mineral density distribution in mid-diaphyseal cortical bone from male and female mice gavaged with water or neonatal Abx. (D) Histograms of mid-diaphyseal TMDD quantification. (i) Diagrammatic representation of CaPEAK, CaMEAN, and CaWIDTH; TMDD in (ii) male and (iii) female mice. Columns represent mean ± standard deviation; groups with different letters are statistically different from each other.

References

    1. Gensollen T, Iyer SS, Kasper DL, Blumberg RS. 2016. How colonization by microbiota in early life shapes the immune system.Science 352(6285):539–544. - PMC - PubMed
    1. Belkaid Y, Hand TW. 2014. Role of the microbiota in immunity and inflammation.Cell 157(1):121–141. - PMC - PubMed
    1. Pusceddu MM, Murray K, Gareau MG. 2018. Targeting the Microbiota, from Irritable Bowel Syndrome to Mood Disorders: Focus on Probiotics and Prebiotics.Curr Pathobiol Rep 6(1):1–13. - PMC - PubMed
    1. Sjögren K, Engdahl C, Henning P, et al. 2012. The gut microbiota regulates bone mass in mice.J Bone Miner Res 27(6):1357–1367. - PMC - PubMed
    1. Yan J, Herzog JW, Tsang K, et al. 2016. Gut microbiota induce IGF-1 and promote bone formation and growth.Proc Natl Acad Sci USA. - PMC - PubMed

Publication types