

Mapping the global prevalence, incidence, and mortality of Plasmodium falciparum, 2000-17: a spatial and temporal modelling study
- PMID: 31229234
- PMCID: PMC6675740
- DOI: 10.1016/S0140-6736(19)31097-9
Mapping the global prevalence, incidence, and mortality of Plasmodium falciparum, 2000-17: a spatial and temporal modelling study
Abstract
Background: Since 2000, the scale-up of malaria control interventions has substantially reduced morbidity and mortality caused by the disease globally, fuelling bold aims for disease elimination. In tandem with increased availability of geospatially resolved data, malaria control programmes increasingly use high-resolution maps to characterise spatially heterogeneous patterns of disease risk and thus efficiently target areas of high burden.
Methods: We updated and refined the Plasmodium falciparum parasite rate and clinical incidence models for sub-Saharan Africa, which rely on cross-sectional survey data for parasite rate and intervention coverage. For malaria endemic countries outside of sub-Saharan Africa, we produced estimates of parasite rate and incidence by applying an ecological downscaling approach to malaria incidence data acquired via routine surveillance. Mortality estimates were derived by linking incidence to systematically derived vital registration and verbal autopsy data. Informed by high-resolution covariate surfaces, we estimated P falciparum parasite rate, clinical incidence, and mortality at national, subnational, and 5 × 5 km pixel scales with corresponding uncertainty metrics.
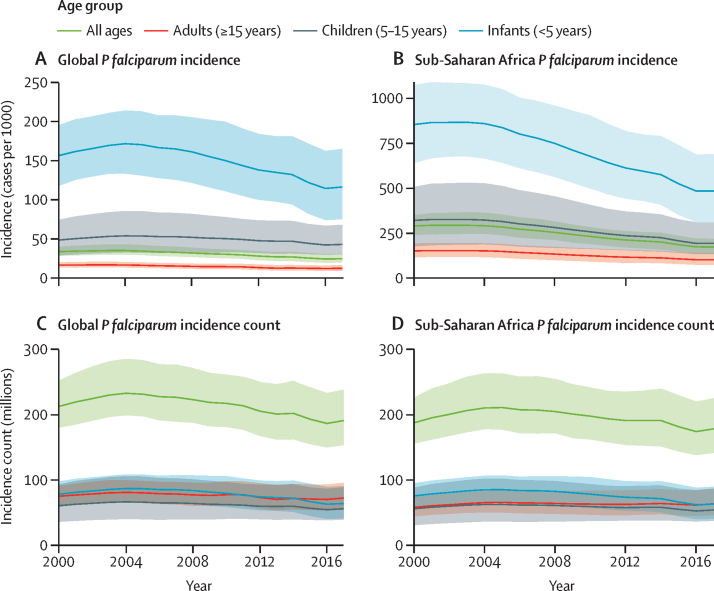
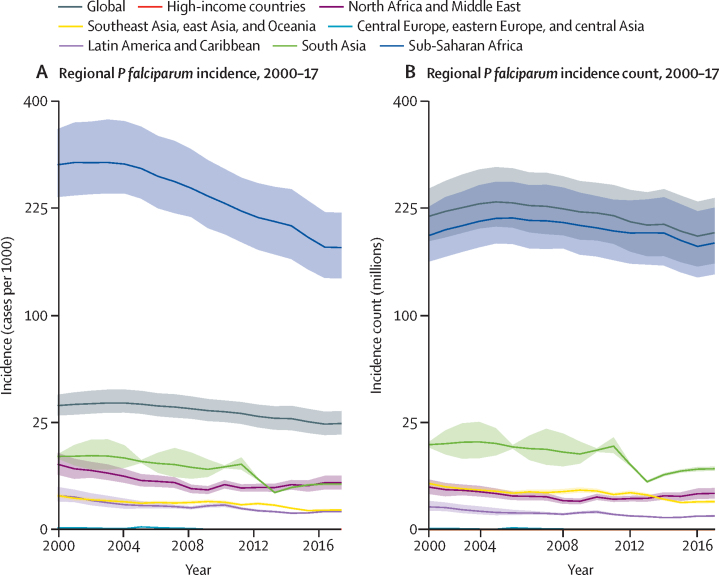
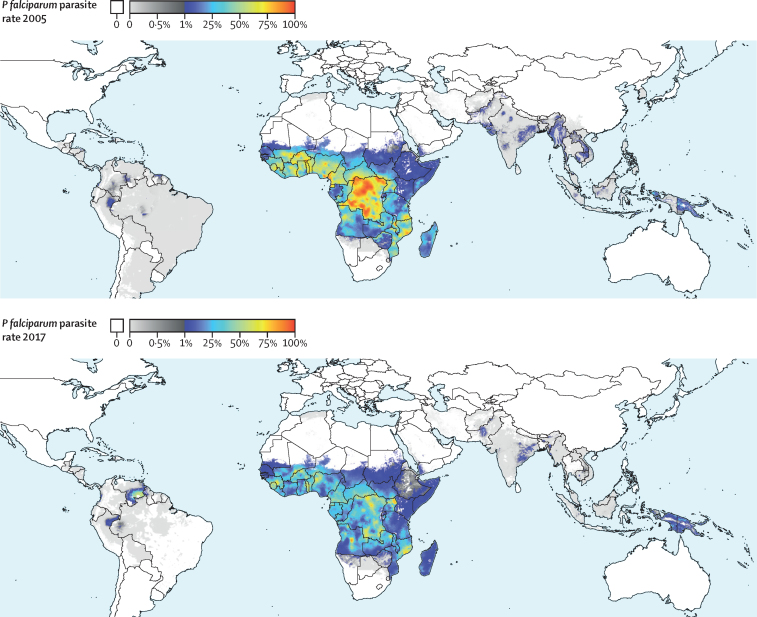
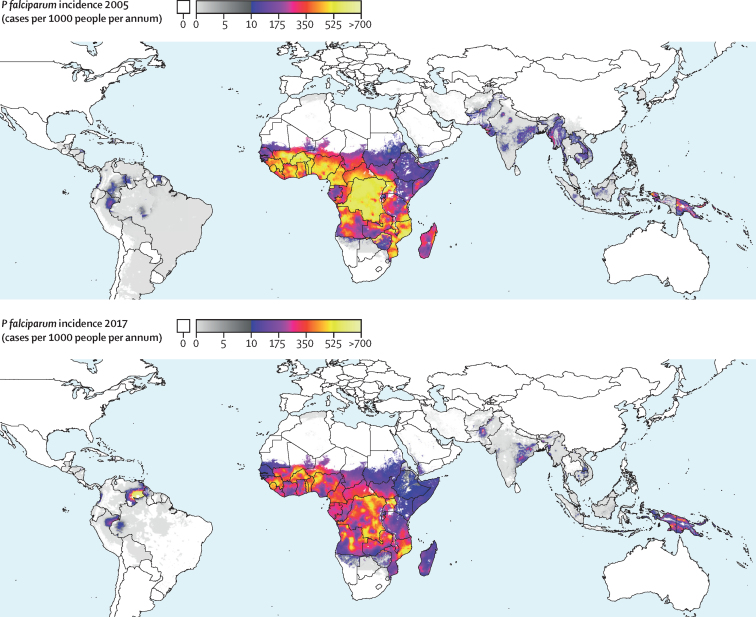
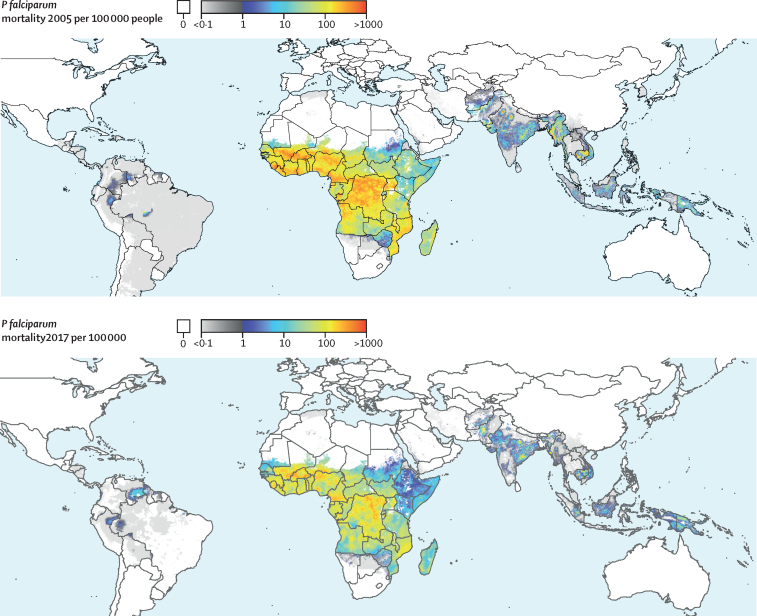
Findings: We present the first global, high-resolution map of P falciparum malaria mortality and the first global prevalence and incidence maps since 2010. These results are combined with those for Plasmodium vivax (published separately) to form the malaria estimates for the Global Burden of Disease 2017 study. The P falciparum estimates span the period 2000-17, and illustrate the rapid decline in burden between 2005 and 2017, with incidence declining by 27·9% and mortality declining by 42·5%. Despite a growing population in endemic regions, P falciparum cases declined between 2005 and 2017, from 232·3 million (95% uncertainty interval 198·8-277·7) to 193·9 million (156·6-240·2) and deaths declined from 925 800 (596 900-1 341 100) to 618 700 (368 600-952 200). Despite the declines in burden, 90·1% of people within sub-Saharan Africa continue to reside in endemic areas, and this region accounted for 79·4% of cases and 87·6% of deaths in 2017.
Interpretation: High-resolution maps of P falciparum provide a contemporary resource for informing global policy and malaria control planning, programme implementation, and monitoring initiatives. Amid progress in reducing global malaria burden, areas where incidence trends have plateaued or increased in the past 5 years underscore the fragility of hard-won gains against malaria. Efforts towards elimination should be strengthened in such areas, and those where burden remained high throughout the study period.
Funding: Bill & Melinda Gates Foundation.
Copyright © 2019 The Authors. Published by Elsevier Ltd. This is an Open Access article under the CC BY 4.0 license. Published by Elsevier Ltd.. All rights reserved.
Figures
Comment in
-
New malaria maps.Lancet. 2019 Jul 27;394(10195):278-279. doi: 10.1016/S0140-6736(19)31273-5. Epub 2019 Jun 19. Lancet. 2019. PMID: 31229232 No abstract available.
-
The invisible burden of malaria-attributable stillbirths.Lancet. 2020 Jan 25;395(10220):268. doi: 10.1016/S0140-6736(19)33011-9. Lancet. 2020. PMID: 31982063 No abstract available.
References
-
- WHO World Malaria Report 2017. WHO Global Malaria Programme. 2018. https://www.who.int/malaria/publications/world-malaria-report-2018/en/
Publication types
MeSH terms
Grants and funding
LinkOut - more resources
Full Text Sources
Miscellaneous
