. 2019 Jun 28:16:453-467.
doi: 10.1016/j.isci.2019.06.001. Epub 2019 Jun 8.

Anaplastic Lymphoma Kinase Confers Resistance to BRAF Kinase Inhibitors in Melanoma

Affiliations

Anaplastic Lymphoma Kinase Confers Resistance to BRAF Kinase Inhibitors in Melanoma

Radoslav Janostiak et al. iScience. .

Abstract

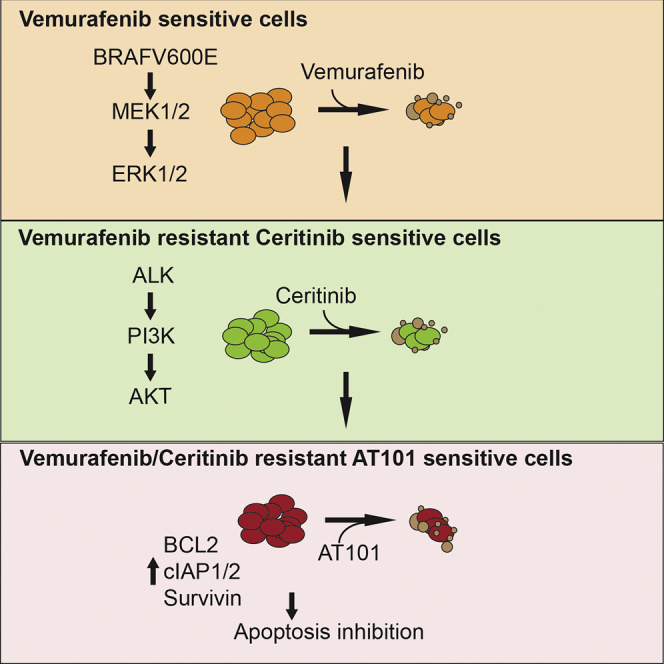
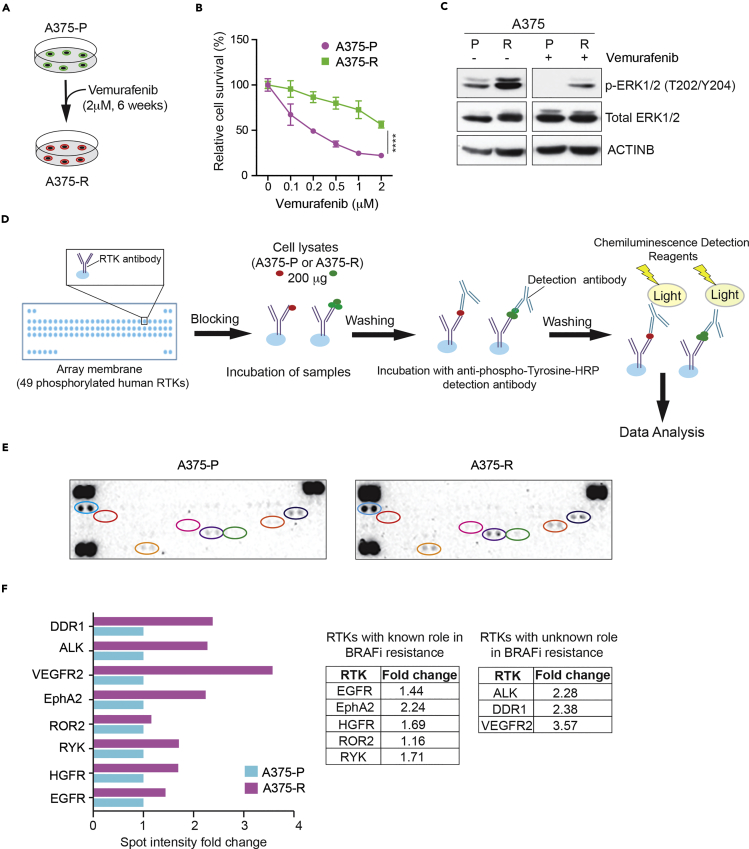
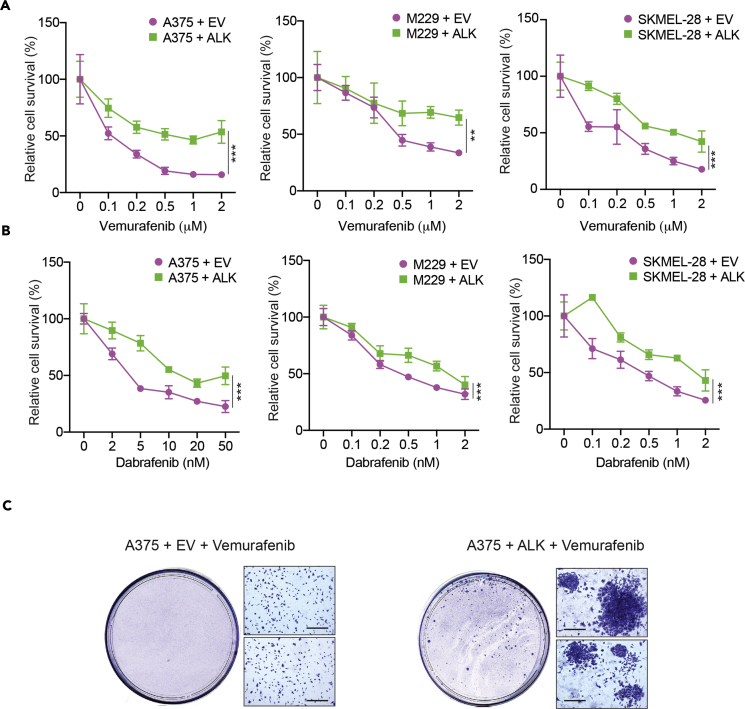
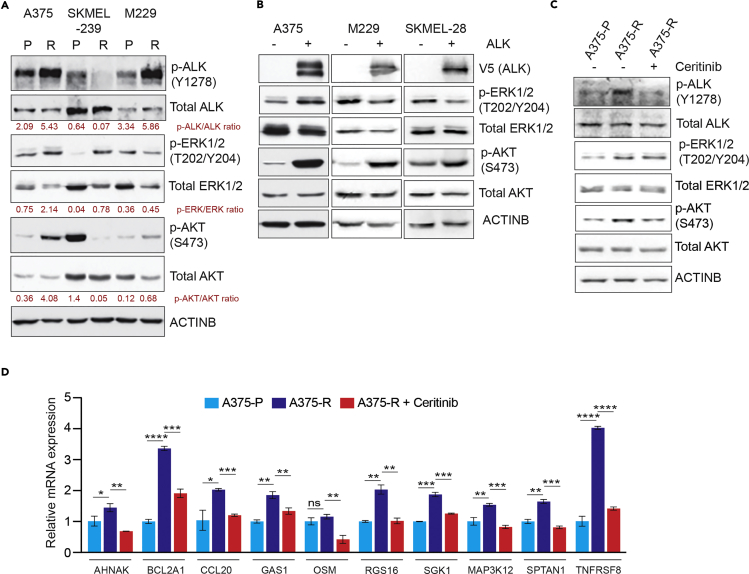
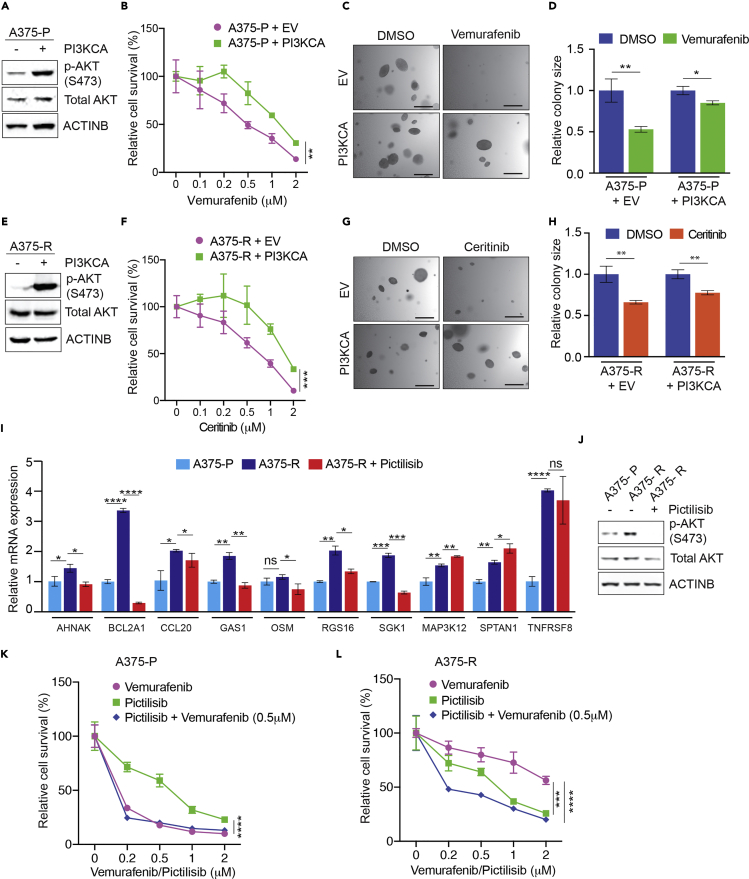
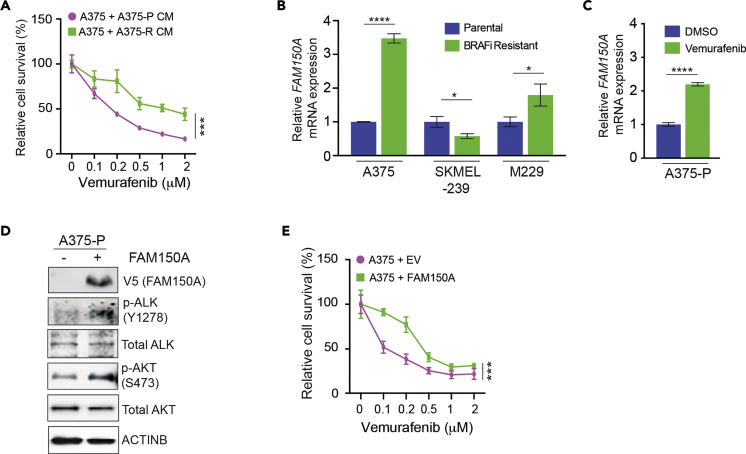
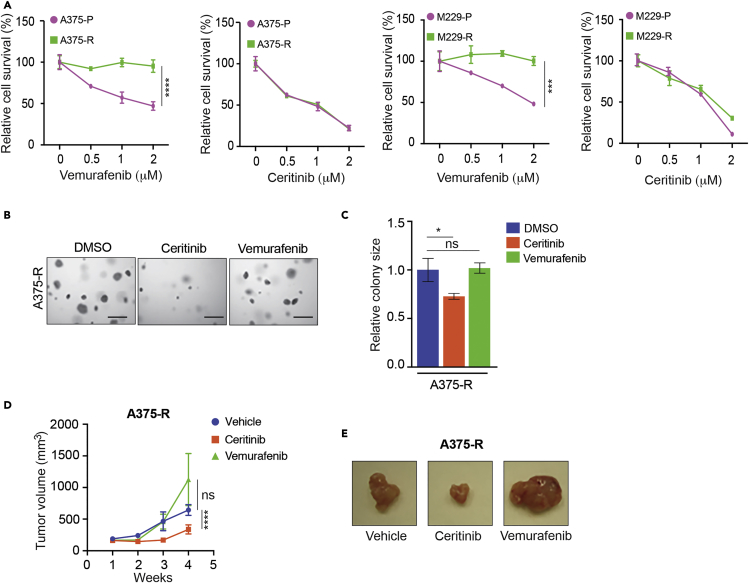
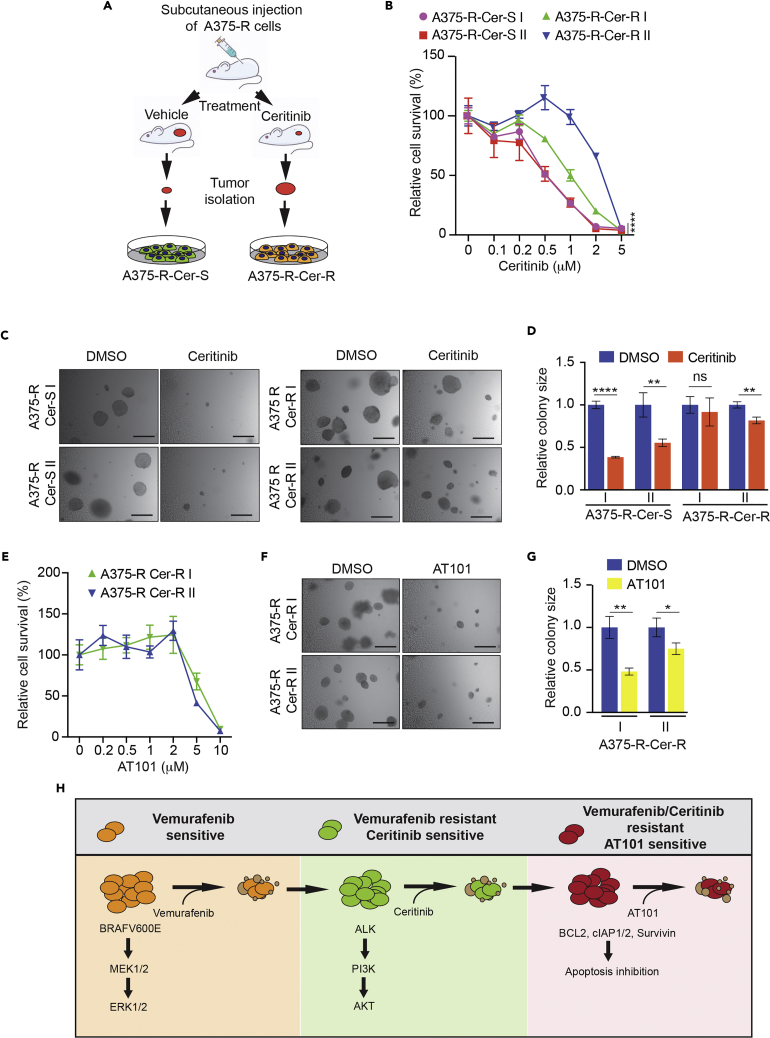
Melanoma frequently harbors oncogenic mutations in the BRAF gene, which drives melanoma growth. Therefore, BRAF kinase inhibitors (BRAFi) are developed and approved for treating BRAF-mutant melanoma. However, the efficacy of BRAFi is limited due to acquired resistance, and in over 40% of melanoma, the causes of BRAFi resistance remain unknown. Here, using a human phospho-receptor tyrosine kinase array we identified Anaplastic Lymphoma Kinase (ALK) as a driver of acquired BRAFi resistance in melanoma. We found that ALK ligand FAM150A was necessary for ALK activation and ALK via the PI3K/AKT pathway was sufficient to confer resistance to BRAFi. ALK inhibitor (ALKi) ceritinib inhibited BRAFi-resistant melanoma in cell culture and mice. Residual BRAFi and ALKi dual resistant melanoma cells from ceritinib-treated mice were sensitive to a broad-spectrum anti-apoptotic protein inhibitor, AT101. Collectively, our results provide a framework for treating BRAF-mutant melanoma that sequentially uses different targeted therapies based on post-treatment tumor evolution.

Keywords: Biological Sciences; Cancer; Cell Biology; Functional Aspects of Cell Biology.


Figures

None
Graphical abstract
Figure 1
Figure 1
Human Phospho-RTK Arrays Identified Changes in RTK Phosphorylation in BRAF Inhibitor Vemurafenib-Resistant Cells (A) Schematic representation of the generation of vemurafenib-resistant A375 melanoma cells. (B) A375 parental (A375-P) and A375 vemurafenib-resistant (A375-R) melanoma cells were treated with DMSO or the indicated concentrations of vemurafenib for 72 h and analyzed for survival using the MTT assay. Relative survival (%) for A375-P and A375-R cells relative to DMSO treated cells (0) is shown. (C) Indicated proteins were analyzed in A375-P and A375-R cells after 6 h treatment with DMSO or 1 μM vemurafenib. ACTINB was used as the loading control. (D) Schematic representation of the steps for analyzing A375-P and A375-R protein lysates using Proteome Profiler Human Phospho-RTK Array. (E) Proteome Profiler Human Phospho-RTK Array membranes showing relative RTK phosphorylation in A375-R cells and A375-P cells. (F) Spot intensity fold changes are plotted for individual RTK phosphorylation changes normalized to control spot in A375-R cells relative to A375-P cells as bar chart (left) or as numbers in the table on right. Data are presented as mean ± SD. ****p < 0.0001.
Figure 2
Figure 2
Ectopic Expression of Anaplastic Lymphoma Kinase (ALK) in Melanoma Conferred Resistance to BRAF Inhibitor (A) BRAF-mutant melanoma cells A375, M229, and SKMEL-28 ectopically expressing an empty vector (EV) or ALK expression construct were treated with either DMSO or the indicated concentrations of vemurafenib. Relative cell survival (%) for each cell line in reference to DMSO-treated cells is shown. (B) BRAF-mutant melanoma cells A375, M229, and SKMEL-28 ectopically expressing an empty vector (EV) or ALK were treated with either DMSO or the indicated concentrations of dabrafenib. Relative cell survival (%) for each cell line in reference to DMSO-treated cells is shown. (C) A375 cells ectopically expressing empty vector (EV) or ALK expression construct were treated with 2 μM vemurafenib for 4 weeks. Images of representative plates with surviving colonies are shown. Scale bar, 200 μM. Data are presented as mean ± SD. **p < 0.01, ***p < 0.001. See also Figure S1.
Figure 3
Figure 3
Ectopic Expression of ALK Stimulated the PI3K/AKT Pathway and BRAFi-Resistant Melanoma Showed Genetic Signatures Consistent with ALK Activation (A) Parental and BRAF inhibitor (BRAFi)-resistant A375, SKMEL-239, and M229 cells were analyzed for the indicated protein by immunoblotting. ACTINB was used as the loading control. (B) A375, M229, and SKMEL-28 cells ectopically expressing an empty vector or ALK were analyzed by western blot for the indicated proteins. ACTINB was used as the loading control. (C) A375 parental (A375-P) cells, A375 BRAFi-resistant cells (A375-R), and A375-R cells treated with ceritinib (1 μM) for 24 h were analyzed by immunoblotting for the indicated proteins. ACTINB was used as the loading control. (D) mRNA expression for the indicated ALK-activated genes was measured in A375-P, A375-R, and A375-R cells treated with ceritinib (1 μM) for 24 h. mRNA expression for indicated genes relative to A375-P cells is shown. ACTINB mRNA expression was used for normalization. Data are presented as mean ± SD. ns, not significant; *p < 0.05, **p < 0.01, ***p < 0.001, ****p < 0.0001, respectively. See also Figures S2 and S3.
Figure 4
Figure 4
ALK-Mediated BRAFi-Resistance by Activating the PI3K/AKT Pathway (A) A375 cells ectopically expressing either an empty vector or constitutively active PI3K (PI3KCA) were analyzed for the indicated proteins by immunoblotting. ACTINB was used as a loading control. (B) A375 cells ectopically expressing either an empty vector or constitutively active PI3K (PI3KCA) were treated with DMSO or with the indicated concentrations of vemurafenib and analyzed for survival using the MTT assay and for anchorage-independent growth using the soft-agar assay. Relative cell survival (%) in reference to DMSO-treated cells is shown. (C) A375 cells ectopically expressing either an empty vector (EV) or constitutively active PI3K (PI3KCA) were treated with DMSO or vemurafenib (1 μM). Representative images for soft-agar colonies under the indicated conditions are shown. Scale bar, 500 μm. (D) Relative soft-agar colony size (%) for experiments is presented in panel (C). (E) A375 cells ectopically expressing either an empty vector or constitutively active PI3K (PI3KCA) were analyzed for indicated proteins using immunoblotting. ACTINB was used as a loading control. (F) A375 cells ectopically expressing either an empty vector or constitutively active PI3K (PI3KCA) were treated with DMSO or with the indicated concentrations of ceritinib and analyzed for survival using the MTT assay and for anchorage-independent growth using the soft-agar assay. Relative cell survival (%) in reference to DMSO-treated cells is shown. (G) A375 cells ectopically expressing either an empty vector (EV) or constitutively active PI3K (PI3KCA) were treated with DMSO or ceritinib (1 μM). Representative images for soft-agar colonies under the indicated conditions are shown. Scale bar, 500 μm. (H) Relative soft-agar colony size in experiments is presented in panel (G). (I) mRNA expression for the indicated ALK-activated genes was measured in A375 parental (A375-P), A375 vemurafenib-resistant (A375-R), and A375-R cells treated PI3K inhibitor pictilisib (1 μM) for 24 h. mRNA expression is shown relative to A375-P cells. ACTINB mRNA expression was used for normalization. (J) A375-P, A375-R, and A375-R cells treated with pictilisib (1 μM) for 24 h were analyzed by immunoblotting for the indicated proteins. ACTINB was used as the loading control. (K) A375-P cells were treated with the indicated concentrations of vemurafenib, pictilisib, or both for 3 days and analyzed for survival using the MTT assay. Relative cell survival (%) relative to DMSO-treated cells is shown. (L) A375-R cells were treated with the indicated concentrations of vemurafenib, pictilisib, or both for 3 days and analyzed for survival using the MTT assay. Relative cell survival (%) relative to DMSO (0)-treated cells is shown. Data are presented as mean ± SD. ns, not significant p value; *p < 0.05, **p < 0.01, ***p < 0.001, and ****p < 0.0001, respectively. See also Figure S3.
Figure 5
Figure 5
FAM150A-Activated ALK Phosphorylation in Melanoma Cells and Stimulated BRAFi Resistance (A) A375 parental cells were cultured with conditioned medium harvested from A375 parental (A375-P CM) or vemurafenib-resistant A375 cells (A375-R CM), then treated with DMSO or the indicated concentrations of vemurafenib for 3 days, and analyzed for survival using the MTT assay. Relative cell survival (%) relative to DMSO-treated cells is shown. (B) mRNA expression for FAM150A was measured for the indicated pairs of parental and BRAFi-resistant cells (A375, SKMEL-239, M229). mRNA expression is shown relative to respective parental melanoma cells. ACTINB mRNA expression was used for normalization. (C) mRNA expression for FAM150A was measured in A375 cells treated with DMSO or vemurafenib (1 μM) for 24 h FAM150A mRNA expression relative to DMSO-treated A375 cells is shown. ACTINB mRNA expression was used for normalization. (D) A375 cells overexpressing empty vector (−) or FAM150A (+) were analyzed for indicated proteins by immunoblotting. ACTINB was used as a loading control. (E) A375 cells ectopically expressing an empty vector (EV) or FAM150A were treated with DMSO or the indicated concentrations of vemurafenib for 3 days and analyzed for survival by the MTT assay. Relative cell survival (%) relative to DMSO-treated cells is shown. Data are presented as mean ± SD. *p < 0.05, ***p < 0.001, ****p < 0.0001. See also Figure S4.
Figure 6
Figure 6
Inhibition of ALK Impaired BRAFi-Resistant Melanoma in Cell Culture and in Mice (A) Parental A375 (A375-P) and BRAFi-resistant A375 cells (A375-R) were treated with DMSO or the indicated concentrations of vemurafenib or ceritinib for 3 days and analyzed for survival using the MTT assay. Relative cell survival (%) in reference to DMSO-treated cells is shown. (B) A375-P and BRAFi-resistant A375-R cells were treated with vemurafenib (1 μM) or ceritinib (1 μM) and analyzed for anchorage-independent growth by the soft-agar assay. Representative images for soft-agar colonies for the indicated melanoma cell lines under the indicated treatment conditions are shown. Scale bar, 500 μm. (C) Relative colony size for the indicated melanoma cell lines at the indicated treatment conditions is shown. (D) Vemurafenib-resistant A375 cells (A375-R) were subcutaneously injected into the flanks of athymic nude mice (n = 5) and treated with vehicle, vemurafenib (30 mg/kg), or ceritinib (25 mg/kg). Average tumor volumes (n = 5) at the indicated weeks are plotted. (E) Representative tumor images for the indicated conditions for the experiment in panel (D). Data are presented as mean ± SD. ns, not significant p value. *p < 0.05, ***p < 0.001, and ****p < 0.0001. See also Figures S5 and S6.
Figure 7
Figure 7
Residual Tumor-Derived BRAF and ALK Inhibitor Dual Resistant Melanoma Cells Were Sensitive to a Broad-Spectrum Anti-apoptotic Protein inhibitor, AT101 (A) Schematic showing steps for generating cell lines from melanoma tumors isolated from mice treated with either vehicle or ceritinib. (B) Tumor-derived BRAFi-resistant and ceritinib-sensitive cells (A357-R-Cer-S) and BRAFi and ceritinib dual resistant A375 cells (A375-R-Cer-R) cells were treated with indicated concentrations of ceritinib for 3 days and analyzed by MTT assay. Relative cell survival (%) in reference to DMSO-treated cells is shown. (C) Tumor-derived A375-R-Cer-S and A375-R-Cer R cells were treated with DMSO or ceritinib (1 μM) and analyzed for anchorage-independent growth by soft-agar assay. Representative images for soft-agar colonies are shown. Scale bar, 500 μm. (D) Relative colony size for indicated melanoma cell lines at the indicated treatment conditions is shown. (E) Tumor-derived A375-R-Cer-S and A375-R-Cer-R cells were treated with the indicated concentrations of broad anti-apoptotic protein inhibitor AT101 (10 μM) for 72 h and analyzed for survival using the MTT assay. Relative cell survival (%) relative to DMSO-treated cells is shown. (F) Mice tumor-derived A375-R-Cer-S and A375-R-Cer-R cells were treated with AT101 (10 μM) and analyzed for anchorage-independent growth by the soft-agar assay. Representative images for soft-agar colonies for the indicated conditions are shown. Scale bar, 500 μm. (G) Relative colony size for the indicated melanoma cell lines at indicated treatment conditions is shown. (H) Model summarizing the findings of our study. Data are presented as mean ± SD. ns, not significant p value. *p < 0.05, **p < 0.01, and ****p < 0.0001. See also Figure S7.

Similar articles

Cited by

References

    1. Adams J.M., Cory S. The BCL-2 arbiters of apoptosis and their growing role as cancer targets. Cell Death Differ. 2018;25:27–36. - PMC - PubMed
    2. Adams, J.M., and Cory, S.. (2018). The BCL-2 arbiters of apoptosis and their growing role as cancer targets. Cell Death Differ. 25, 27-36. - PMC - PubMed
    1. Anastas J.N., Kulikauskas R.M., Tamir T., Rizos H., Long G.V., von Euw E.M., Yang P.T., Chen H.W., Haydu L., Toroni R.A. WNT5A enhances resistance of melanoma cells to targeted BRAF inhibitors. J. Clin. Invest. 2014;124:2877–2890. - PMC - PubMed
    2. Anastas, J.N., Kulikauskas, R.M., Tamir, T., Rizos, H., Long, G.V., von Euw, E.M., Yang, P.T., Chen, H.W., Haydu, L., Toroni, R.A., et al. (2014). WNT5A enhances resistance of melanoma cells to targeted BRAF inhibitors. J. Clin. Invest. 124, 2877-2890. - PMC - PubMed
    1. Atefi M., von Euw E., Attar N., Ng C., Chu C., Guo D., Nazarian R., Chmielowski B., Glaspy J.A., Comin-Anduix B. Reversing melanoma cross-resistance to BRAF and MEK inhibitors by co-targeting the AKT/mTOR pathway. PLoS One. 2011;6:e28973. - PMC - PubMed
    2. Atefi, M., von Euw, E., Attar, N., Ng, C., Chu, C., Guo, D., Nazarian, R., Chmielowski, B., Glaspy, J.A., Comin-Anduix, B., et al. (2011). Reversing melanoma cross-resistance to BRAF and MEK inhibitors by co-targeting the AKT/mTOR pathway. PLoS One 6, e28973. - PMC - PubMed
    1. Bisserier M., Wajapeyee N. Mechanisms of resistance to EZH2 inhibitors in diffuse large B-cell lymphomas. Blood. 2018;131:2125–2137. - PMC - PubMed
    2. Bisserier, M., and Wajapeyee, N.. (2018). Mechanisms of resistance to EZH2 inhibitors in diffuse large B-cell lymphomas. Blood 131, 2125-2137. - PMC - PubMed
    1. Bolger M.B., Sherman M.A. Computer modeling of combining site structure of anti-hapten monoclonal antibodies. Methods Enzymol. 1991;203:21–45. - PubMed
    2. Bolger, M.B., and Sherman, M.A.. (1991). Computer modeling of combining site structure of anti-hapten monoclonal antibodies. Methods Enzymol. 203, 21-45. - PubMed