. 2019 Aug 12;377(2151):20180175.
doi: 10.1098/rsta.2018.0175. Epub 2019 Jun 24.

Hybrid LWFA-PWFA staging as a beam energy and brightness transformer: conceptual design and simulations

Affiliations

Hybrid LWFA-PWFA staging as a beam energy and brightness transformer: conceptual design and simulations

A Martinez de la Ossa et al. Philos Trans A Math Phys Eng Sci. .

Abstract

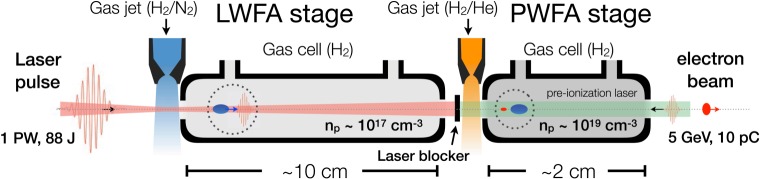
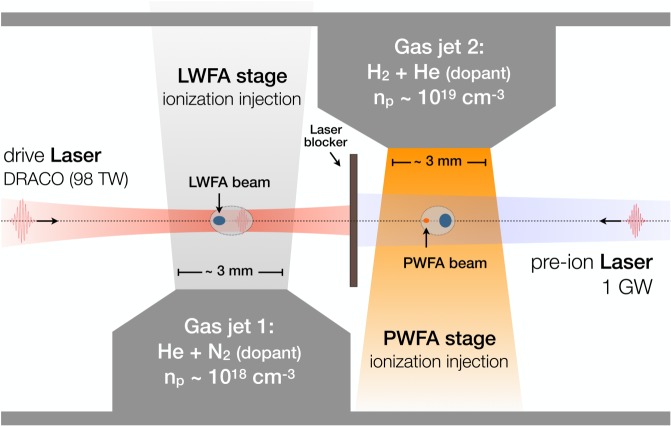
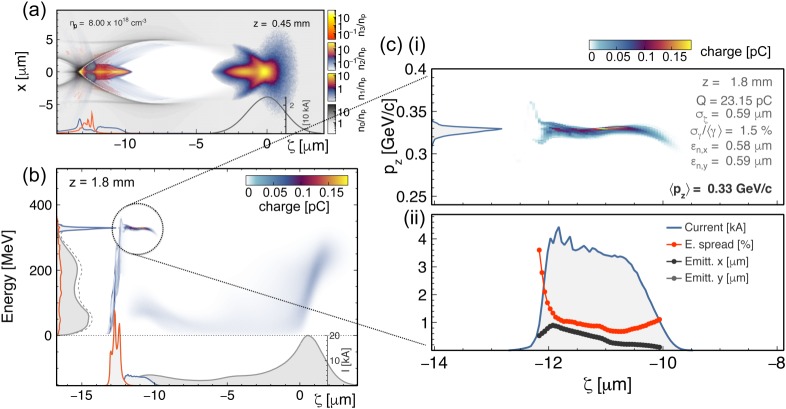
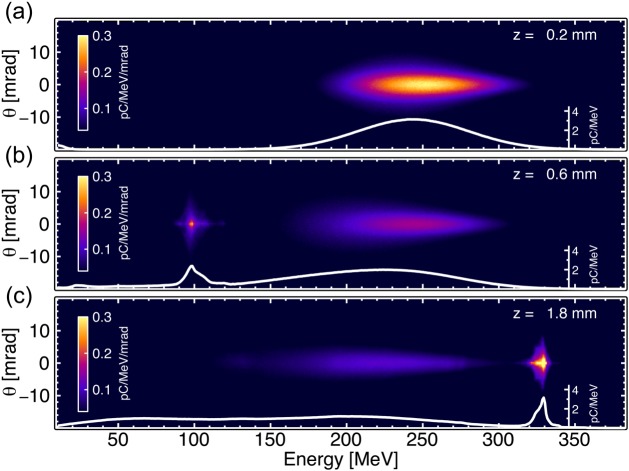
We present a conceptual design for a hybrid laser-driven plasma wakefield accelerator (LWFA) to beam-driven plasma wakefield accelerator (PWFA). In this set-up, the output beams from an LWFA stage are used as input beams of a new PWFA stage. In the PWFA stage, a new witness beam of largely increased quality can be produced and accelerated to higher energies. The feasibility and the potential of this concept is shown through exemplary particle-in-cell simulations. In addition, preliminary simulation results for a proof-of-concept experiment in Helmholtz-Zentrum Dresden-Rossendorf (Germany) are shown. This article is part of the Theo Murphy meeting issue 'Directions in particle beam-driven plasma wakefield acceleration'.

Keywords: beam quality transformer; beam-driven plasma wakefield accelerator; high brightness; hybrid; laser-driven plasma wakefield accelerator.


Conflict of interest statement

We declare we have no competing interests.

Figures

Figure 1.
Figure 1.
Schematic of a hybrid LWFA–PWFA staged setup with ionization injection. The set-up consists of two quasi-identical plasma acceleration stages coupled to each other. In each stage, the injection of a witness beam is induced by field-ionization from the dopant species contained in the gas jet. Immediately after the gas jet, a longer plasma cell with no dopant is used to further accelerate the generated witness beam. (Online version in colour.)
Figure 2.
Figure 2.
Three-dimensional OSIRIS simulation for an LWFA stage with ionization injection. (a(i)) Electron density on the central xz plane of the simulation during the injection process, at z = 0.05 mm. (a(ii)) Same quantities once the dopant section has been passed, at z = 0.76 mm. The electron densities of the plasma (grey) and the high levels of nitrogen (blue/yellow) are shown. Also the magnitude of the normalized vector potential of the laser is shown (orange/red). The dark grey line at the bottom shows the charge per unit of length of the injected electrons. (a(iii)) Longitudinal electric field, Ez, also at z = 0.76 mm. The red outline represents the on-axis values. (b(i)) Longitudinal phase space of the witness beam, and (b(ii)) Sliced values of the current (blue), relative energy spread (red) and normalized emittance in the x (dark grey), and y (light grey) planes. (c(i)) Evolution of the average longitudinal momentum of the beam (dark grey), the total relative energy spread (red), and the average sliced relative energy spread (dashed red), with the propagation distance. (c(ii)) Evolution of the projected normalized emittance of the beam in the x (dark grey), and y (light grey) planes. (Online version in colour.)
Figure 3.
Figure 3.
Three-dimensional OSIRIS simulation for a PWFA stage with WII injection. (a(i)) Electron density on the central xz plane of the simulation during the injection process, at z = 0.04 mm. (a(ii)) Same quantities once the dopant section has been passed, at z = 2.6 mm. The electron densities of the plasma (grey) and the He+ level (orange/yellow) are shown. The dark grey and orange lines at the bottom show the charge per unit of length of the driver and the injected electrons, respectively. (a(iii)) Longitudinal electric field, Ez, also at z = 2.6 mm. The red outline represents the on-axis values. (b(i)) Longitudinal phase space of the witness beam after 12 mm of propagation, and (b(ii)) sliced values of the current (blue), relative energy spread (red) and normalized emittance in the x (dark grey) and y (light grey) planes. (c(i)) Evolution of the average longitudinal momentum of the beam (dark grey), the total relative energy spread (red), and the average sliced relative energy spread (dashed red). (c(ii)) Evolution of the projected normalized emittance of the beam in the x (dark grey) and y (light grey) planes. (Online version in colour.)
Figure 4.
Figure 4.
Schematic of the double-jet plasma target for the LPWFA proof-of-concept experiment at HZDR. In the first gas jet an LWFA stage is driven by the DRACO laser for the generation of a high-current electron beam. In the second gas jet, the LWFA-produced electron beam drives a PWFA for the production of a new electron beam with largely improved energy and brightness. A thin foil made of kapton is placed at the entrance of the second jet in order to reflect the main laser, while letting the electron beam go through into the second stage. A counter-propagating low-intensity laser can be used in order to fully preionize the hydrogen to facilitate the beam refocusing and enhance the blowout formation in the second stage. (Online version in colour.)
Figure 5.
Figure 5.
Three-dimensional OSIRIS PIC simulation for the LPWFA stage in the proof-of-concept experiment at HZDR. (a) Electron density on the central xz plane of the simulation at z = 0.45 mm, for the plasma (grey), the first (blue/yellow) and the second (orange/yellow) electronic levels of helium. The dark grey, blue and orange lines at the bottom show the charge per unit of length of the driver, electrons from the first and second level of helium, respectively. (b) Longitudinal phase space of the driver and witness beams after 1.8 mm of propagation. (c(i)) Longitudinal phase space of the witness beam after 1.8 mm of propagation, and (c(ii)) Sliced values of the current (blue), relative energy spread (red) and normalized emittance in the x (dark grey) and y (light grey) planes. (Online version in colour.)
Figure 6.
Figure 6.
Three-dimensional OSIRIS PIC simulation for the LPWFA stage in the proof-of-concept experiment at HZDR. Distribution of the driver and witness beams on the divergence versus energy plane, for three propagation distances. The white curves represent the projections on the energy axis. (Online version in colour.)

References

    1. Tajima T, Dawson J. 1979. Laser electron accelerator. Phys. Rev. Lett. 43, 267–270. (10.1103/PhysRevLett.43.267) - DOI
    1. Veksler VI. 1956. Coherent principle of acceleration of charged particles. Conf. Proc. CERN (10.5170/CERN-1956-025.80) - DOI
    1. Chen P, Dawson JM, Huff RW, Katsouleas T. 1985. Acceleration of electrons by the interaction of a bunched electron beam with a plasma. Phys. Rev. Lett. 54, 693–696. (10.1103/PhysRevLett.54.693) - DOI - PubMed
    1. Chen P. 1987. Grand disruption: a possible final focusing mechanism for linear colliders. Part. Accel. 20, 171.
    1. Rosenzweig JB, Breizman B, Katsouleas TC, Su JJ. 1991. Acceleration and focusing of electrons in two-dimensional nonlinear plasma wake fields. Phys. Rev. A 44, R6189–R6192. (10.1103/PhysRevA.44.R6189) - DOI - PubMed

LinkOut - more resources