. 2019 Jul 11;178(2):413-428.e22.
doi: 10.1016/j.cell.2019.05.023. Epub 2019 Jun 20.

Correlated Neural Activity across the Brains of Socially Interacting Bats

Affiliations

Correlated Neural Activity across the Brains of Socially Interacting Bats

Wujie Zhang et al. Cell. .

Abstract

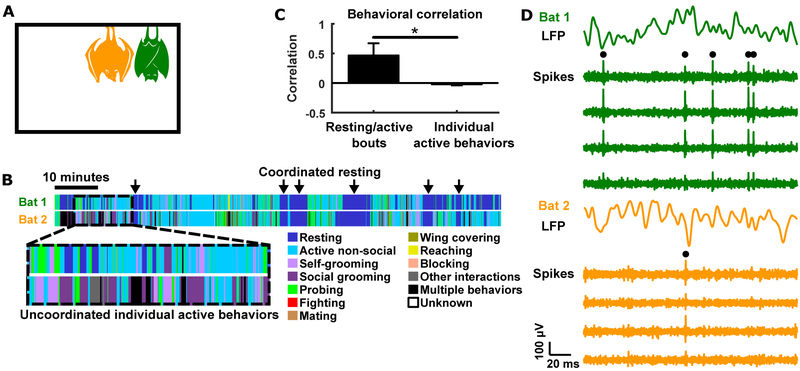
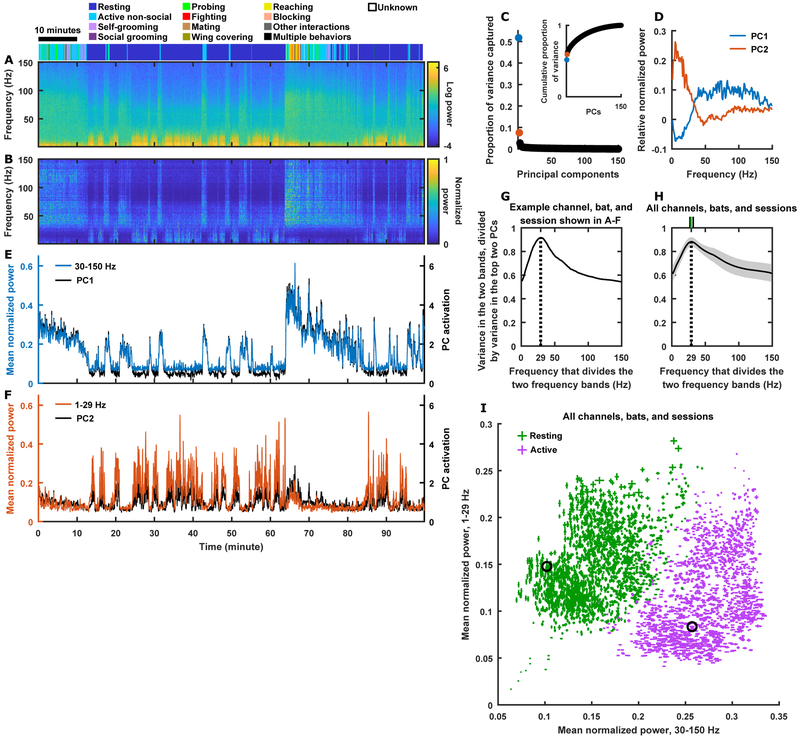
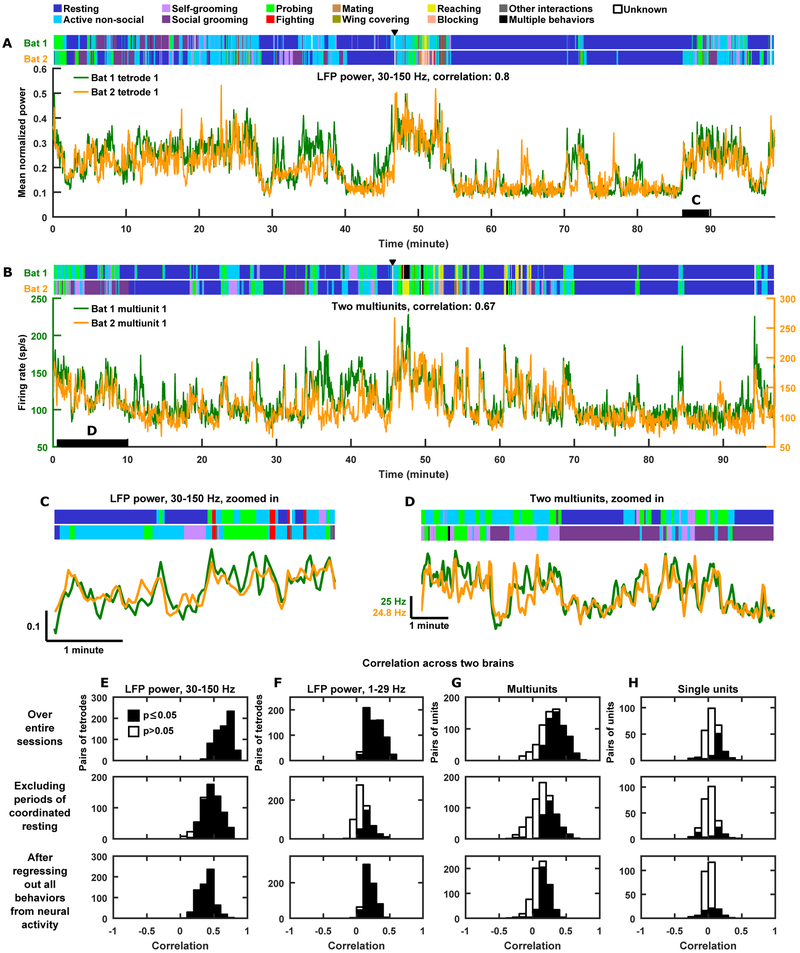
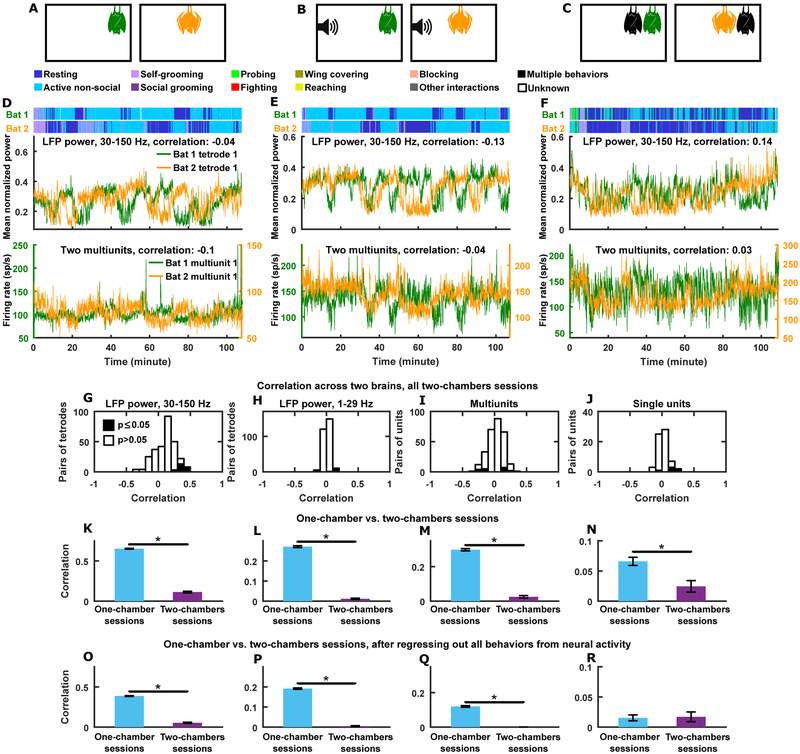
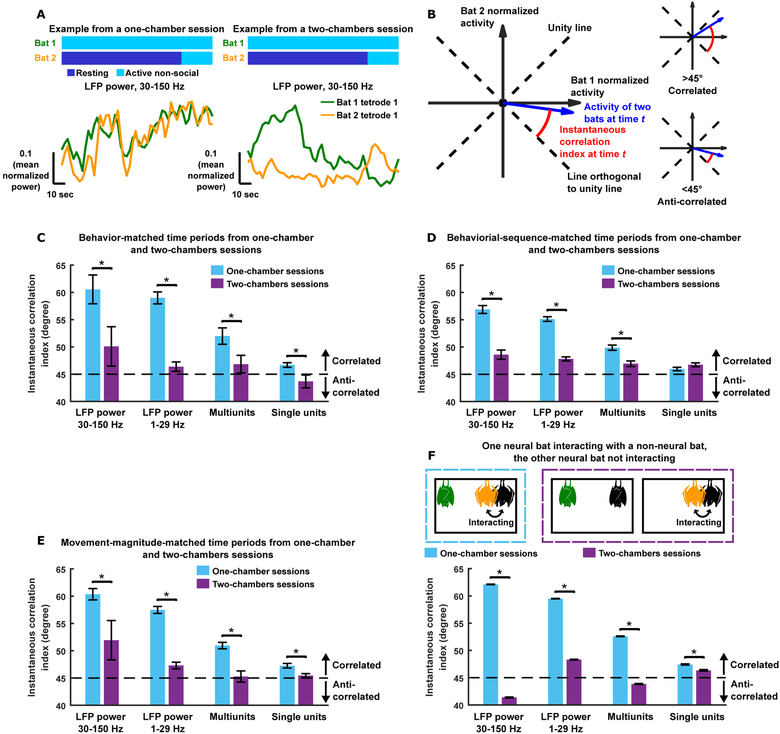
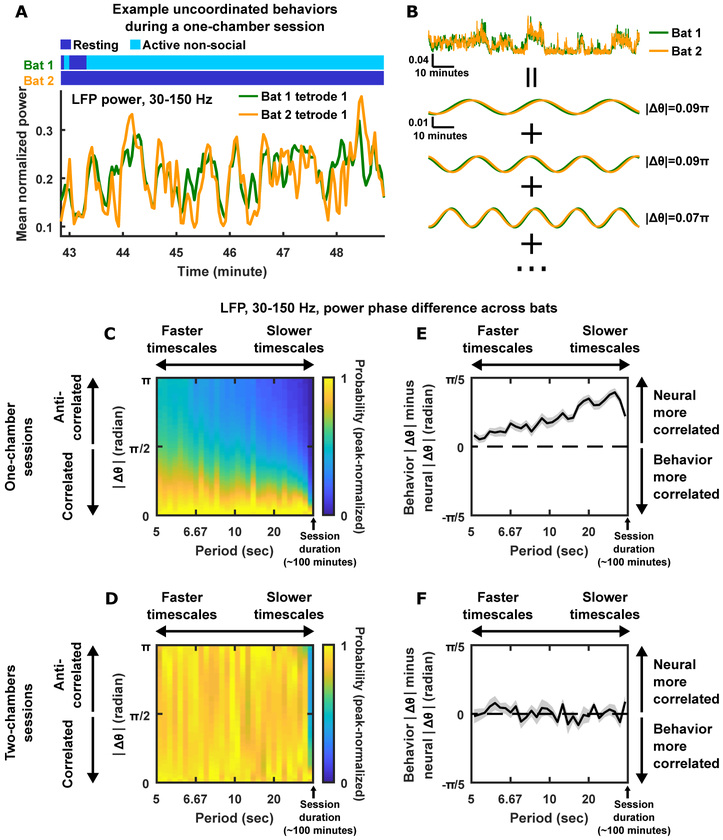
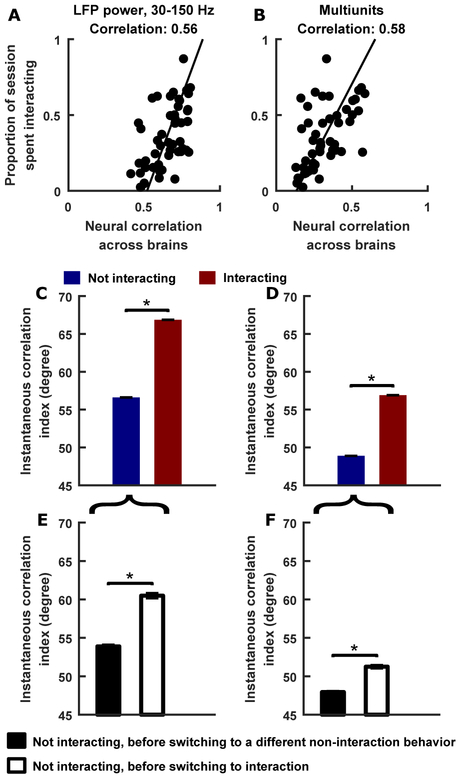
Social interactions occur between multiple individuals, but what is the detailed relationship between the neural dynamics across their brains? To address this question across timescales and levels of neural activity, we used wireless electrophysiology to simultaneously record from pairs of bats engaged in a wide range of natural social interactions. We found that neural activity was remarkably correlated between their brains over timescales from seconds to hours. The correlation depended on a shared social environment and was most prominent in high frequency local field potentials (>30 Hz), followed by local spiking activity. Furthermore, the degree of neural correlation covaried with the extent of social interactions, and an increase in correlation preceded their initiation. These results show that inter-brain correlation is an inherent feature of natural social interactions, reveal the domain of neural activity where it is most prominent, and provide a foundation for studying its functional role in social behaviors.

Keywords: LFP; bats; correlation; electrophysiology; frontal cortex; hyperscanning; mammal; multiunit; single unit; social behavior.


Conflict of interest statement

Declaration of Interests

The authors declare no competing interests.

Figures

Figure 1
Figure 1. Experimental setup and behavior.
(A) Neural activity was wirelessly recorded simultaneously from pairs of bats that freely behaved and interacted in a chamber. (B) Behavior of a pair of bats during one example session, as manually annotated frame-by-frame from the video recording. Resting tends to be coordinated between the bats (arrows), while individual active behaviors tend to be uncoordinated (dashed box). (C) Quantification of behavioral correlation across bats (mean ± STD across sessions; see STAR Methods). Bouts of resting and active behaviors were correlated between bats, whereas individual active behaviors were not. *, p<0.05, Wilcoxon rank sum test. (D) Example voltages traces intracranially recorded simultaneously on two tetrodes, each from a different bat. For each bat, the top trace is LFP, and the bottom traces show spiking activity from the four channels of a tetrode. Black dots highlight spikes for isolated single units.
Figure 2
Figure 2. Dimensionality reduction of LFP.
(A) Spectrogram of LFP from one recording channel from one bat on an example session. The bat’s behavior is indicated on top and aligned in time with the spectrogram. (B) Normalized version of the spectrogram from (A), where power at each frequency was divided by the peak power at that frequency. (C-D) PCA of the normalized spectrogram from (B), with frequencies as variables and time points as observations. (C) Proportion of variance captured by the PCs. Inset shows cumulative proportion of variance. (D) PC1 and PC2 approximately correspond to coordinated activation of high frequencies and low frequencies, respectively. (E-F) Mean normalized power in the 30–150 Hz (E) and 1–29 Hz (F) bands as a function of time, compared to activation of the corresponding PCs. (G-H) The combined variance of two frequency bands, divided by the combined variance of the top two PCs (which is the maximum amount of variance that can be captured by two dimensions), plotted as a function of the dividing frequency that defines the frequency ranges of the two bands (e.g. 29 Hz divides the 1–29 Hz band and the 30–150 Hz band). (G) The optimal dividing frequency is 29 Hz for the example data from (A)-(F). (H) Result averaged across all data. Shading indicates STD. The green tick on top indicates 29 Hz as the median optimal dividing frequency across all data, and the two black ticks indicate the first and third quartiles (27 Hz and 32 Hz). See STAR Methods. (I) Mean normalized power in the two frequency bands, averaged across resting (green) and across active (purple) periods. Two points (one for resting and one for active) are plotted for each channel, bat, and session; error bars indicate SEM. Black circles indicate the example data from (A)-(F).
Figure 3
Figure 3. Highly correlated neural activity across brains.
(A) Mean normalized LFP power in the 30–150 Hz band during an example session, simultaneously recorded from two bats. Annotated behaviors are shown above. Black triangle indicates the time at which a third bat was introduced (neural activity was not recorded from it). (B) Same as (A), but for the activity of two multiunit sites simultaneously recorded from two bats. (C-D) The time periods spanned by the black bars in (A) and (B) are magnified in (C) and (D), respectively. Vertical scale bar in (C) indicates mean normalized power. Note the high levels of correlations, even when the behaviors of the bats were not correlated. (E-H) Histograms of correlations across brains pooled across all sessions and all pairs of bats. Top row, correlations over entire sessions. Middle row, correlations after removing periods of coordinated resting. Bottom row, correlations after regressing out the behaviors of both bats from the neural activity of each bat (i.e. partial correlations). (E-F) LFP power in the high (E) and low (F) frequency bands. (G) Multiunit sites. (H) Single units. Statistical significance of correlations was assessed against null distributions of correlations between surrogate data whose autocorrelations were identical to those of the actual neural data (STAR Methods). See also Figure S3.
Figure 4
Figure 4. Little to no correlation between neural activity across brains in two-chambers sessions.
(A-C) Experimental setup. (A) Simultaneous neural recording from two bats freely behaving in two separate, identical chambers. (B) Same as (A), but with bat social calls (identical for the two chambers) played throughout each session. (C) Same as (A), but each neural recording bat (green and orange) interacting with a different bat (black) in their respective chambers. (D) Neural activity simultaneously recorded from two brains on an example session under the conditions illustrated in (A), plotted along with the behaviors of the two bats during the session. Top, mean normalized LFP power in the 30–150 Hz band; bottom, multiunit activity. (E) Same as (D), but for an example session under the conditions illustrated in (B). (F) Same as (D), but for an example session under the conditions illustrated in (C). (G-J) Histograms of correlations across brains pooled across all two-chambers sessions and all pairs of bats. (G-H) LFP power in the high (G) and low (H) frequency bands. (I) Multiunit sites. (J) Single units. Note the near complete absence of significant correlations across brains in the two-chambers session. Statistical significance assessed in the same way as for Figure 3E–H. (K-N) Mean correlation (± SEM) for one-chamber sessions (blue) and for two-chambers sessions (purple), for the LFP high frequency (K) and low frequency (L) band, multiunit sites (M), and single units (N). (O-R) Same as (K-N), but calculated after regressing out the behaviors of both bats from the neural activity of each bat. *, p<0.05, Wilcoxon rank sum test. See also Figure S4.
Figure 5
Figure 5. Correlation across brains is a signature that animals share a social environment.
(A) Mean normalized LFP power in the high frequency band simultaneously recorded from two bats, during two time periods with matched behaviors, one from a one-chamber session and the other from a two-chambers session. Note that neural activity was much more correlated on the one-chamber session, despite the matched behaviors. (B) Schematic illustrating the instantaneous correlation index. Given two N-dimensional vectors X and Y representing neural activity at N time points from two bats, we subtract from each vector its mean, and then normalize each to unit length, resulting in two vectors of normalized activity x and y. At a given time point t, the normalized activity of the two bats, (xt, yt), is a vector in 2D space (blue vector). The instantaneous correlation index is defined as the smaller of the two angles between the blue vector (xt, yt) and the line orthogonal to the unity line. The instantaneous correlation index ranges from 0 degree to 90 degrees. If neural activity is correlated at a given time, i.e. activity is high in both bats or low in both bats, the blue vector is close to the unity line and the instantaneous correlation index is close to 90 degrees. If neural activity is anti-correlated at a given time, i.e. activity is high in one bat and low in the other bat, the blue vector is close to the line orthogonal to the unity line and the instantaneous correlation index is close to 0 degree. An instantaneous correlation index of 45 degrees indicates no correlation. See STAR Methods. (C-E) Instantaneous correlation index during behaviorally matched (C), behavioral-sequence-matched (D), and movement-magnitude-matched (E) time periods on one-chamber and two-chambers sessions (mean ± SEM; STAR Methods). Note that the matching in (C)-(D) included both interaction and non-interaction behaviors. Movement magnitude was estimated through deep-neural-network-based video analysis using DeepLabCut (Mathis et al., 2018; Figure S5). (F) Instantaneous correlation index (mean ± SEM across time points) under the conditions illustrated in the dotted boxes (see Results for details). Note that while the schematic only illustrates the case where the “orange bat” was the one interacting, for the actual analysis, any neural bat could be the one interacting. Note that despite the matched behaviors or states of social interactions, in almost all cases the instantaneous correlation index was significantly higher when bats shared the same social environment, and when they did not share a social environment, their neural activity showed weak to no correlations (i.e. the purple bars are close to 45 degrees). *, p<0.05, one-tailed Wilcoxon signed rank test (C)-(E) or one-tailed Wilcoxon rank sum test (F). See also Figures S5 and S7.
Figure 6
Figure 6. Neural correlation across brains over a wide range of timescales, above and beyond behavioral correlation.
(A) Mean normalized LFP power in the high frequency band simultaneously recorded from two bats when one of them was resting and the other was mostly active. Note the high degree of correlation between the two bats despite their very different behaviors. (B) Analyzing phase difference. Example traces of mean normalized LFP power from two bats (top; scale bars denote mean normalized power and time) are decomposed into sums of sine waves at different timescales (bottom; scale bars are shared between the three pairs of sine waves). |Δθ|, the absolute value of the phase difference between a pair of sine waves, is indicated. The more correlated the LFP power traces are at a given timescale, the smaller |Δθ| is at that timescale. (C) Distributions of |Δθ| as a function of timescale for one-chamber sessions (STAR Methods). The x-axis is the period of the sine waves into which the neural signals were decomposed (as shown in B); smaller periods correspond to faster timescales, with the maximum period being the session duration of ~100 minutes. Each vertical “slice” of the plot is a distribution of |Δθ| at a given timescale, computed over all pairs of channels, all pairs of bats, and all one-chamber sessions. Each distribution (i.e. each vertical slice) was individually peak-normalized for visualization, where the peak-normalized probability is indicated by color. Note that across the entire range of timescales, the distributions are peaked near a |Δθ| of 0, indicating that correlation across brains extended over the entire range of timescales, from seconds to hours. (D) Same as (C) but for two-chambers sessions. Note that at most timescales, |Δθ| was randomly distributed, indicating the absence of correlation on two-chambers sessions. (E-F) |Δθ| was calculated for binary time series of resting/active behaviors and compared with neural |Δθ| (STAR Methods). (E) Behavior |Δθ| minus neural |Δθ|, as a function of timescales, averaged across all one-chamber sessions. Shading indicates SEM. Note that the curve is positive throughout the entire range of timescales, indicating that neural correlation is above and beyond the behavioral correlation of resting/active bouts at these timescales. (F) Same as (E) but for two-chambers sessions. Note that for the two-chambers sessions, neural correlation was comparable to the behavioral correlation of resting/active bouts, suggesting that the neural correlations were largely a reflection of the behavioral correlation of resting/active bouts. See also Figure S6.
Figure 7
Figure 7. Relationship between neural correlation and social interactions.
(A-B) The proportion of time bats spent interacting with each other in each one-chamber session, as a function of the correlation across brains in that session, averaged across all pairs of tetrodes, for LFP power in the 30–150 Hz band (A), and for multiunit sites (B). Each point is a single session. Time spent interacting is defined as the amount of time when the behavior of at least one of the neural bats involved interaction with the other neural bat. Lines are total least squares regression lines. (C-D) Instantaneous correlation index during non-interaction behaviors (blue bars) and during interactions (red bars), for LFP power in the 30–150 Hz band (C), and for multiunit sites (D), averaged across all pairs of tetrodes, all pairs of bats, and all one-chamber sessions (mean ± SEM). Note that the blue bars are above 45 degrees, meaning neural activity was correlated across brains when the bats shared the same social environment without explicitly interacting with each other. Note also that the red bars are higher than the blue bars, indicating that correlations were higher when the bats were interacting compared to when they were not. (E-F) Instantaneous correlation index during non-interaction behaviors that preceded other non-interaction behaviors, and during non-interaction behaviors that preceded interactions, for LFP power in the 30–150 Hz band (E), and for multiunit sites (F), averaged across all pairs of tetrodes, all pairs of bats, and all one-chamber sessions (mean ± SEM). Note that correlations were higher before transitions to social interactions, meaning that the initiation of interactions were preceded by an increase in correlation. *, p<0.05, one-tailed Wilcoxon rank sum test. See also Figure S7.

Comment in

  • Social Minds Sync Alike.
    Omer DB, Zilkha N, Kimchi T. Omer DB, et al. Cell. 2019 Jul 11;178(2):272-274. doi: 10.1016/j.cell.2019.06.019. Cell. 2019. PMID: 31299199

References

    1. Adolphs R (2001). The neurobiology of social cognition. Curr. Opin. Neurobiol 11, 231–239. - PubMed
    1. Amodio DM, and Frith CD (2006). Meeting of minds: the medial frontal cortex and social cognition. Nat. Rev. Neurosci 7, 268–277. - PubMed
    1. Anderson DJ (2016). Circuit modules linking internal states and social behaviour in flies and mice. Nat. Rev. Neurosci 17, 692–704. - PubMed
    1. Anderson DJ, and Perona P (2014). Toward a science of computational ethology. Neuron 84, 18–31. - PubMed
    1. Babiloni F, and Astolfi L (2014). Social neuroscience and hyperscanning techniques: Past, present and future. Neurosci. Biobehav. Rev 44, 76–93. - PMC - PubMed

Publication types