. 2019 Jul 11;178(2):429-446.e16.
doi: 10.1016/j.cell.2019.05.022. Epub 2019 Jun 20.

Correlated Neural Activity and Encoding of Behavior across Brains of Socially Interacting Animals

Affiliations

Correlated Neural Activity and Encoding of Behavior across Brains of Socially Interacting Animals

Lyle Kingsbury et al. Cell. .

Abstract

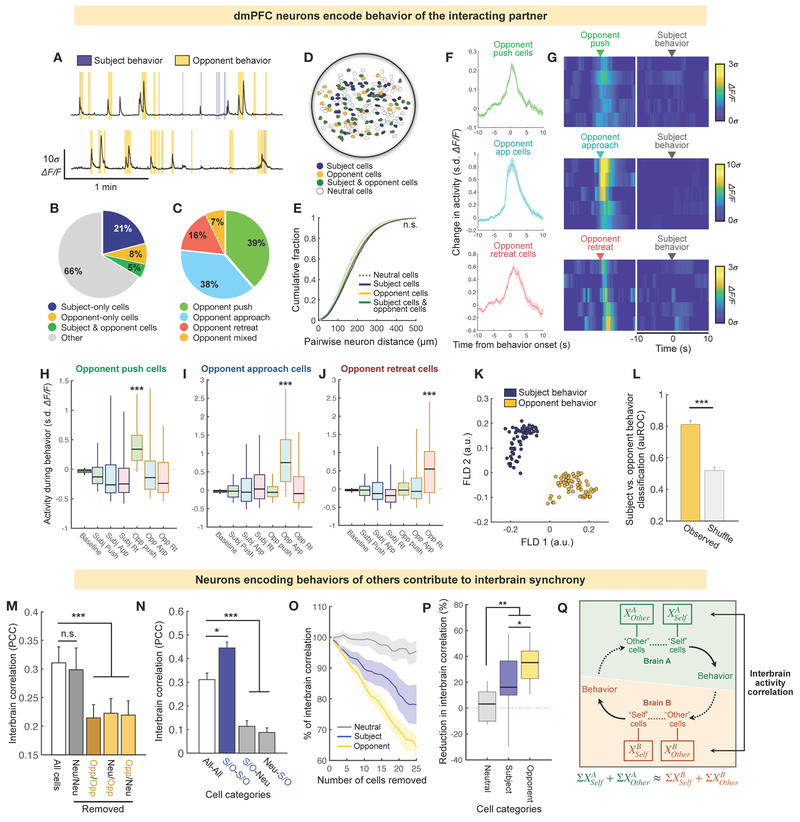
Social interactions involve complex decision-making tasks that are shaped by dynamic, mutual feedback between participants. An open question is whether and how emergent properties may arise across brains of socially interacting individuals to influence social decisions. By simultaneously performing microendoscopic calcium imaging in pairs of socially interacting mice, we find that animals exhibit interbrain correlations of neural activity in the prefrontal cortex that are dependent on ongoing social interaction. Activity synchrony arises from two neuronal populations that separately encode one's own behaviors and those of the social partner. Strikingly, interbrain correlations predict future social interactions as well as dominance relationships in a competitive context. Together, our study provides conclusive evidence for interbrain synchrony in rodents, uncovers how synchronization arises from activity at the single-cell level, and presents a role for interbrain neural activity coupling as a property of multi-animal systems in coordinating and sustaining social interactions between individuals.

Keywords: calcium imaging; hyperscanning; interbrain synchrony; mPFC; miniscope; mouse; neural circuit; prefrontal cortex; social behavior; social dominance.


Conflict of interest statement

DECLARATION OF INTERESTS

The authors declare no competing interests.

Figures

Figure 1.
Figure 1.. Correlated neural activity across brains of interacting animals during free social interaction.
(A) Illustration of social interactions in the open arena. (B) Behavior raster plot of two animals interacting in the open arena. (C) Percentage of time animals engage in behavior in the open arena. Each dot represents one animal from one session. (D) Distribution of behaviors mice display in the open arena interaction. (E) Schematic of head-mounted microscope and GRIN lens implantation above dmPFC. (F) Example image of injection site showing expression of GCaMP6f in dmPFC. (G) Example image showing viral expression in dmPFC cell bodies. Green = GCaMP6f, Blue = DAPI. (H) Example imaging field of view with individual cell bodies. (I) Example calcium traces recorded from one session. (J) Example trace showing overall dmPFC activity (mean activity of all cells) in one animal during social interaction overlaid with behavior annotations. (K) Example calcium traces showing overall dmPFC activity from two animals engaged in social interaction. (L) Interbrain correlations of overall dmPFC activity in animals, compared with those of temporally permuted traces. (M) Cross-correlation of dmPFC activity traces from interacting animals compared with that of phase-randomized traces. (N) Quantification of cross-correlations shown in (M) at 0 s or ±60 s. p*** < 0.001, p > 0.05, n.s. (C, L, M) mean ± sEm. In L-N and Figure 2, pairs with a relatively high degree of social interaction were analyzed (STAR Methods). See also Figures S1 and S2, and Movie S1
Figure 2.
Figure 2.. Interbrain correlations depend on ongoing social interaction.
(A) Interbrain correlations of dyads during full open arena sessions or correlations after removing epochs of concurrent rest, defined as when both animals display no observable behavior. (B) Interbrain activity correlations during single epochs (1 min) with low or high behavior correlation (the PCC of binary vectors measuring the presence of any behavior), compared with correlations of phase-randomized signals. (C) Interbrain correlations of epochs when one or both animals engaged in social vs. non-social behavior. (D) Schematic of the open arena interaction with social contact or with separation of animals with a barrier. Head-mounted microscopes were connected via an ultra-light cable that is long and flexible enough to prevent tangling during the course of social interactions. (E) Example calcium traces of overall dmPFC activity (mean activity) in a dyad with or without social contact. (F) Interbrain correlations in pairs with or without social contact. (G) Schematic showing comparisons of correlations across pairs engaged in social interaction (within pair) and across animals that each interacted with a different animal (between pair). (H) Comparison between interbrain correlations across interacting or non-interacting pairs. (I) Interbrain correlations during single epochs (30 s) with concurrent behavior bouts in interacting pairs or those over behavior-matched epochs in non-interacting animals. (J) Schematic showing GLMs used to model dmPFC activity in one animal as a function of behaviors exhibited by both animals (Model 1) or as a function of behaviors as well as activity in the other animal (Model 2). An example of modeled dmPFC activity is shown in the pink trace. (K) Relative difference in GLM model performance when activity from the interacting partner is included as additional explanatory variable (J), compared with that using phase randomized controls. (STAR Methods; also see Figure S4G for the equivalent analysis in the tube test). p*** < 0.001; p** < 0.01; p > 0.05, n.s. (H-I) mean ± SEM. See also Figure S2.
Figure 3.
Figure 3.. Dynamics of social behaviors during competitive interaction.
(A) Cartoon of mice engaged in the tube test. (B) Illustration of the neural network used for automated tracking of mice. (C) Behavior annotations and position trajectories of a pair of mice in the tube test. (D) Total percentage of time animal pairs (either animal) engaged in social interaction. (E) Distribution of time animals displayed different behaviors. (F) Average tube positions in dominant or subordinate animals (STAR Methods). (G) Fraction of interaction time when only one or both animals are behaving. (H-J) Change in probability of opponent animal behavior with respect to subject animal push (H), retreat (I), or approach (J). (K-M) Percentage of time spent pushing (K), retreating (L), and approaching (M) in dominants or subordinates in pairs that displayed a large difference in dominance (STAR Methods). (N) Change in relative probability of dominant or subordinate retreat behavior following opponent push. (O) Probability of retreat in dominants or subordinates 1 second following opponent push. p*** < 0.001; p** < 0.01; p > 0.05, n.s. (D, F, N) mean ± SEM. See also Figure S3.
Figure 4.
Figure 4.. Correlated neural activity across animals during competitive social interaction.
(A) Cartoon showing simultaneous imaging of two mice during the tube test. (B) Example traces of overall dmPFC activity (mean of all neurons) from two animals during the tube test. (C) Interbrain correlations in interacting pairs or correlations of randomly permuted traces. (D) Comparison of correlations of behavior (PCC of binary event vectors) across animals vs. correlations of dmPFC activity. (E) Interbrain correlations during the tube test or after removing concurrent rest epochs when both animals display no observable behavior. (F) Interbrain correlations during tube test sessions or during epochs (≥ 1 min) when one animal is behaving while the other is resting (displaying no observable behavior), compared with phase randomized controls. (G) Interbrain correlations during single epochs (1 min) of low or high overall behavior correlation (PCC of binary vectors measuring the presence of any behavior), compared with those of phase-randomized traces. (H) Schematic showing introduction of a separator in the tube test to abolish social contact. (I) Example traces showing dmPFC activity across two animals with or without social contact. (J) Interbrain correlations with or without social contact. (K) Schematic showing pairs engaged in social interaction (within pair) or pairs that each interact with a different animal (between pair). (L) Interbrain correlations across interacting or non-interacting animals. (M) Interbrain correlations during single epochs (30 s) with concurrent behavior bouts in interacting pairs or during behavior-matched epochs in non-interacting animals. (N) Cross-correlation of dmPFC activity from pairs of mice in the tube test and that of phase-randomized controls. (O) Quantification of cross-correlations shown in (N) at 0 s vs. ±30 s. p*** < 0.001; p** < 0.01; p > 0.05, n.s. (C, L-N) mean ± SEM. See also Figure S4 and Movie S2.
Figure 5.
Figure 5.. dmPFC neurons encode social behaviors during competitive interaction.
(A) Mean trial-averaged response of dmPFC neurons (normalized to the 15 s preceding behavior) centered at onset of social behaviors. (B) ROC curves from example neurons for push behavior. (C) Examples of single cells that selectively encode different behaviors. (D) Distribution of behavior-encoding neurons. (E) Distribution of excited and suppressed cells within each behavior category. (F) Trial-averaged responses of example behavior cells. (G) Example field of view showing spatial distribution of behavior cells. (H) Cumulative fraction of pairwise distances among different subsets of behavior cells, compared with neutral cells (Kolmogorov-Smirnov test). (I) Population responses during behavior events (Mahalanobis distance between trial population vectors and baseline activity), averaged across sessions (STAR Methods). (J) Population responses (as in I) during different behaviors over 3 seconds following behavior onset. (K) Principal component (PC) separation of behavior-evoked population responses from one session; each dot is the mean response from one behavior bout. (L) Euclidean distance between PC-projected population vectors within or between behavior types, averaged within each session. (M) FLD decoders trained to predict different behaviors from rest using population activity. Plots: projections of population activity onto the linear discriminant; dark patches: annotated behavior; light patches: frame-by-frame predictions of example classifiers. (N) Performance of FLD decoders exemplified in (M), compared with models constructed using shuffled class labels. (O) Performance of 3-way multi-class FLD decoders trained to distinguish between push, approach, and retreat behavior. Red line: expected chance level in the three-way decoder. p*** < 0.001; p** < 0.01; p > 0.05, n.s. (A, I) mean ± SEM. (A, C, F) ΔF/F calcium traces are presented in units of standard deviation (s.d.). See also Figures S5 and S6.
Figure 6.
Figure 6.. Interbrain correlations depend on neurons encoding one’s own social behavior.
(A) Interbrain activity correlations after removal of behavior-excited (Bv) or neutral (Neu) cells from both animals. (B-D) Interbrain correlations between the mean activity of subsets of push- (B), approach- (C), and retreat- (D) excited cells (the top 15 cells based on auROC values). (E) Schematic of models of interbrain activity across animals. The mean activity of all neurons in one animal (top) is modeled as a function of single cell activities in the interacting partner (bottom) using a GLM. (F) Performance (cross-validated PCC) of GLMs to predict activity in one animal using single cell activities from the other, compared with that of models using randomly permuted controls. (G) Weight contributions of behavior (Bv) and neutral (Neu) cells in GLMs of overall activity in (F), computed as the average of z-scored coefficients fit to Bv or Neu cells in each model. (H-J) Performance of GLMs modeling the mean activity of subsets of behavior cells, as in (B-D), compared with that of GLMs modeling the mean of neutral cells. (K-M) Weight contributions of behavior (push-, approach-, or retreat-excited) cells fit to models of behavior-encoding subpopulations in (H-J), computed as the average of z-scored coefficients for each cell type. (N) Correlation between the percentage of highly correlated single cell pairs (> 99th percentile of random distribution, see Figures S7E-F) and the interbrain activity correlation across pairs. (O) Fraction of behavior cells that belong to an interbrain cell pair with low (bottom 20% of random distribution) or high (top 20% of random distribution) correlations. (P) Fraction of behavior cells in highly correlated (>99th percentile of random distribution) cell pairs in dominants and subordinates. p*** < 0.001; p** < 0.01; p > 0.05, n.s. (A, F, P) mean ± SEM. See also Figure S7.
Figure 7.
Figure 7.. Neurons encoding behavior of the social partner contribute to interbrain correlations.
(A) Example traces from dmPFC neurons that respond during opponent behavior. (B) Fraction of neurons that are significantly responsive during subject, opponent, or both types of behavior based on ROC analysis. (C) Distribution of opponent-encoding neurons that selectively respond during specific behaviors. (D) Example field of view showing the spatial distribution of subject and opponent cells. (E) Cumulative fraction of pairwise distances among different subsets of cells, compared with neutral cells (Kolmogorov-Smirnov test). (F) Trial-averaged responses of behavior-selective opponent cells. (G) Trial-averaged responses of example opponent push-, approach-, and retreat-excited neurons during opponent or subject behavior. (H-J) Mean activity of opponent push- (H), approach- (I), and retreat-excited (J) cells during each type of subject or opponent behavior. Behavior bouts that overlapped across subject and opponent were excluded to ensure that activity during opponent behavior was not contaminated by subject behavior. During opponent behaviors used for this analysis, the subject animal did not exhibit any behavior or positional change (see Figures S3F-G). (K) Population responses during subject and opponent behavior (from a cross-validation test set) projected onto the first two Fisher’s linear discriminant (FLD) dimensions. (L) Performance of FLD decoders to distinguish between subject and opponent behavior based on population activity. (M) Interbrain activity correlations after removal of opponent-excited (Opp) or neutral (Neu) cells from both animals. (N) Interbrain activity correlations between subsets of subject and opponent (S/O) or neutral (Neu) cells (the top 25 cells based on rank-ordered auROC values; STAR Methods). (O) Interbrain correlation upon removal of different numbers of subject, opponent, or neutral cells from each animal. (P) Reduction in interbrain correlation after removing 25 subject, opponent, or neutral cells from each animal, as in (O). (Q) Schematic showing that interbrain correlations arise from the collective contributions of neurons encoding subject and opponent behavior in both animals. As these neurons in each brain represent a common behavior repertoire (i.e. behavior of both animals), overall neural activity becomes synchronized across dyads. p*** < 0.001; p** < 0.01; p > 0.05, n.s. (F, L-O) mean ± SEM. (A, F, G) ΔF/F calcium traces are presented in units of standard deviation (s.d.). See also Figure S8.
Figure 8.
Figure 8.. Interbrain correlations predict future social interactions and dominance relationships.
(A) Examples of neurons with activity modeled by GLMs using positions and behavior of both animals. (B) Distribution of single neuron GLMs with statistically significant (p < 0.05) coefficients fit to only subject behavior, only opponent behavior, or subject and opponent behavior. (C) Distribution of cells with significant coefficients for specific subject and opponent behaviors. (D) Weight contributions (the average of z-scored coefficients) in single neuron GLMs for subject and opponent behavior in dominants and subordinates. (E) Interbrain correlations during behaviors of dominants vs. subordinates. (F) Schematic showing greater influence on interbrain synchrony by dominant animals. (G) Time-courses showing the probability of behavior in one animal as a function of time following behavior onset in the interacting partner, color coded based on the interbrain correlation over the preceding 30 s. (H) Correlation between the interbrain activity PCC preceding behavior in one animal and the response probability of the interacting partner. (I) Regression coefficients (R2) for the linear relationship shown in (H) using subsets of neurons (S/O: subject and opponent cells; Neu: neutral cells). (J) Correlation between the interbrain activity PCC across pairs and the differences in their mean tube position. (K) Regression coefficients (R2) for the linear relationship shown in (J) using subsets of neurons. (L-N) Correlation between interbrain activity PCC during the first 2 min of interaction and overall difference in tube position over the session using all cells (L), only subject- and opponent-encoding cells (M), or only neutral cells (N). (O) Regression coefficients (R2) for the linear relationships between interbrain activity correlations during the first 2 minutes of interaction and dominance difference using subsets of neurons. (P) Schematic showing that interbrain coupling is higher when one animal is significantly more dominant than its opponent, and lower when two animals have similar levels of dominance. p*** < 0.001; p** < 0.01; p > 0.05, n.s. (D) mean ± SEM. See also Figure S8.

Comment in

  • Social Minds Sync Alike.
    Omer DB, Zilkha N, Kimchi T. Omer DB, et al. Cell. 2019 Jul 11;178(2):272-274. doi: 10.1016/j.cell.2019.06.019. Cell. 2019. PMID: 31299199

Similar articles

Cited by

References

    1. Adolphs R (2010). Conceptual Challenges and Directions for Social Neuroscience. Neuron 65, 752–767. - PMC - PubMed
    1. Allsop SA, and Wichmann R (2018). Corticoamygdala Transfer of Socially Derived Information Gates Observational Learning. Cell 173. - PMC - PubMed
    1. Babiloni F, Cincotti F, Mattia D, Mattiocco M, De Vico Fallani F, Tocci A, Bianchi L, Marciani MG, Astolfi L (2006). Hypermethods for EEG hyperscanning. 2006 International Conference of the IEEE Engineering in Medicine and Biology Society (pp. 3666–3669). - PubMed
    1. Chen P, and Hong W (2018). Neural Circuit Mechanisms of Social Behavior. Neuron 98, 16–30. - PMC - PubMed
    1. Cooper MA, Clinard CT, and Morrison KE (2015). Neurobiological mechanisms supporting experience-dependent resistance to social stress. Neuroscience 291, 1–14. - PMC - PubMed

Publication types