. 2019 Jul 11;178(2):473-490.e26.
doi: 10.1016/j.cell.2019.05.027. Epub 2019 Jun 20.

Atlas of Subcellular RNA Localization Revealed by APEX-Seq

Affiliations

Atlas of Subcellular RNA Localization Revealed by APEX-Seq

Furqan M Fazal et al. Cell. .

Abstract

We introduce APEX-seq, a method for RNA sequencing based on direct proximity labeling of RNA using the peroxidase enzyme APEX2. APEX-seq in nine distinct subcellular locales produced a nanometer-resolution spatial map of the human transcriptome as a resource, revealing extensive patterns of localization for diverse RNA classes and transcript isoforms. We uncover a radial organization of the nuclear transcriptome, which is gated at the inner surface of the nuclear pore for cytoplasmic export of processed transcripts. We identify two distinct pathways of messenger RNA localization to mitochondria, each associated with specific sets of transcripts for building complementary macromolecular machines within the organelle. APEX-seq should be widely applicable to many systems, enabling comprehensive investigations of the spatial transcriptome.

Keywords: LADs; OXPHOS; UTRs; cycloheximide; motifs; nocodazole; retrotransposons; spatial transcriptomics; translation.


Conflict of interest statement

DECLARATION OF INTERESTS

A.Y.T., P.K., H.Y.C. and F.M.F. have filed a patent application covering aspects of this work (Patent Application Number US 2017/0226561). H.Y.C. is a co-founder and advisor of Accent Therapeutics. H.Y.C. is an advisor of 10X Genomics and Spring Discovery.

Figures
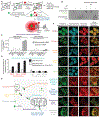
Figure 1:
Figure 1:. Development of APEX-seq methodology
(A) APEX2-mediated proximity biotinylation of endogenous RNAs. APEX2 peroxidase is genetically targeted to the cellular region of interest. Addition of biotin-phenol (red B = biotin) and H2O2 to live cells for 1 minute results in biotinylation of endogenous proteins and RNA within a few nanometers of APEX2. Biotinylated RNAs are separated using streptavidin-coated beads, polyA-selected, and analyzed by RNA-seq. (B) Streptavidin-biotin dot-blot analysis of direct RNA biotinylation by APEX2 in cells. HEK-293T cells expressing APEX2 in the cytosol were labeled with for 1 minute, then the RNA was extracted and blotted. Only when BP, H2O2, and APEX2 were all present was signal observed. RNase treatment of the sample abolished the signal. (C) RT-qPCR analysis showing specific enrichment of mitochondrial RNAs (grey) over cytosolic mRNAs (white). Cells expressing APEX2 targeted to the mitochondrial matrix were labeled for 1 minute. Biotinylated RNAs were enriched following RNA extraction. Data are the mean of 4 replicates-± 1 standard deviation (S.D.). (D) RT-qPCR analysis showing specific enrichment of secretory (red) over non-secretory (grey) mRNAs with APEX-seq, but not APEX-RIP. Cells stably expressing APEX2 targeted to the ER membrane (facing cytosol) were labeled for 1 minute. For APEX-RIP, RNAs were crosslinked to proteins for 10 minutes before streptavidin beads enrichment. Data are the mean of 4 replicates-± 1 S.D.. The data was normalized such that the mean enrichment of non-secretory RNAs was 1 for both techniques. (E) Human cell showing nine different subcellular locations investigated. (F) Fluorescence imaging of APEX2 localization and biotinylation activity. Live-cell biotinylation was performed for 1 minute in cells stably expressing the indicated APEX2 fusion protein. APEX2 expression was visualized by GFP or antibody staining (green). Biotinylation was visualized by staining with neutravidin-AlexaFluor 647 (red). DAPI is a nuclear marker. Endogenous TOM20 and CANX were used as markers for the mitochondria and ER, respectively. Scale bars, 10 μm.
Figure 2:
Figure 2:. Validation of APEX-seq, including specific orphans from RNA atlas
(A) APEX-seq in the mitochondrial matrix. Transcript abundance in experiment plotted against negative control (omit H2O2). All mRNAs and rRNAs encoded by the mitochondrial genome (large blue dots) are enriched by APEX (mean enrichment > 11-fold). FPKM, fragments per kilobase of transcript per million reads. Due to the 100-nt size selection step during RNA extraction, tRNAs were not efficiently recovered. (B) Scatter plot of transcript abundance in the mitochondrial matrix (MITO. (C) APEX-seq at the ERM, facing cytosol. Volcano plot showing APEX-catalyzed enrichment of secretory mRNAs (red) over non-secretory mRNAs (black). (D) Comparison of ERM-enriched RNAs by APEX-seq, proximity-specific ribosome profiling, and ER fractionation-seq. (E) Transcript abundance (FPKM) analysis of genes enriched by ERM APEX-seq, fractionation-seq, proximity-specific ribosome profiling, and genes unique to the APEX-seq dataset. P-values from a Mann-Whitney U test. (F) Total number of orphans (blue) generated from APEX-seq RNA datasets, with those validated by further polyA+ fractionation-seq shown in black. The source of most of these RNAs is the RNA atlas, with further contributions from analysis of the ERM and OMM transcriptomes. (G) APEX-seq yields cleaner results than bulk fractionation RNA-seq. Nucleus APEX-seq fold changes are highly correlated with bulk fractionation RNA-seq when considering non-ER genes (blue). However, fractionation suffers from contamination by ER transcripts (black). (H) APEX-seq in the cytosol does not recover RNAs coding for mitochondrial proteins, whereas fractionation-seq does. All mRNAs and rRNAs encoded by the mitochondrial genome are shown in blue. P-value is from a Mann-Whitney U test. (I) (K) Sequential smFISH imaging of OMM (I) or ERM (K) orphans in HEK cells. MTND5 was used as a mitochondrial marker. SCD and TSPAN3 were used as ERM markers. mRNAs and IncRNAs not enriched in OMM (I) or ERM (K) were used as negative controls. Expanded views of the boxed region are shown on the right. Scale bar, 5µm. (J) (L) Quantitation of OMM (J) or ERM (L) orphans colocalization with MTND5 (J) or SCD (L) by sequential smFISH imaging. Blue line represent mean from 14 independent fields of view. Data were analyzed using a two-tailed Student’s t test, with *p < 0.05, **p < 0.01, and ***p < 0.001; N.S., not significant (p > 0.05).
Figure 3:
Figure 3:. Analysis of subcellular transcriptome maps
(A) T-distributed stochastic neighbor embedding (t-SNE) plot showing separation and clustering of APEX-seq libraries. (B) Genome tracks for XIST, a nuclear non-coding RNA, and (C) IARS2, an mRNA encoding a mitochondrial tRNA synthetase. For each location, the reads were averaged across two APEX-seq replicates. The control tracks were generated by averaging 18 controls from all 9 constructs. (D) Heatmap of transcripts enriched by APEX-seq showing clustering of the genes that specifically localize to at least one location, and have fold-change data from all locations. (E) Heatmap showing the APEX-seq fold changes for the mRNA transcripts found to be most variable among the locations investigated. (F) Heatmap showing the APEX-seq fold changes for non-coding RNAs (excluding pseudogenes) that have the most-variable localization enrichment. A few well-known noncoding RNAs are shown in bold. (G) Of the ~3250 genes analyzed, most localize to only one or two of the eight locations (excluding mitochondrial matrix) interrogated. (H) Circos plot showing the co-localization of RNAs to multiple locations. (I) Transcripts overlapping in multiple locations. (J) Heatmap showing the protein localization of the transcripts enriched by APEX-seq.
Figure 4:
Figure 4:. APEX-seq reveals principles related to RNA isoforms and introns
(A) (B)(C) The genome tracks of (A) FUS mRNA. (B) and (C) show the genome tracks of two other transcripts, DDX5 and DDX17, with retained introns. (D) Fractionation-seq (green) and nucleus APEX-seq (red) identify roughly the same genes with retained introns. The nuclear-pore APEX-seq transcriptome has fewer retained introns relative to the nucleus. (E) Using APEX-seq, we identify transcripts that are highly abundant in both cytosol and nucleus at the gene level, but switch isoforms at the transcript level. TPM, transcript per million. (F) (G) (H) Browser tracks showing examples of isoform switching across nuclear and cytosolic locations for (F) KAT2A (lysine histone acetyltransferase 2A) in a putative coding sequence (CDS), (G) NCBP3 (nuclear cap-binding protein subunit 3) in the 3′ UTR and (H) HNRNPU (heterogenous nuclear ribonucleoprotein U) in the 5′ UTR respectively. Arrows indicate direction of transcription. (I) Number of m6A present per transcript enriched by APEX-seq. High-confidence m6A sites were obtained from the literature(Meyer et al., 2012). P-values are from a Fisher’s exact test. (J) Cumulative distribution of the introns length for genes enriched by APEX-seq in the nuclear locations. (K) Barplots of average length of nuclear pore and nucleus enriched transcripts by mature transcript length, 5′ UTR, CDS (coding sequence) and 3′ UTR. P-values are from a one-sided Mann-Whitney U test. Errors are standard error of mean.
Figure 5:
Figure 5:. The underlying features of nuclear RNA localization
(A) Examination of retrotransposable elements in transcripts uniquely localizing to different locations show an enrichment of these elements in the nuclear-lamina transcriptome. (B) Heatmap of z-score showing that transcripts localizing to the nucleolus are enriched in rRNA repeat motifs, relative to the nucleus. (C) Within the nuclear locations, the nuclear-lamina-enriched transcripts have a lower abundance relative to both the nucleus and the nucleolus. P-value is from a Mann-Whitney U test. (D) Examination of the genes found in DNA lamina-associated domains (LADs) and nucleolus-associated domains (NADs) confirms that the corresponding transcriptomes are enriched for those genes. Here we restrict analysis to transcripts uniquely-enriched in the respective locations. P-values are from Fisher’s exact tests.
Figure 6:
Figure 6:. Distinct subpopulations of mRNAs at the OMM.
(A) Schematic diagram showing the mitochondria with all perturbations described, including those that affect ribosomes (puromycin (PUR) and cycloheximide (CHX)), mitochondria (carbonyl cyanide m-chlorophenyl hydrazone (CCCP)) and microtubules (nocodazole (NOC)). RNA is shown in blue, ribosomes in grey, and microtubules in green. (B) Gene density distribution of OMM APEX-seq enrichment under different conditions. P-values are from Mann-Whitney U tests. (C) Gene density distribution of ERM APEX-seq enrichment. Genes are categorized as in P-value is from a Mann-Whitney U test. (D) Scatter plot of OMM APEX-seq log2fold-change comparing the basal and CHX conditions. (E) Cumulative fraction of genes in different conditions by TargetP values. CHX treatment shows increased OMM targeting of genes with high Target P values. Genes are categorized by their TargetP values (see Methods) on a scale from 5 (strongest N-terminal mitochondrial targeting peptide) to 0 (no N-terminal mitochondrial targeting peptide). P-values from KS test. (F) Comparing the proportion of transcripts with different TargetP values and average TargetP value among top 100 mitochondrial genes enriched by OMM APEX-seq in cells under different conditions, and all MitoCarta genes. (G) Comparing the proportion of transcripts in different functional classes among top 100 mitochondrial genes enriched by OMM APEX-seq in cells under different conditions, and all MitoCarta genes. Genes are functionally classified according to Gene Ontology. (H) Model summarizing two distinct subpopulations of mitochondrial RNAs proximal to mitochondria. (I) Browser tracks of a mitochondrial gene (HSPA9, targetP = 5) show increased enrichment by OMM-APEX upon CHX treatment. (J) Cumulative fraction of OXPHOS and mitoribosome related genes in different conditions. P-values from KS test. (K) Scheme illustrating the coordinated assembly of respiratory chain complexes and mitoribosomes between the nuclear and mitochondrial genomes. (L) Browser tracks of a mitochondrial ribosomal gene (MRPS18B) that show increased enrichment by OMM-APEX upon PUR/CCCP treatment. (M) Heatmap of fold changes for transcripts enriched by OMM APEX-seq. Upon clustering based on the basal, CHX and PUR conditions, we obtain clusters that are either strongly enriched or depleted in the corresponding mitochondrial proteins.
Figure 7:
Figure 7:. Features of ribosome-dependent and RNA-dependent transcripts at OMM
(A) Based on the effect of PUR and CHX, we binned genes from heatmap (Figure 6M) into two categories: ribosome-dependent and RNA-dependent. (B) ROC curves from an unsupervised random-forest classifier that predicts transcript localization to OMM (versus ERM). To train the classifier, the transcript sequences were divided into 4096 (= 46) 6-mers. Plotted is the mean performance (dark line) and the range from 10-fold cross validation. (C) Same as (B), but using the first 100 coding amino acids (aa) for training. Due to the much larger possible space of aa-variation, we used 3-mers (=223 k-mers) instead of 6-mers for training. (D) Similar model using 6-mer RNA sequences was used to classify transcripts as ribosome-dependent or RNA-dependent. (E) Using the polyA SVM package, which predicts polyadenylation site scores, we find the RNA-dependent transcripts have low polyadenylation scores. (F) Using a polyA tail-length dataset(Subtelny et al., 2014), we found RNA-dependent transcripts have shorter polyA-tail length relative to ribosome-dependent transcripts. P-values from Mann-Whitney U test. (G) Correlation of fold change upon 30-minute NOC treatment (where effect saturates) and the corresponding change upon PUR treatment. Changes are measured relative to basal conditions. (H) Schematic diagram of the time-course APEX-seq protocol. (I) Number of transcripts enriched by OMM-APEX-seq. (J) Progressive depletion of basal OMM transcripts upon NOC treatment. (K) Heatmap of genes enriched by APEX-seq in any of the time points). We clustered on the first 4 times points. (L) Enrichment change as function of NOC treatment time for the three major clusters. Data are median fold change ± 1 sigma. (M) Half-lives for transcripts in Cluster 2.

Similar articles

Cited by

References

    1. Anders S, Pyl PT, and Huber W (2014). HTSeq - a Python framework to work with high-throughput sequencing data (Cold Spring Harbor Laboratory; ). - PMC - PubMed
    1. Anders S, Reyes A, and Huber W (2012). Detecting differential usage of exons from RNA-seq data. Genome Res 22, 2008–2017. - PMC - PubMed
    1. Bahar Halpern K, Caspi I, Lemze D, Levy M, Landen S, Elinav E, Ulitsky I, and Itzkovitz S (2015). Nuclear Retention of mRNA in Mammalian Tissues. Cell Reports 13, 2653–2662. - PMC - PubMed
    1. Battich N, Stoeger T, and Pelkmans L (2015). Control of transcript variability in single mammalian cells. Cell 163, 1596–1610. - PubMed
    1. Berkovits BD, and Mayr C (2015). Alternative 3' UTRs act as scaffolds to regulate membrane protein localization. Nature 522, 363–367. - PMC - PubMed

Publication types