Comparative Study
. 2019 Aug 21;103(4):673-685.e5.
doi: 10.1016/j.neuron.2019.05.037. Epub 2019 Jun 20.

The Autism-Associated Gene Scn2a Contributes to Dendritic Excitability and Synaptic Function in the Prefrontal Cortex

Affiliations
Comparative Study

The Autism-Associated Gene Scn2a Contributes to Dendritic Excitability and Synaptic Function in the Prefrontal Cortex

Perry W E Spratt et al. Neuron. .

Abstract

Autism spectrum disorder (ASD) is strongly associated with de novo gene mutations. One of the most commonly affected genes is SCN2A. ASD-associated SCN2A mutations impair the encoded protein NaV1.2, a sodium channel important for action potential initiation and propagation in developing excitatory cortical neurons. The link between an axonal sodium channel and ASD, a disorder typically attributed to synaptic or transcriptional dysfunction, is unclear. Here we show that NaV1.2 is unexpectedly critical for dendritic excitability and synaptic function in mature pyramidal neurons in addition to regulating early developmental axonal excitability. NaV1.2 loss reduced action potential backpropagation into dendrites, impairing synaptic plasticity and synaptic strength, even when NaV1.2 expression was disrupted in a cell-autonomous fashion late in development. These results reveal a novel dendritic function for NaV1.2, providing insight into cellular mechanisms probably underlying circuit and behavioral dysfunction in ASD.

Keywords: 2-photon imaging; NaV1.2; Scn2a; action potential backpropagation; autism spectrum disorder; dendritic excitability; electrophysiology; haploinsufficiency; intellectual disability; sodium channel; synaptic plasticity.


Figures

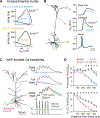
Figure 1:
Figure 1:. Scn2a haploinsufficiency impairs different aspects of neuronal excitability across developmental periods
A: Left, 2-photon laser scanning microscopy (2PLSM) z-stack of developing pyramidal cell (P7). Right, APs generated by current injection (12–44 pA, 300 ms) in Scn2a+/+ (black) and Scn2a+/− (cyan) cells. AP data from neurons recorded at P4. B: Left, 2-photon z-stack of mature thick-tufted pyramidal cell. Right, AP response as in (A). C: APs (spikes) per 300 ms stimulation epoch for each current amplitude. At P4, Scn2a+/− are less excitable (Firing rate slope between 4–44 pA, Scn2a+/+: 0.67 ± 0.07 APs/pA*s, n = 9 cells; Scn2a+/: 0.41 ± 0.07, n = 9 cells, *: p = 0.02, Mann-Whitney). At >P60, no differences are observed between Scn2a+/+ and Scn2a+/− cells (Slope between 50–350 pA: Scn2a+/+: 0.08 ± 0.007 APs/pA*s, n = 12 cells; Scn2a+/−: 0.08 ± 0.005, n = 14 cells, p = 0.96, Mann-Whitney). D: An AP is plotted as voltage vs. time (top) and dV/dt vs voltage (phase-plane plot, bottom). Different phases of the AP are color-coded across panels to indicated different phases of the AP corresponding to initiation of AP in AIS and full detonation of AP in soma. E: Phase-plane plots at P4, P7, P10, and >P60 in Scn2a+/+ and Scn2a+/− cells. Note recovery of AP threshold (kink) deficit between P4 and P10, and decrements in peak dV/dt that become more pronounced with age. F: Top: AP threshold across development from P4–64 (log2 scale for age) in Scn2a+/+ (black) and Scn2a+/− (cyan) mice. Bottom: Peak rising phase dV/dt vs. age. Circles and bars are mean ± SEM within an age group (n = 7–28 cells per group). Data fit with a generalized logistic function with 95% confidence intervals determined from fits to single cells. *: difference in parameters of the sigmoid fits. Top: Left asymptote, Scn2a+/+: −44.1 ± 0.6 mV, Scn2a+/− −35.6 ± 1.6, p < 0.001, unpaired t-test. Bottom: Right asymptote, Scn2a+/+: 587.8 ± 10.2 V/s, Scn2a+/−: 420.3 ± 9.5, p < 0.001, unpaired t-test.
Figure 2:
Figure 2:. Layer 5 parvalbumin and somatostatin neuron APs are not altered in Scn2a+/− mice.
A: 2PLSM single optical section of tdTomato-positive parvalbumin-positive interneuron, overlaid with scanning-DIC image showing pipette in cell-attached configuration. Scale bar: 20 μm. B: Spiking generated from parvalbumin positive cells in Scn2a+/+ and Scn2a+/− mice. C: Phase-plane plots of data shown in (B). D: AP threshold and peak rising dV/dt for the first AP of spike train. Open circles are single cells. Box plots are median, quartiles, and 90% tails. No statistical differences noted. Data obtained from P34–40 animals. E-H: Identical to A-D, but for somatostatin-positive interneurons. Data obtained from P37–38 animals.
Figure 3:
Figure 3:. Scn2a haploinsufficiency impairs dendritic backpropagation of APs
A: Compartmental model of cortical layer 5 pyramidal cell with two distributions of NaV1.2 and NaV1.6 (see Fig. S5 for other model configurations). Top model has NaV1.2 in the proximal AIS, NaV1.6 in the distal AIS, and NaV1.2 and 1.6 equally co-expressed in the somatodendritic compartment. Note reduction in peak rising dV/dt. Bottom model has NaV1.2 in the proximal AIS only, with NaV1.6 in the somatodendritic and distal AIS compartments. Removal of half the NaV1.2 channels results in only minor changes to AP phase-plane. B: A single AP evoked in the top model in (A), backpropagating throughout dendrite. More marked differences in AP shape observed in more distal dendritic locations. C: 2PLSM calcium imaging throughout apical dendrite of L5 thick-tufted neuron. Calcium transients evoked by bursts of AP doublets. D: Transient amplitude is plotted for the first of 5 bursts (top) and area under the curve from stimulus onset to stimulus offset +100 ms (bottom) in Scn2a+/+ (n = 10), Scn2a+/− (n = 8 cells), and Scn2a+/+ cells treated with 5 nM TTX (n = 5). Circles and bars are means ± SEM. *: p < 0.05, Kruskal-Wallis test.
Figure 4:
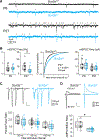
Figure 4:. Scn2a haploinsufficiency disrupts excitatory synapse function
A: mEPSCs recorded in Scn2a+/+ (black) and Scn2a+/− (cyan) pyramidal cells at P6 and P27. Tick marks denote detected events. B: Left, average mEPSC frequency per cell (open circles). Box plots are median, quartiles, and 90% tails. Note that frequency range is different for P6 and P27. Middle, cumulative probability distribution of mEPSC event intervals at P27. Distributions were generated per cell, then averaged. Bars are SEM. p < 0.0001, Kolmogorov-Smirnov test. Right, average mEPSC amplitude per cell. C: Paired pulse ratio of evoked excitatory inputs to Scn2a+/+ (black) and Scn2a+/− (cyan) pyramidal cells at 3 different stimulus intervals. Bottom, summary grouped by inter-stimulus interval. No differences noted. D: Top, AMPA receptor-mediated and mixed AMPA/NMDA receptor-mediated evoked EPSCs at −80 and +30 mV, respectively. Dashed line denotes time at which NMDA receptor-mediated component was calculated. Bottom, AMPA-NMDA ratio in Scn2a+/+ and Scn2a+/− neurons. * p < 0.01, Mann-Whitney.
Figure 5:
Figure 5:. Dendritic spines are morphologically immature in Scn2a+/− cells
A: Examples of dendritic morphology in P22–25 Scn2a+/+ (black) and Scn2a+/− (cyan) pyramidal cells. B: Overall dendrite length and branch points in apical and basal trees. Open circles are single cells. Box plots are median, quartiles, and 90% tails. (Scn2a+/+: n = 10 cells; Scn2a+/−: n = 10 cells). No differences across genotype noted. C: Examples of spines along apical dendrites of immature (P5–6) and more mature (P24–36) neurons. D: Overall spine length from shaft to spine head, volume of spine head relative to total volume of head and shaft, and number of spines per length of dendrite were measured in apical dendrites of P5–6 neurons (n = 560–685 spines per group, 1–4 dendritic branches per cells, 10 cells per group; note that basal dendrites often lacked spines at this age and were therefore not assessed). Spines along both apical and basal dendrites were imaged in P24–36 neurons (n = 500–600 spines per group, 1–3 dendritic branches per cell, 6 cells per group). *: p < 0.05, Mann-Whitney.
Figure 6:
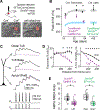
Figure 6:. Inducing Scn2a haploinsufficiency late in development disrupts dendritic excitability, AP backpropagation, and synaptic stability.
A: Scn2a+/fl mice were injected with a dilute Cre virus, infecting a subset of neurons in PFC. Images are single 2PLSM optical section of transmitted laser light (“scanning-DIC”) and mCherry fluorescence (red). Left, dashed circles highlight two neighboring Cre+ and Cre- neurons. Right, Cre+ neuron targeted for whole-cell recording with pipette from left-hand side. Image taken while in cell-attached configuration. B: Peak dV/dt vs age in conditional Scn2a mice. dVdt measurements were made from CaMKII::Scn2a+/fl or Scn2a+/+ mice at several ages and compared to developmental curve derived from constitutive mice. Note overlap with wild-type developmental curve at P18 and eventual overlap with Scn2a+/− curve at >P50 for CaMKII::Scn2a+/fl neurons. Neurons in Scn2a+/fl mice injected with dilute Cre virus were assessed after P55. Circles and bars are means ± SEM. *: p < 0.01, Mann-Whitney. C: Dendritic calcium imaging as in Fig. 2C, except in CaMKII::Scn2a+/fl or +/+ cells. D: Transient amplitude is plotted for the first of 5 bursts (left) and area under the curve from stimulus onset to stimulus onset + 500ms (right) in CaMKII::Scn2a+/+ (n = 9 cells) or CaMKII::Scn2a+/− (n = 8 cells). Circles and bars are means ± SEM. *: p < 0.05, Mann-Whitney. E: AMPA:NMDA ratio between CaMK-Cre:Scn2a+/+ and Scn2a+/fl littermates, and between Cre+ and Cre- neurons in Scn2a+/fl mice injected with EF1α-Cre. *: p < 0.05, Mann-Whitney.
Figure 7:
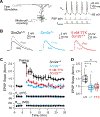
Figure 7:. Scn2a haploinsufficiency impairs synaptic plasticity
A: Recording configuration for burst-based LTP experiments. Stimulating electrode was placed in layer 1 and synaptic stimulation was paired with somatic current-evoked AP bursts. B: Example of EPSPs before and after LTP pairing protocol. Lighter shades are post-induction data (15–25 minutes after pairing). Stimulus artifact removed for clarity. C: EPSP slope (first 2 ms), membrane potential (Vm) and input resistance (Rin) vs time before and after LTP induction. Circles and bars are mean ± SEM. D: EPSC slope per cell in Scn2a+/+ cells with and without TTX and Scn2a+/− cells. *: p = 0.0002, Kruskal-Wallis test; WT vs Scn2a+/−: p = 0.0007, WT vs TTX: p = 0.002, Dunn’s multiple comparisons test.

Comment in

References

    1. Ariav G, Polsky A, and Schiller J. (2003). Submillisecond precision of the input-output transformation function mediated by fast sodium dendritic spikes in basal dendrites of CA1 pyramidal neurons. J. Neurosci 23, 7750–7758. - PMC - PubMed
    1. Barth AMI, Vizi ES, Zelles T, and Lendvai B. (2008). α 2 -Adrenergic Receptors Modify Dendritic Spike Generation Via HCN Channels in the Prefrontal Cortex. J. Neurophysiol 99, 394–401. - PubMed
    1. Bateup HS, Takasaki KT, Saulnier JL, Denefrio CL, and Sabatini BL (2011). Loss of Tsc1 in vivo impairs hippocampal mGluR-LTD and increases excitatory synaptic function. J. Neurosci 31, 8862–8869. - PMC - PubMed
    1. Bean BP (2007). The action potential in mammalian central neurons. Nat. Rev. Neurosci 8, 451–465. - PubMed
    1. Beaulieu-Laroche L, and Harnett MT (2018). Dendritic Spines Prevent Synaptic Voltage Clamp. Neuron 97, 75–82.e3. - PubMed

Publication types

MeSH terms

Substances