. 2019 Jul:45:379-392.
doi: 10.1016/j.ebiom.2019.06.018. Epub 2019 Jun 21.

The R941L mutation in MYH14 disrupts mitochondrial fission and associates with peripheral neuropathy

Affiliations

The R941L mutation in MYH14 disrupts mitochondrial fission and associates with peripheral neuropathy

Walaa Almutawa et al. EBioMedicine. 2019 Jul.

Abstract

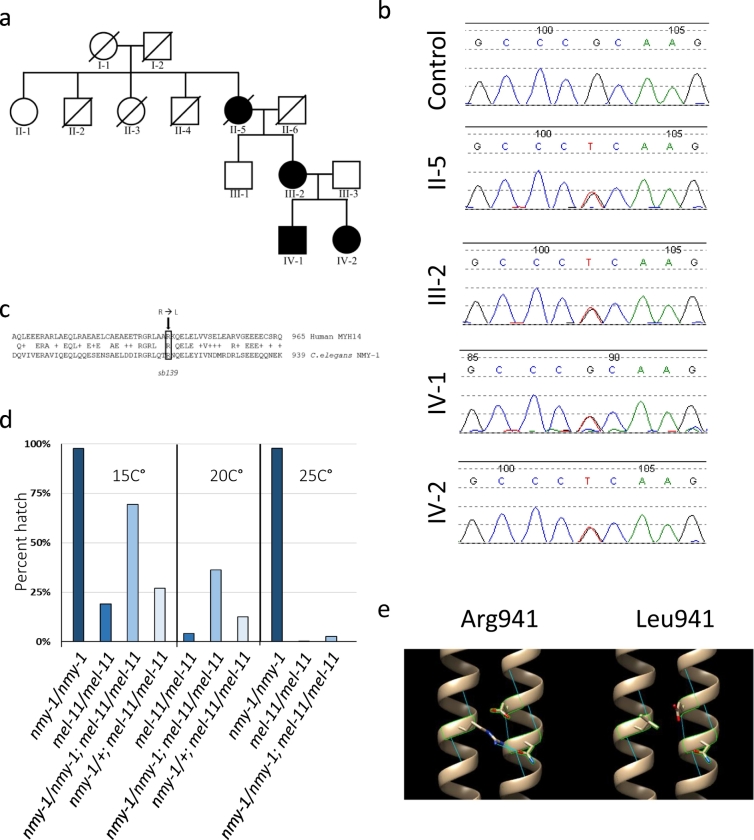
Background: Peripheral neuropathies are often caused by disruption of genes responsible for myelination or axonal transport. In particular, impairment in mitochondrial fission and fusion are known causes of peripheral neuropathies. However, the causal mechanisms for peripheral neuropathy gene mutations are not always known. While loss of function mutations in MYH14 typically cause non-syndromic hearing loss, the recently described R941L mutation in MYH14, encoding the non-muscle myosin protein isoform NMIIC, leads to a complex clinical presentation with an unexplained peripheral neuropathy phenotype.

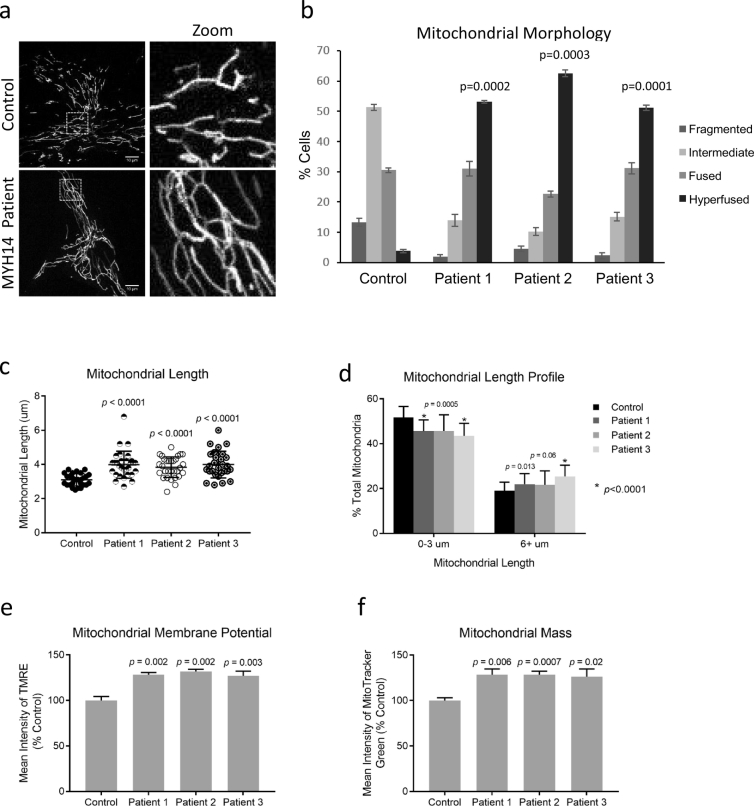
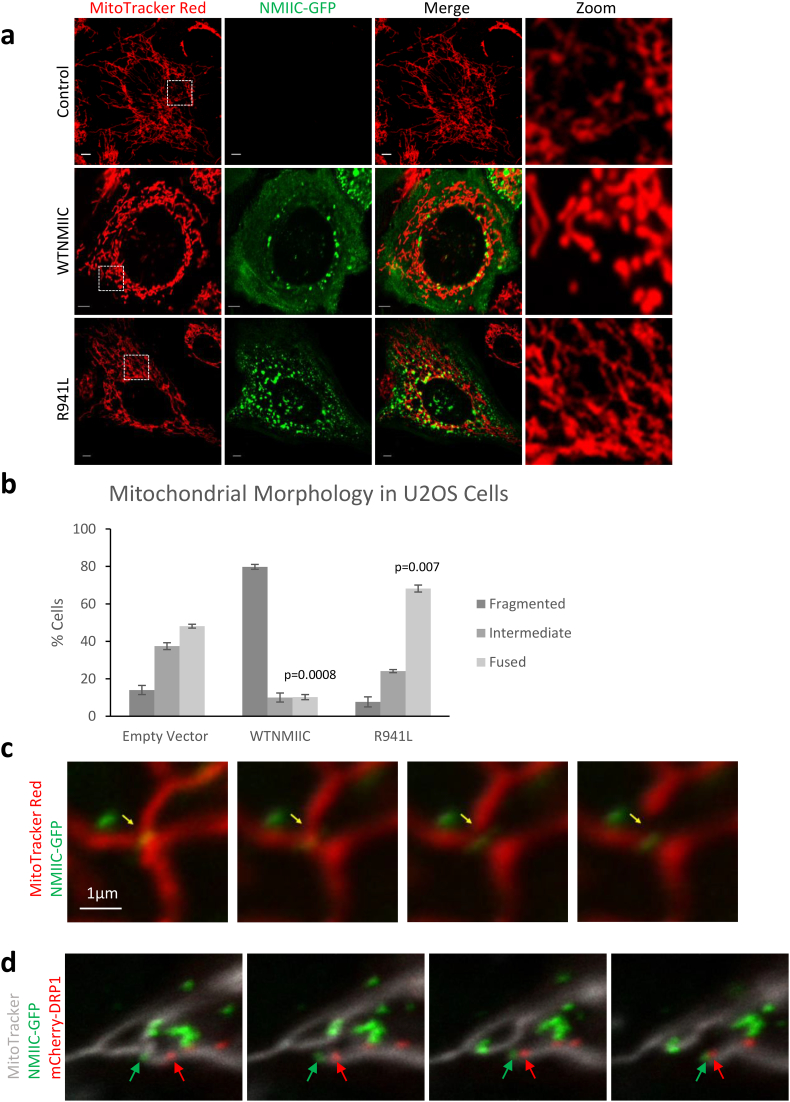
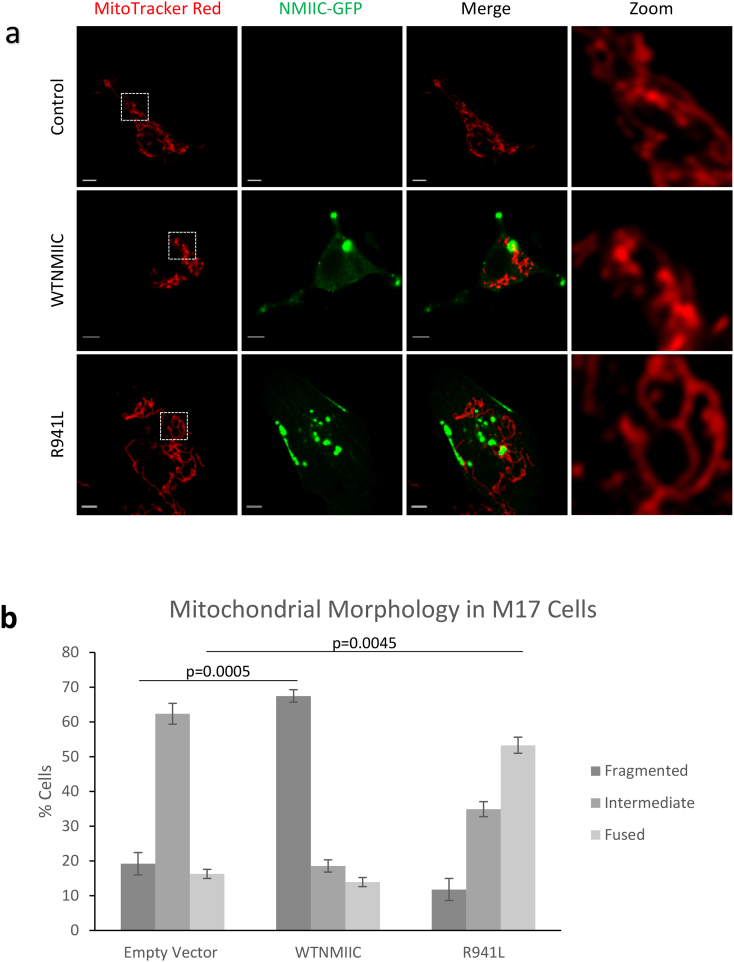
Methods: Confocal microscopy was used to examine mitochondrial dynamics in MYH14 patient fibroblast cells, as well as U2OS and M17 cells overexpressing NMIIC. The consequence of the R941L mutation on myosin activity was modeled in C. elegans.

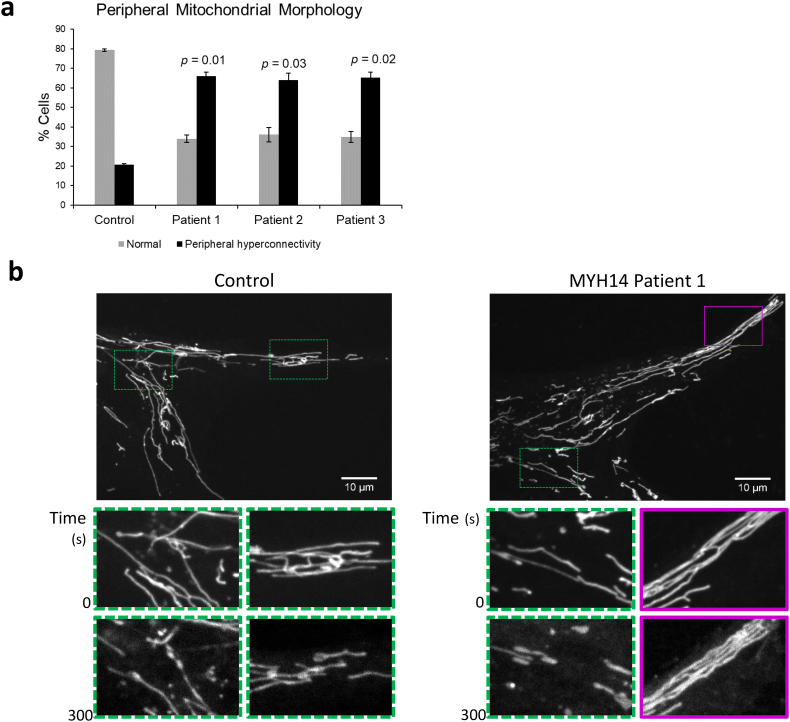
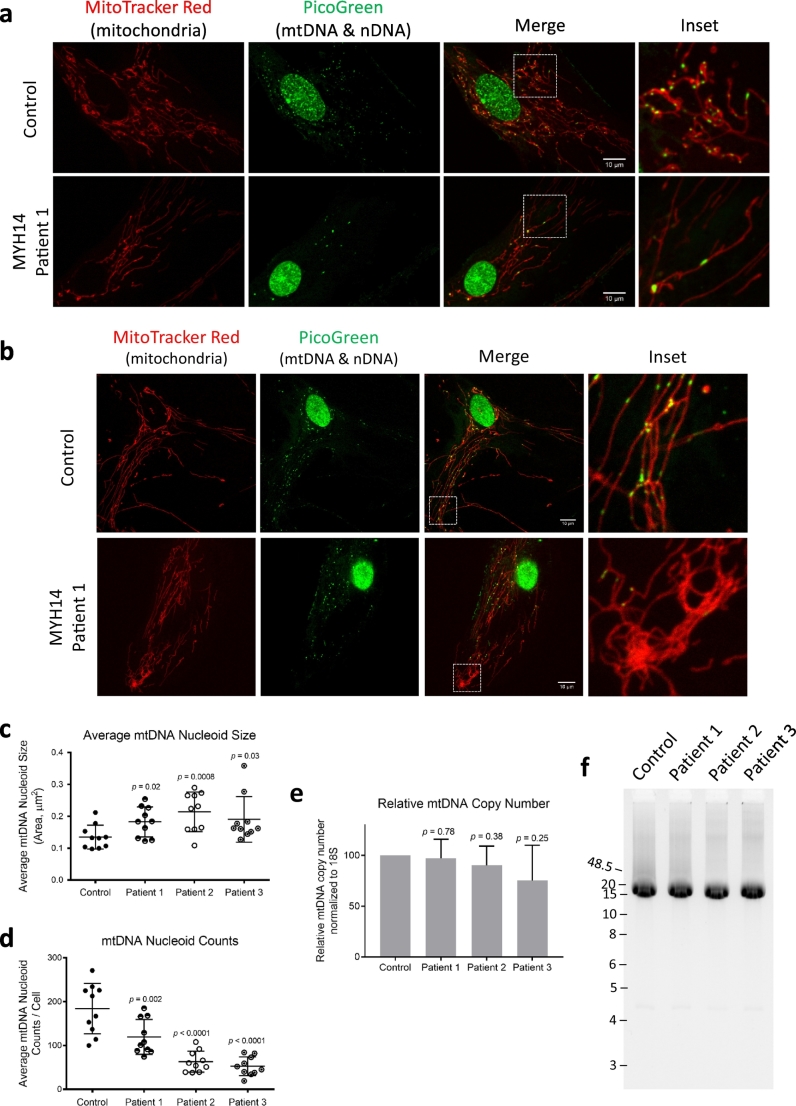
Findings: We describe the third family carrying the R941L mutation in MYH14, and demonstrate that the R941L mutation impairs non-muscle myosin protein function. To better understand the molecular basis of the peripheral neuropathy phenotype associated with the R941L mutation, which has been hindered by the fact that NMIIC is largely uncharacterized, we have established a previously unrecognized biological role for NMIIC in mediating mitochondrial fission in human cells. Notably, the R941L mutation acts in a dominant-negative fashion to inhibit mitochondrial fission, especially in the cell periphery. In addition, we observed alterations to the organization of the mitochondrial genome.

Interpretation: As impairments in mitochondrial fission cause peripheral neuropathy, this insight into the function of NMIIC likely explains the peripheral neuropathy phenotype associated with the R941L mutation. FUND: This study was supported by the Alberta Children's Hospital Research Institute, the Canadian Institutes of Health Research and the Care4Rare Canada Consortium.

Keywords: Caenorhabditis elegans; Mitochondria; Mitochondrial fission; Non-muscle myosin; Peripheral neuropathy; mtDNA.


Figures

Fig. 1
Fig. 1
Genetic analysis of patients and modeling of the R941L mutation. (a) Pedigree of a three generation family with peripheral neuropathy and hearing loss. Shaded sections indicate the presence of both CMT and hearing loss, which were always seen together in the pedigree. Exome sequencing was performed on individuals II-5, III-2 and IV-2. The c.2822G>T p.Arg941Leu mutation was identified in individuals II-5, III-2, IV-1 and IV-2. Note that for subsequent fibroblast studies individuals III-2, IV-1, and IV-2 are patients 1–3, respectively. (b) Sanger sequencing confirms the presence of the c.2822G>T p.Arg941Leu mutation in individuals II-5, III-2, IV-1 and IV-2. (c) Alignment of the human and worm genes showing the conservation in the region surrounding MYH14 R941, which corresponds to R915 of the worm gene. (d) The R915L mutation in C. elegans NMY-1 decreases nonmuscle myosin function. nmy-1(sb139) acts semidominantly at all three temperatures to increase the hatching rate of mel-11 mutations, indicating that sb139/R195L compromises NMY-1 function (the 2.6% hatching at 25° was significant as it represented 25/936 vs. 2/938 for the control). The 27% viability of nmy-1(sb139)/+; mel-11/mel-11 embryos at 15 °C was inferred from the hatching rates of the progeny of mothers of that genotype. These animals segregate a mixture of nmy-1(sb139) homozygotes and heterozygotes, as well as nmy-1(+) homozygotes in a Mendelian 1:2:1 ratio. The hatching rates of homozygous nmy-1(sb139) and nmy-1(+) embryos in the mel-11/mel-11 background are 69% and 19%, respectively. We observed 36% hatching from nmy-1(sb139)/+; mel-11/mel-11 mothers and this corresponds to 27% hatching of their heterozygous offspring, an increase above the 19% hatching nmy-1(+)/nmy-1(+); mel-11/mel-11. Similar calculations demonstrated the semidominance at 20 °C. (e) In silico protein modeling suggests that the wild-type arginine residue at position 941 (left) has hydrophilic interactions with residues on an adjacent alpha-helix during dimerization. The mutant leucine residue (right) is unable to form the same hydrophilic interactions with the opposite myosin chain.
Fig. 2
Fig. 2
R941L Patient Fibroblasts have altered mitochondrial morphology. (a) Representative confocal images of mitochondrial networks taken with an Olympus SD-OSR microscope. Mitochondria in fixed control and patient cells were stained via immunofluorescence using a TOMM20 antibody. Scale bars indicate 10 μm. (b) Quantification of mitochondrial morphology in control fibroblast and R941L patient fibroblast cells. One hundred cells were quantified in three technical replicates for two independent experimental replicates. Error bars indicate standard deviations, while p-values (Student's t-test) were determined by comparison to the number of cells with hyperfused mitochondria in control. (c) Quantification of average mitochondrial length. Data represents automated analyses from at least 30 cells per fibroblast line. (d) Mitochondrial length profile from cells in (c), binned into 0–3 and 6+ μm bins and presented as % of total mitochondria. (e) Mitochondrial membrane potential in control and patient fibroblasts measured with flow cytometry analysis of TMRE-stained cells. (f) Mitochondrial mass measured in MitoTracker Green stained samples by flow cytometry. Data for (e) and (f) are presented as % control. Error bars indicate standard deviations, and p-values (Student's t-test) determined by comparison to the control. (For interpretation of the references to colour in this figure legend, the reader is referred to the web version of this article.)
Fig. 3
Fig. 3
Hyperconnected mitochondrial networks at the cell periphery in R941L patient fibroblasts are resistant to phototoxicity-induced fission. (a) Quantification of control and patient cells containing hyperconnected mitochondrial networks at the cell periphery. At least 70 cells were quantified from two independent replicates. Error bars indicate standard deviations, and p-values (Student's t-test) were determined by comparison to the number of control cells with hyperfused mitochondria. (b) Representative confocal images of mitochondrial networks taken with an Olympus SD-OSR microscope. Control and patient cells stained with MitoTracker Red were imaged continuously over 5 min with high laser power to induce fission. Inset zoomed boxes represent regions with fragmented mitochondria (green hashed boxes) or resistant to fission (magenta hashed boxes) when imaging commenced, and at the end of 5 min (full video available as Supplemental Video 1). Signal intensity was enhanced for later frames to adjust for photobleaching. Scale bars indicate 10 μm. (For interpretation of the references to colour in this figure legend, the reader is referred to the web version of this article.) Hyperconnected mitochondrial networks at the cell periphery in R941L patient fibroblasts are resistant to phototoxicity-induced fission. (a) Quantification of control and patient cells containing hyperconnected mitochondrial networks at the cell periphery. At least 70 cells were quantified from two independent replicates. Error bars indicate standard deviations, and p-values (Student's t-test) were determined by comparison to the number of control cells with hyperfused mitochondria. (b) Representative confocal images of mitochondrial networks taken with an Olympus SD-OSR microscope. Control and patient cells stained with MitoTracker Red were imaged continuously over 5 min with high laser power to induce fission. Inset zoomed boxes represent regions with fragmented mitochondria (green hashed boxes) or resistant to fission (magenta hashed boxes) when imaging commenced, and at the end of 5 min (full video available as Supplemental Video 1). Signal intensity was enhanced for later frames to adjust for photobleaching. Scale bars indicate 10 μm. (For interpretation of the references to colour in this figure legend, the reader is referred to the web version of this article.)
Fig. 4
Fig. 4
Altered mtDNA nucleoids in R941L patient fibroblasts. (a) Representative confocal images of control and patient fibroblast cells taken with an Olympus SD-OSR microscope. Live cells were stained with MitoTracker Red (Red, mitochondria) and PicoGreen (Green, nuclear and mitochondrial DNA). Scale bars indicate 10 μm.. (b) Representative confocal images of peripheral mitochondria and nucleoids as in (a). Quantification of nucleoid size (c) and number (d) from 10 cells for each line. (e) Copy number of mtDNA as determined by quantitative PCR. Error bars indicate standard deviations, and p-values (Student's t-test) were determined by comparison to control fibroblasts. (f) Long range PCR of mtDNA in control and patient fibroblasts showing 16.3 kb amplicons and no mtDNA deletions. (For interpretation of the references to colour in this figure legend, the reader is referred to the web version of this article.)
Fig. 5
Fig. 5
NMIIC puncta localize to mitochondria at sites of mitochondrial fission. (a) Representative confocal images from live U2OS cells transfected with empty vector (control) or NMIIC-EGFP constructs (WTNMIIC = wild-type, R941L = mutant). Mitochondria were stained with Mitotracker Red, and the EGFP signal represents wild-type or R941L mutant NMIIC. Images were captured with a Zeiss LSM microscope. Scale bars indicate 5 μm. (b) Quantification of mitochondrial morphology in U2OS cells transfected as in (a). One hundred cells were quantified in three technical replicates for each of three independent biological replicates. Error bars indicate standard deviations, and p-values (Student's t-test) were determined by comparison to the number of cells with hyperfused mitochondria in the empty vector control. (c) A subset of NMIIC-EGFP puncta co-localize with mitochondria at sites of fission. Single frames from live cell imaging of wild-type NMIIC as described in (a), with yellow arrow indicating fission site (full video available as Supplemental Video 2). (d) NMIIC puncta at fission sites precede Drp1 recruitment and fission. Single frames from live cell imaging of U2OS cell transfected with wild-type NMIIC-EGFP (green), mCherry-DRP1 (red), and mitochondria stained with Mitotracker DeepRed (grey) (full video available as Supplemental Video 3). Green arrow denotes the NMIIC puncta at the site of fusion. Red arrow indicates the DRP1 recruited to the site of fission. (For interpretation of the references to colour in this figure legend, the reader is referred to the web version of this article.) NMIIC puncta localize to mitochondria at sites of mitochondrial fission. (a) Representative confocal images from live U2OS cells transfected with empty vector (control) or NMIIC-EGFP constructs (WTNMIIC = wild-type, R941L = mutant). Mitochondria were stained with Mitotracker Red, and the EGFP signal represents wild-type or R941L mutant NMIIC. Images were captured with a Zeiss LSM microscope. Scale bars indicate 5 μm. (b) Quantification of mitochondrial morphology in U2OS cells transfected as in (a). One hundred cells were quantified in three technical replicates for each of three independent biological replicates. Error bars indicate standard deviations, and p-values (Student's t-test) were determined by comparison to the number of cells with hyperfused mitochondria in the empty vector control. (c) A subset of NMIIC-EGFP puncta co-localize with mitochondria at sites of fission. Single frames from live cell imaging of wild-type NMIIC as described in (a), with yellow arrow indicating fission site (full video available as Supplemental Video 2). (d) NMIIC puncta at fission sites precede Drp1 recruitment and fission. Single frames from live cell imaging of U2OS cell transfected with wild-type NMIIC-EGFP (green), mCherry-DRP1 (red), and mitochondria stained with Mitotracker DeepRed (grey) (full video available as Supplemental Video 3). Green arrow denotes the NMIIC puncta at the site of fusion. Red arrow indicates the DRP1 recruited to the site of fission. (For interpretation of the references to colour in this figure legend, the reader is referred to the web version of this article.)
Fig. 6
Fig. 6
The R941L NMIIC does not promote mitochondrial fission in differentiated M17 neuronal cells. (a) Representative confocal images of live M17 cells transfected with empty vector (control) or NMIIC-EGFP constructs (WTNMIIC = wild-type, R941L = mutant). Mitochondria were stained with MitoTracker Red, and the EGFP signal represents wild-type or R941L mutant NMIIC. Images were captured with a Zeiss LSM microscope. Scale bars indicate 10 μm. (b) Quantification of mitochondrial morphology in differentiated M17 cells as transfected as in (a). At least 40 cells were quantified in two independent experimental replicates. Error bars indicate standard deviations, and p-values (Student's t-test) were determined by comparison to the number of cells with fragmented or fused mitochondrial networks (as indicated) in the empty vector control. (For interpretation of the references to colour in this figure legend, the reader is referred to the web version of this article.)

Comment in

References

    1. Pareyson D., Saveri P., Sagnelli A., Piscosquito G. Mitochondrial dynamics and inherited peripheral nerve diseases. Neurosci Lett. 2015;596:66–77. - PubMed
    1. Chen H., Chan D.C. Mitochondrial dynamics–fusion, fission, movement, and mitophagy–in neurodegenerative diseases. Hum Mol Genet. 2009;18(R2):R169–R176. - PMC - PubMed
    1. Friedman J.R., Lackner L.L., West M., DiBenedetto J.R., Nunnari J., Voeltz G.K. ER tubules mark sites of mitochondrial division. Science. 2011;334(6054):358–362. - PMC - PubMed
    1. Kraus F., Ryan M.T. The constriction and scission machineries involved in mitochondrial fission. J Cell Sci. 2017;130(18):2953–2960. - PubMed
    1. Lee J.E., Westrate L.M., Wu H., Page C., Voeltz G.K. Multiple dynamin family members collaborate to drive mitochondrial division. Nature. 2016;540(7631):139–143. - PMC - PubMed

MeSH terms