

Rapid Irreversible Transcriptional Reprogramming in Human Stem Cells Accompanied by Discordance between Replication Timing and Chromatin Compartment
- PMID: 31231024
- PMCID: PMC6627004
- DOI: 10.1016/j.stemcr.2019.05.021
Rapid Irreversible Transcriptional Reprogramming in Human Stem Cells Accompanied by Discordance between Replication Timing and Chromatin Compartment
Abstract
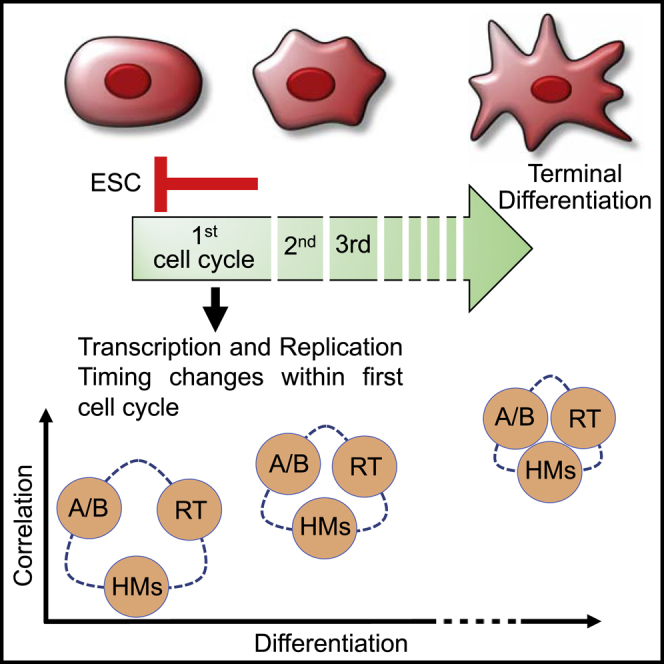
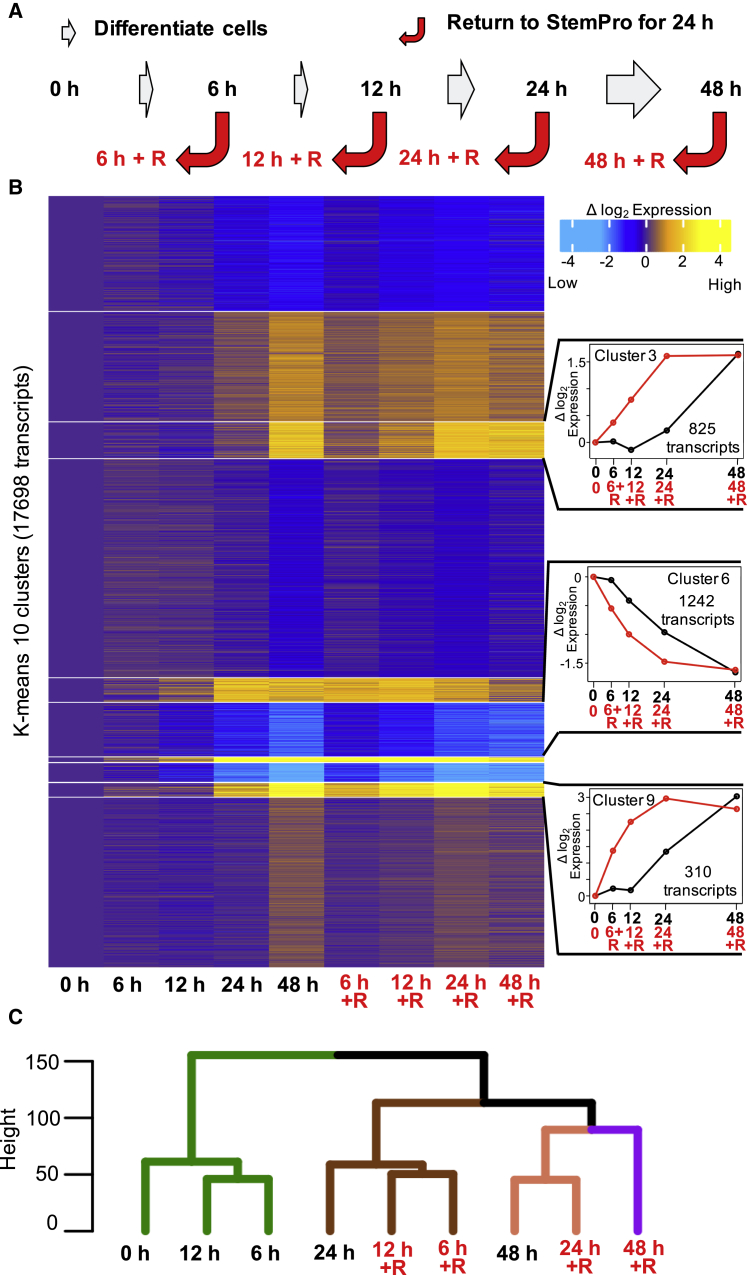
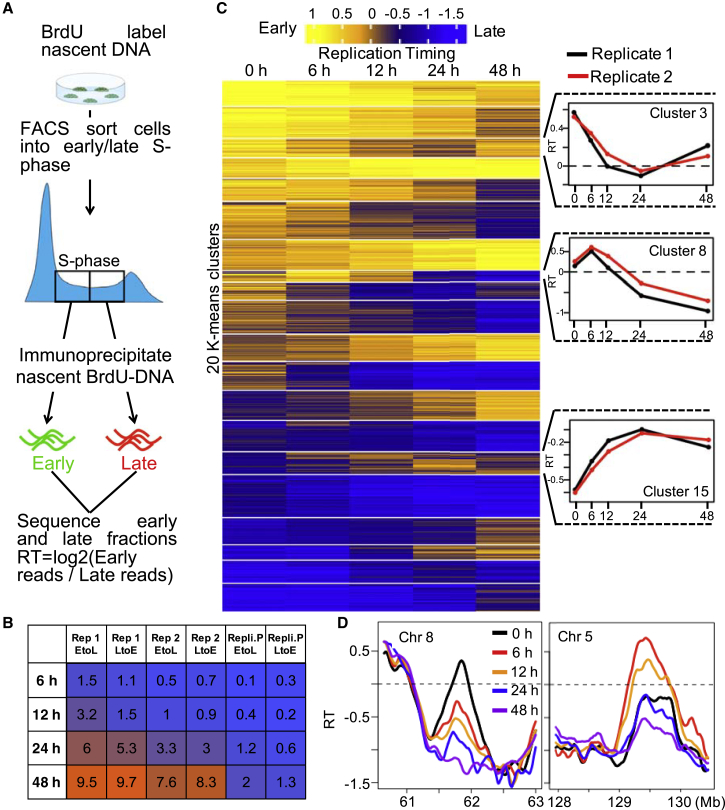
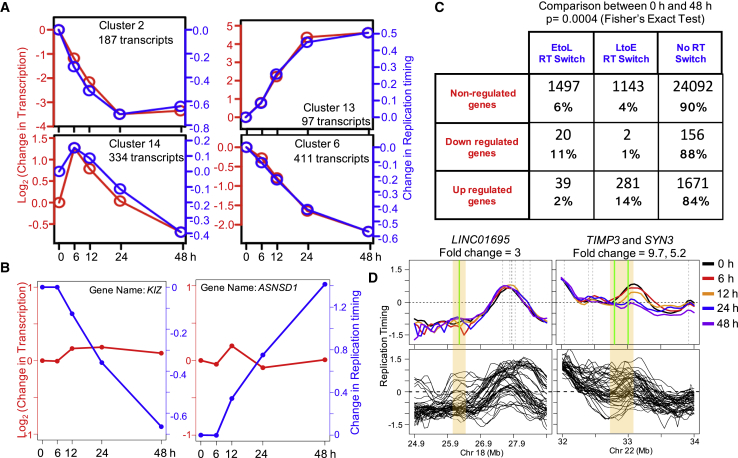
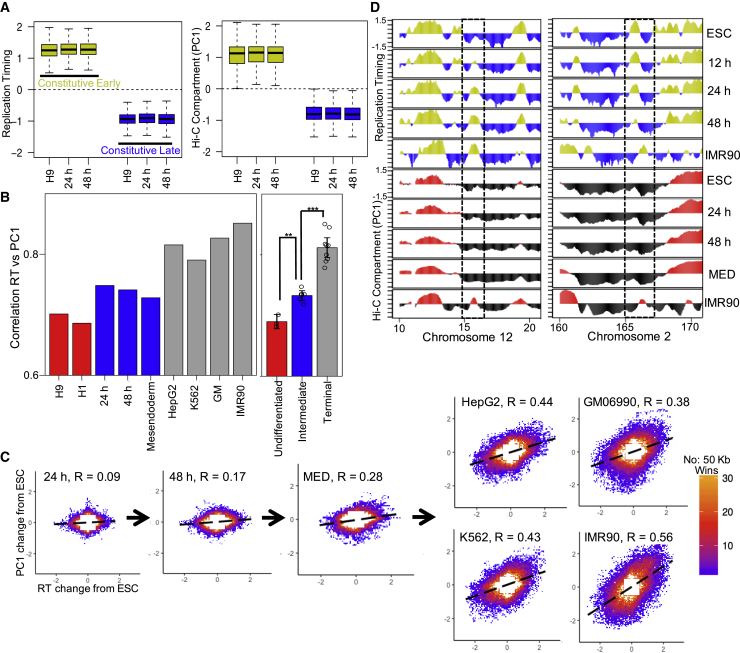
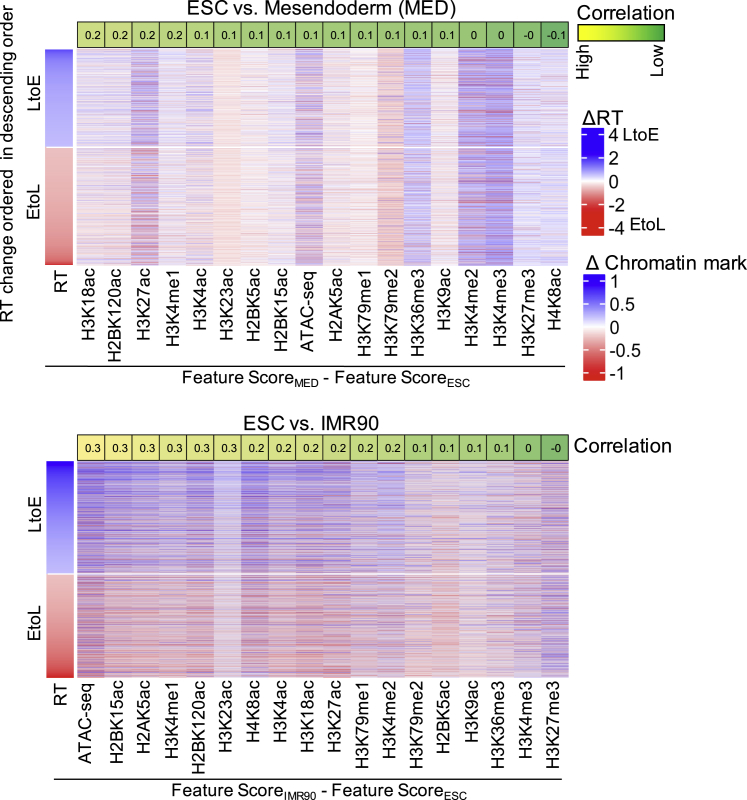
The temporal order of DNA replication is regulated during development and is highly correlated with gene expression, histone modifications and 3D genome architecture. We tracked changes in replication timing, gene expression, and chromatin conformation capture (Hi-C) A/B compartments over the first two cell cycles during differentiation of human embryonic stem cells to definitive endoderm. Remarkably, transcriptional programs were irreversibly reprogrammed within the first cell cycle and were largely but not universally coordinated with replication timing changes. Moreover, changes in A/B compartment and several histone modifications that normally correlate strongly with replication timing showed weak correlation during the early cell cycles of differentiation but showed increased alignment in later differentiation stages and in terminally differentiated cell lines. Thus, epigenetic cell fate transitions during early differentiation can occur despite dynamic and discordant changes in otherwise highly correlated genomic properties.
Keywords: chromatin 3D architecture; chromatin 3D organization; chromatin structure; differentiation; gene expression; lineage commitment; replication timing.
Copyright © 2019 The Author(s). Published by Elsevier Inc. All rights reserved.
Figures
Similar articles
-
Genome-wide dynamics of replication timing revealed by in vitro models of mouse embryogenesis.Genome Res. 2010 Feb;20(2):155-69. doi: 10.1101/gr.099796.109. Epub 2009 Dec 1. Genome Res. 2010. PMID: 19952138 Free PMC article.
-
Allele-specific control of replication timing and genome organization during development.Genome Res. 2018 Jun;28(6):800-811. doi: 10.1101/gr.232561.117. Epub 2018 May 7. Genome Res. 2018. PMID: 29735606 Free PMC article.
-
Evolutionarily conserved replication timing profiles predict long-range chromatin interactions and distinguish closely related cell types.Genome Res. 2010 Jun;20(6):761-70. doi: 10.1101/gr.099655.109. Epub 2010 Apr 29. Genome Res. 2010. PMID: 20430782 Free PMC article.
-
Programming the genome in embryonic and somatic stem cells.J Cell Mol Med. 2007 Jul-Aug;11(4):602-20. doi: 10.1111/j.1582-4934.2007.00079.x. J Cell Mol Med. 2007. PMID: 17760828 Free PMC article. Review.
-
Emerging roles of the histone chaperone CAF-1 in cellular plasticity.Curr Opin Genet Dev. 2017 Oct;46:83-94. doi: 10.1016/j.gde.2017.06.004. Epub 2017 Jul 7. Curr Opin Genet Dev. 2017. PMID: 28692904 Free PMC article. Review.
Cited by
-
Genome architecture plasticity underlies DNA replication timing dynamics in cell differentiation.Front Genet. 2022 Sep 2;13:961612. doi: 10.3389/fgene.2022.961612. eCollection 2022. Front Genet. 2022. PMID: 36118849 Free PMC article.
-
HiCRes: a computational method to estimate and predict the genomic resolution of Hi-C libraries.Nucleic Acids Res. 2022 Apr 8;50(6):e35. doi: 10.1093/nar/gkab1235. Nucleic Acids Res. 2022. PMID: 34928367 Free PMC article.
-
Distinct molecular profile and restricted stem cell potential defines the prospective human cranial neural crest from embryonic stem cell state.Stem Cell Res. 2020 Dec;49:102086. doi: 10.1016/j.scr.2020.102086. Epub 2020 Nov 11. Stem Cell Res. 2020. PMID: 33370869 Free PMC article.
-
Computational Stem Cell Biology: Open Questions and Guiding Principles.Cell Stem Cell. 2021 Jan 7;28(1):20-32. doi: 10.1016/j.stem.2020.12.012. Cell Stem Cell. 2021. PMID: 33417869 Free PMC article. Review.
-
Distinctive epigenomic alterations in NF1-deficient cutaneous and plexiform neurofibromas drive differential MKK/p38 signaling.Epigenetics Chromatin. 2021 Jan 13;14(1):7. doi: 10.1186/s13072-020-00380-6. Epigenetics Chromatin. 2021. PMID: 33436083 Free PMC article.
References
-
- Barr M.L., Bertram E.G. A morphological distinction between neurones of the male and female, and the behaviour of the nucleolar satellite during accelerated nucleoprotein synthesis. Nature. 1949;163:676. - PubMed
Publication types
MeSH terms
Substances
Grants and funding
LinkOut - more resources
Full Text Sources
Medical
Molecular Biology Databases
