. 2019 Jul 16;51(1):119-130.e5.
doi: 10.1016/j.immuni.2019.05.010. Epub 2019 Jun 20.

A Stromal Niche Defined by Expression of the Transcription Factor WT1 Mediates Programming and Homeostasis of Cavity-Resident Macrophages

Affiliations

A Stromal Niche Defined by Expression of the Transcription Factor WT1 Mediates Programming and Homeostasis of Cavity-Resident Macrophages

Matthew B Buechler et al. Immunity. .

Abstract

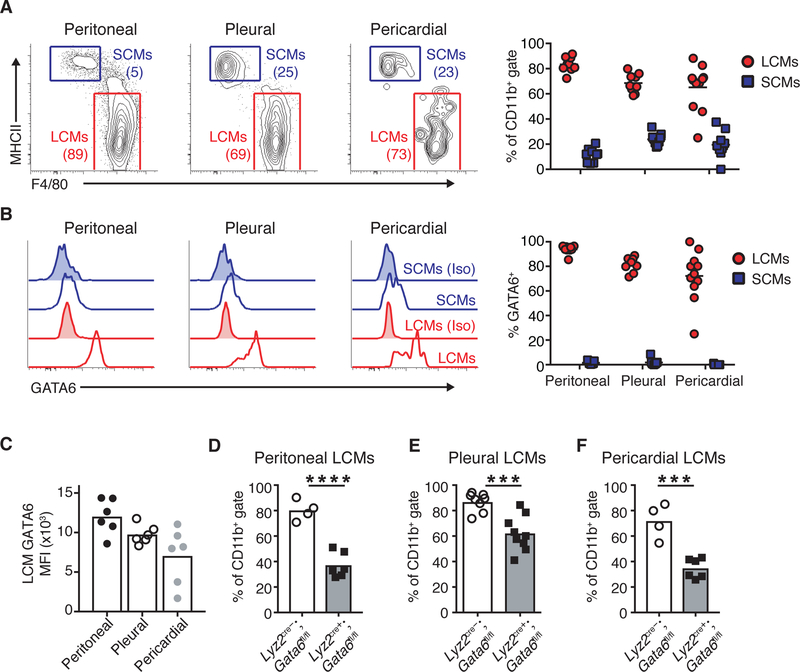
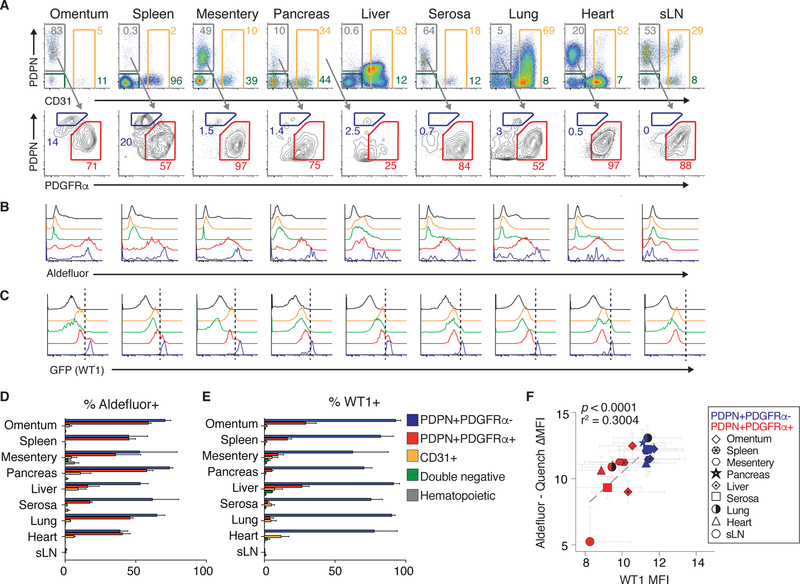
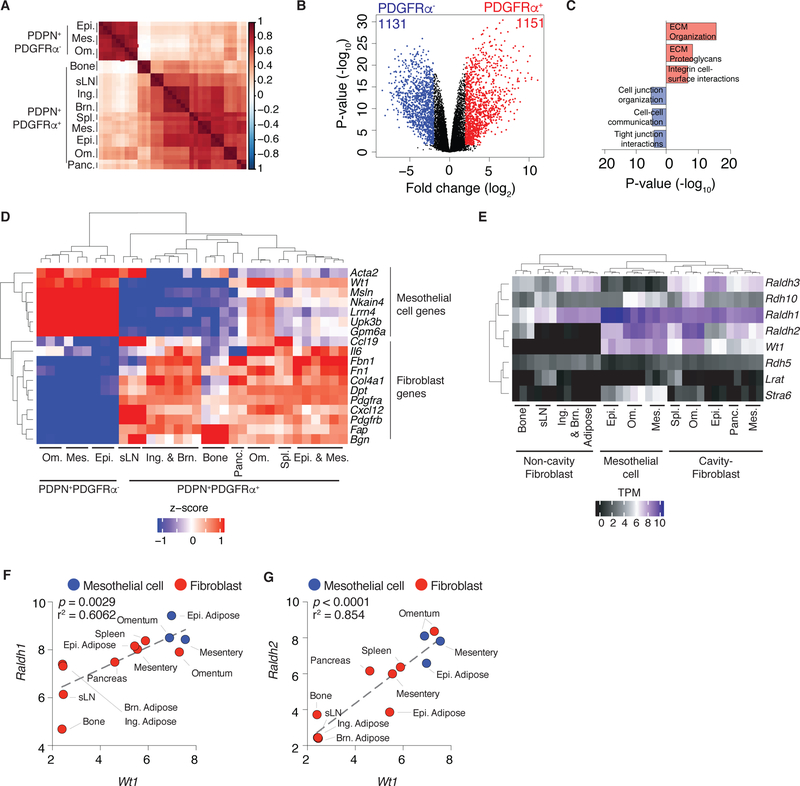
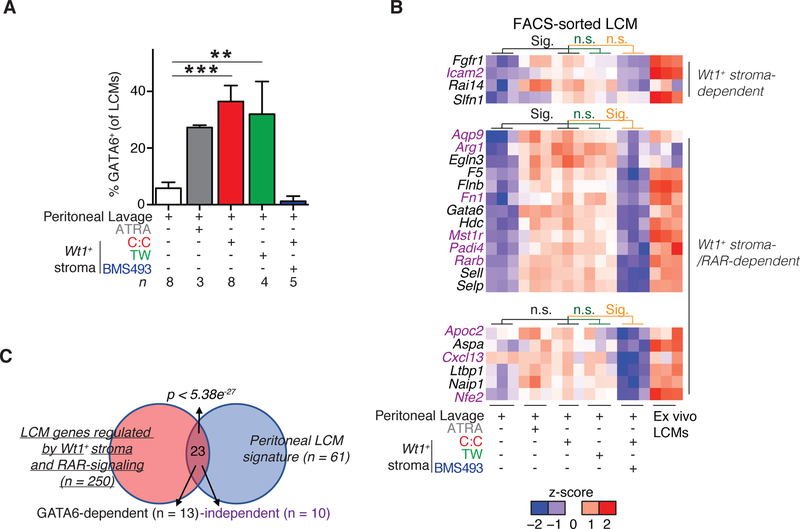
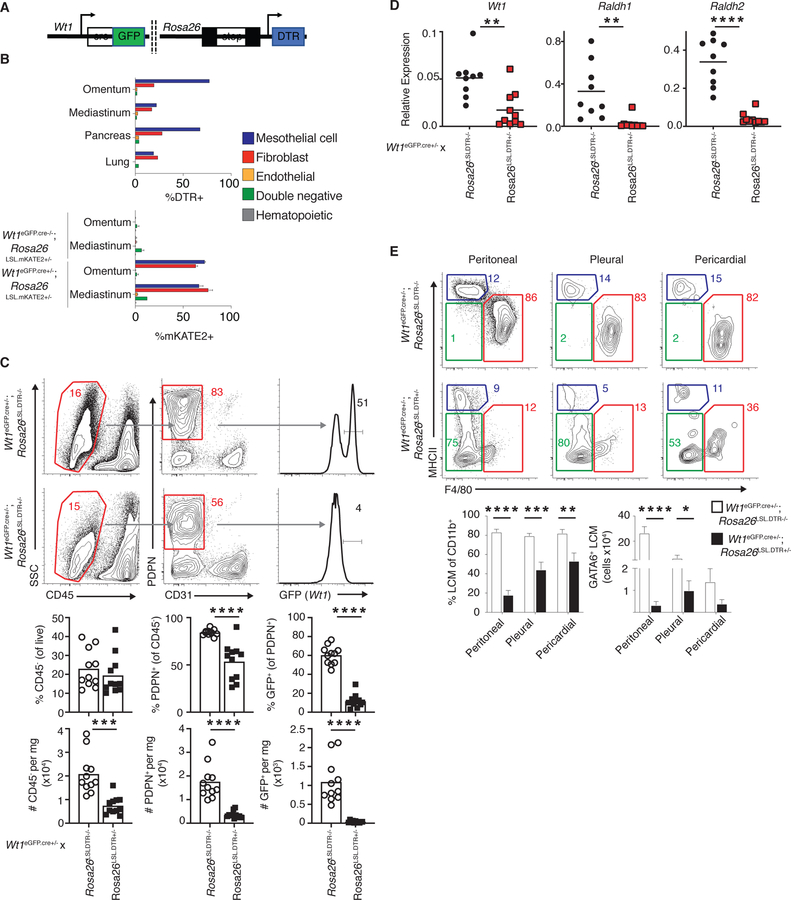
Tissue-resident macrophages require specific milieus for the maintenance of defining gene-expression programs. Expression of the transcription factor GATA6 is required for the homeostasis, function and localization of peritoneal cavity-resident macrophages. Gata6 expression is maintained in a non-cell autonomous manner and is elicited by the vitamin A metabolite, retinoic acid. Here, we found that the GATA6 transcriptional program is a common feature of macrophages residing in all visceral body cavities. Retinoic acid-dependent and -independent hallmark genes of GATA6+ macrophages were induced by mesothelial and fibroblastic stromal cells that express the transcription factor Wilms' Tumor 1 (WT1), which drives the expression of two rate-limiting enzymes in retinol metabolism. Depletion of Wt1+ stromal cells reduced the frequency of GATA6+ macrophages in the peritoneal, pleural and pericardial cavities. Thus, Wt1+ mesothelial and fibroblastic stromal cells constitute essential niche components supporting the tissue-specifying transcriptional landscape and homeostasis of cavity-resident macrophages.

Keywords: Fibroblasts; Macrophages; Mesothelial cells; Retinoic acid; WT1.


Conflict of interest statement

Declaration of Interests:

MBB, CCL, CXD, JEC, QL, WS, MRJ and SJT are employees and/or stockholders of Genentech/Roche.

Figures

Figure 1
Figure 1
Resident cavity macrophages express and depend on GATA6. (A) Representative gating and quantification of large cavity macrophages (LCMs) and small cavity macrophages (SCMs) and in peritoneal, pleural and pericardial cavities. Numbers are frequency of cells in gate. (B) Intracellular staining and quantification of GATA6 levels in LCMs and SCMs in peritoneal, pleural and pericardial cavities. Unshaded histograms represent isotype staining and shaded histograms are GATA6 staining. (C) LCM GATA6 mean fluorescence intensity (MFI) in peritoneal, pleural and pericardial cavities. (D-F) Frequency of LCMs in peritoneal (C), pleural (D) and pericardial cavities (E) in Lyz2cre-;Gata6fl/fl or Lyz2cre+;Gata6fl/fl mice. (A-C) Cells were gated as CD45+CD19-Gr1-SiglecF- CD11b+. (D-F) Cells were gated as CD11b+ICAM2+. Data are representative or from of ≥3 (A-E) or 1 (F) experiments. Each dot represents 1 mouse. Mean values are shown. *p<0.05, **p<0.005, ***p<0.0005, ****p<0.0001, as determined by unpaired students T-test.
Figure 2
Figure 2
Podoplanin (PDPN)+platelet-derived growth factor alpha (PDGFRα)- and PDPN+PDGFRα+ non-hematopoietic, -endothelial, -epithelial cells at cavity surfaces exhibit robust retinoid metabolism and express Wt1. (A) Representative gating for CD45-EpCAM-CD31-PDPN+PDGFRα- cells, CD45-EpCAM-CD31- PDPN+PDGFRα+ cells, CD45-EpCAM-PDPN-CD31+ endothelial cells and CD45- EpCAM-PDPN-CD31- double negative cells in cavity tissues and sLN. (B, C) Representative gating for aldefluor activity (B) and GFP (Wt1) (C). (D, E) Quantification of aldefluor positive (D) and GFP (Wt1) (E) positive cells across tissues. (B-E) in CD45-EpCAM-CD31-PDPN+PDGFRα- cells (blue), CD45- EpCAM-CD31-PDPN+PDGFRα+ cells (red), CD45-EpCAM-PDPN−/+CD31+ endothelial cells (orange) and CD45-EpCAM-PDPN-CD31- double negative cells (green) and SSClowCD45+ hematopoietic cells (black) in cavity tissues and sLN. (F) Relationship between aldefluor activity (Log2 transformation of aldefluor mean fluorescence intensity (MFI)) minus quench MFI) and WT1 MFI (Log2 transformation) across cavity tissues and sLN in CD45-EpCAM-CD31- PDPN+PDGFRα- cells (blue; PDPN+PDGFRα- in legend), CD45-EpCAM-CD31- PDPN+PDGFRα+ cells (red; PDPN+PDGFRα+ in legend). (A-F) Data are from three experiments with one mouse per experiment. Mean values + SEM are shown in histograms. (F) p value and r-squared values determined by linear regression.
Figure 3
Figure 3
Mesothelial cells and cavity-associated fibroblasts comprise Raldh½-expressing Wt1+ stroma. (A) Sample similarity heatmap showing spearman correlation between samples calculated from normalized, log transformed, mean-centered expression of top 2500 most variable transcripts. (B) Volcano plot depicting significantly different genes between omental, mesentery and epididymal adipose CD45-EpCAM-CD31-PDPN+PDGFRα- and CD45-EpCAM- CD31-PDPN+PDGFRα+ cells (FDR ≤ 0.05, Log2 FC ≥ 2). (C) Geneset enrichment of differentially expressed genes between CD45-EpCAM-CD31-PDPN+PDGFRα- cells (1131) and CD45-EpCAM-CD31-PDPN+PDGFRα+ cells (1151) evaluated using Reactome 2016. (D) Heatmap showing expression of a subset of differentially genes in comparison of CD45-EpCAM-CD31-PDPN+PDGFRα- cells and CD45-EpCAM-CD31-PDPN+PDGFRα+ cells that are hallmark mesothelial and fibroblastic genes. Significant genes were defined as FDR ≤ 0.05, Log2 FC ≥ 2. Wt1 was not differentially expressed but included in the heatmap. (E) Expression of genes associated with retinol metabolism in mesothelial cells and cavity and non-cavity fibroblasts. (F-G) Correlation between Raldh1 (F) and Raldh2 (G) and Wt1 in FACS-sorted mesothelial cells (blue) and fibroblasts (red). Gene expression across biological replicates (transcripts per million (TPM) + 5 (Log2)) were averaged to generate data points. (A, D-E) Ing. = inguinal, Brn. = brown, Om. = omentum, Epi. = epididymal, Mes. = mesentery, Panc. = pancreas, Spl. = spleen, sLN = skin draining lymph node. (A-G) Three independent biological replicates were sequenced for each cell type, aside from spleen and pancreas (n=2). (F, G) p value and r-squared values determined by linear regression.
Figure 4
Figure 4
Wt1+ mesothelial cells and fibroblastic stromal cells metabolize retinol and maintain GATA6 in LCM. (A) Representative chromatograms of LC-LC/MS analysis of omental Wt1+ stromal cells and CD45+CD31+ cells supplemented with retinol. Omental Wt1+ stroma (red), omental CD45+CD31+ cells (blue) (B) Quantification of LC-LC/MS for all-trans retinoic acid (ATRA) (ng/mL per number of cells plated; left) and 9/13cis retinoic acid (9/13cis RA) (ng/mL per number of cells plated; right). (C) Representative gating for GATA6 co-culture assay (left; gated on live cells; numbers represent frequencies) and GATA6 expression levels on LCMs after culture without (black) or with (red) omental Wt1+ stromal cells (right; gated on live LCMs; numbers represent frequencies). Unshaded histograms represent isotype staining and shaded histograms are GATA6 staining. (D-E) Quantification of the frequency (D) or MFI (E) of GATA6+ LCMs after culture with autologous omental Wt1+ stromal cells. Each line represents one mouse. (F) GATA6 expression of peritoneal LCM after co-culture with omental fibroblasts or omental mesothelial cells. (H) Co-culture of Wt1+ stromal cells from the omentum (Om.), mesentery (Mes.), pancreas (Panc.) and skin draining lymph node (sLN) and peritoneal LCMs. Cells were cultured for 4–6 days at a ratio of 2–11:1 (Peritoneal lavage: Wt1+ stromal cell/PDPN+ cell (sLN)) for 5 – 6 days. Non-hematopoietic cells purified by MACS. (H) GATA6 expression of peritoneal LCM or lung F4/80+ cells after co-culture with omental Wt1+ stroma. (A-B) Data are from 7 (Omental Wt1+ stromal cells) and 8 (Omental CD45+CD31+ cells) individual mice. (C-H) GATA6+ is determined by frequency positive minus isotype positive. (C-E) Data are representative of (C) or from (D-H) ≥3 experiments. (F-G) 5 mice were pooled for FACS-sorted to generate cells and cultured at a ratio of 1.6–1.8:1 (LCM or lung macrophage:Wt1+ stromal cell or mesothelial cell/fibroblast). *p<0.05, **p<0.005, ***p<0.0005, ****p<0.0001, as determined by paired student’s t-test (D-E), one-way ANOVA with Dunnett’s multiple comparison post-test (H). Mean values (D-E) or mean values ± SEM (B), + SEM (F-H) are shown.
Figure 5
Figure 5
Wt1+ stroma programs the transcriptional landscape of large cavity macrophages. (A) Frequency of GATA6+ LCMs in co-culture assay with conditions or treatments as noted. n denotes number of experiments. (B) Heatmap of peritoneal LCM hallmark genes expression in co-cultures. Significant genes exhibited FDR ≤ 0.05, Log2 FC ≥ 2 and were expressed ≥ 1 TPM in all three ex vivo peritoneal macrophage samples. Genes in black are dependent on GATA6-expression; genes in purple are regulated independently of GATA6. (C) Overlap of LCM genes regulated by Wt1+ stromal cells in vitro compared to hallmark LCM genes (Supplemental Table 1). (A) GATA6+ is determined by frequency positive minus isotype positive. (A-B) Co-culture with cell contact (C:C), co-culture with 0.4uM transwell membrane separation (TW), all trans retinoic acid (ATRA), or BMS493. Cells were cultured for 4–6 days at a ratio of 2–11:1 (Peritoneal lavage:Wt1+ stromal cells) for 5 – 6 days. **p<0.005, ***p<0.0005, as determined one-way ANOVA with Dunnett’s multiple comparison post-test (A) or hypergeometric test (C). Mean values or mean values + SEM (A) are shown.
Figure 6
Figure 6
Wt1+ stromal niche controls cavity macrophage homeostasis in vivo. (A) Schematic of Wt1eGFP.cre;Rosa26LSL.DTR mouse. DTR expression is achieved in Wt1-expressing cells following cre-mediated excision of a loxP-flanked transcriptional “stop” sequence. (B) DTR expression Wt1eGFP.cre;Rosa26LSL.DTR mice (top). mKATE2 expression in Wt1eGFP.cre−/−;Rosa26LSL.mKATE2+/− and Wt1eGFP.cre+/−;Rosa26LSL.mKATE2+/− mice (bottom). (C) Representative gating and quantification (frequency and number per milligram (mg)/tissue) of non-hematopoietic cells in the omenta of Wt1eGFP.cre+/−;Rosa26LSL.DTR−/− and Wt1eGFP.cre+/−;Rosa26LSL.DTR+/− mice 24 hours after DT-administration. (D) Abundance of Wt1, Raldh1 and Raldh2 transcripts in whole omentum 24 hours after DT-administration in Wt1eGFP.cre+/−;Rosa26LSL.DTR−/− and Wt1eGFP.cre+/− ;Rosa26LSL.DTR+/− mice. (E) Representative gating and quantification (frequency of CD11b+ gate and number of GATA6+ LCMs) of cavity LCMs Wt1eGFP.cre+/− ;Rosa26LSL.DTR−/− and Wt1eGFP.cre+/−;Rosa26LSL.DTR+/− mice 24 hours after DT- administration. LCMs were gated as Live CD45+Gr1-SiglecF-CD11b+MHCII- F4/80+. GATA6+ is determined by frequency positive minus isotype positive. (C-F) Data are from 3 (C) or 4 (E) experiments or representative of 2–4 (B, D) experiments. Each dot represents one mouse. *p<0.05, **p<0.005, ***p<0.0005, ****p<0.0001, as determined by unpaired student’s t-test. Mean (B (top), C, D) or mean +SEM values (B (bottom) E) are shown.

Similar articles

Cited by

References

    1. Akilesh HM, Buechler MB, Duggan JM, Hahn WO, Matta B, Sun X, Gessay G, Whalen E, Mason M, Presnell SR, Elkon KB, Lacy-Hulbert A, Barnes BJ, Pepper M, Hamerman JA, 2019. Chronic TLR7 and TLR9 signaling drives anemia via differentiation of specialized hemophagocytes. Science 363, eaao5213. doi:10.1126/science.aao5213 - DOI - PMC - PubMed
    1. Bain CC, Hawley CA, Garner H, Scott CL, Schridde A, Steers NJ, Mack M, Joshi A, Guilliams M, Mowat AMI, Geissmann F, Jenkins SJ, 2016. Long-lived self-renewing bone marrow-derived macrophages displace embryo-derived cells to inhabit adult serous cavities. Nature Communications 7, 1–14. doi:10.1038/ncomms11852 - DOI - PMC - PubMed
    1. Buechler MB, Turley SJ, 2018. A short field guide to fibroblast function in immunity. Semin Immunol 35, 48–58. doi:10.1016/j.smim.2017.11.001 - DOI - PubMed
    1. Chau Y-Y, Bandiera R, Serrels A, Martínez-Estrada OM, Qing W, Lee M, Slight J, Thornburn A, Berry R, McHaffie S, Stimson RH, Walker BR, Chapuli RM, Schedl A, Hastie N, 2014. Visceral and subcutaneous fat have different origins and evidence supports a mesothelial source. Nat Cell Biol 16, 367–375. doi:10.1038/ncb2922 - DOI - PMC - PubMed
    1. Cremasco V, Woodruff MC, Onder L, Cupovic J, Nieves-Bonilla JM, Schildberg FA, Chang J, Cremasco F, Harvey CJ, Wucherpfennig K, Ludewig B, Carroll MC, Turley SJ, 2014. B cell homeostasis and follicle confines are governed by fibroblastic reticular cells. Nat Immunol 15, 973–981. doi:10.1038/ni.2965 - DOI - PMC - PubMed

Publication types