. 2019 Jul 1;50(1):43-56.e6.
doi: 10.1016/j.devcel.2019.05.034. Epub 2019 Jun 20.

Epigenetic Compensation Promotes Liver Regeneration

Affiliations

Epigenetic Compensation Promotes Liver Regeneration

Shuang Wang et al. Dev Cell. .

Abstract

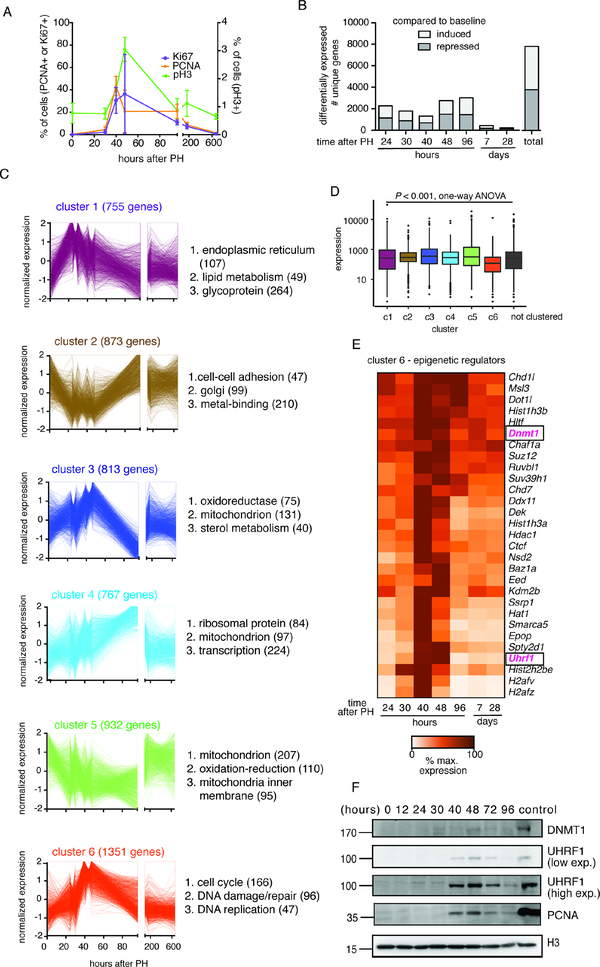
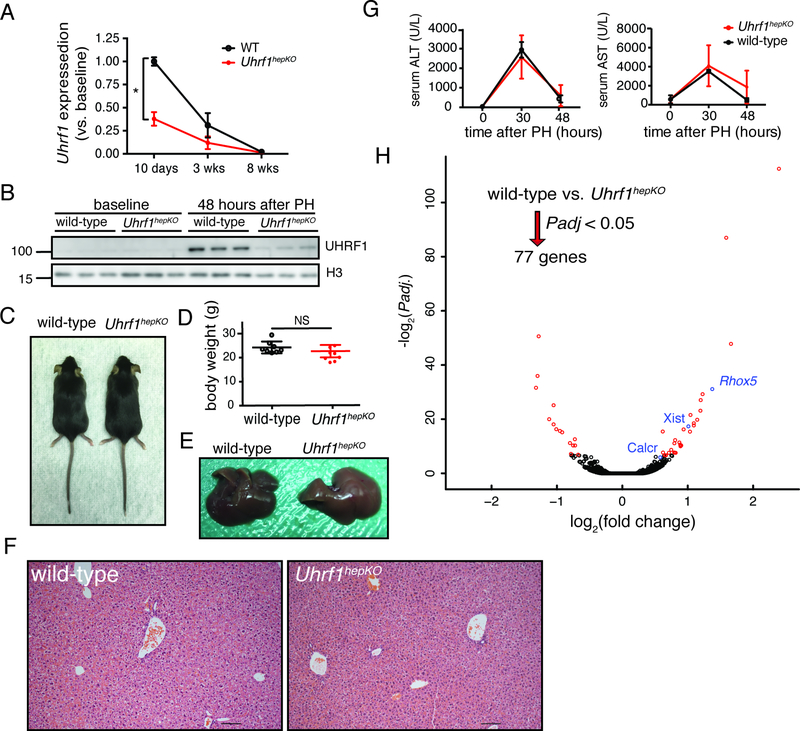
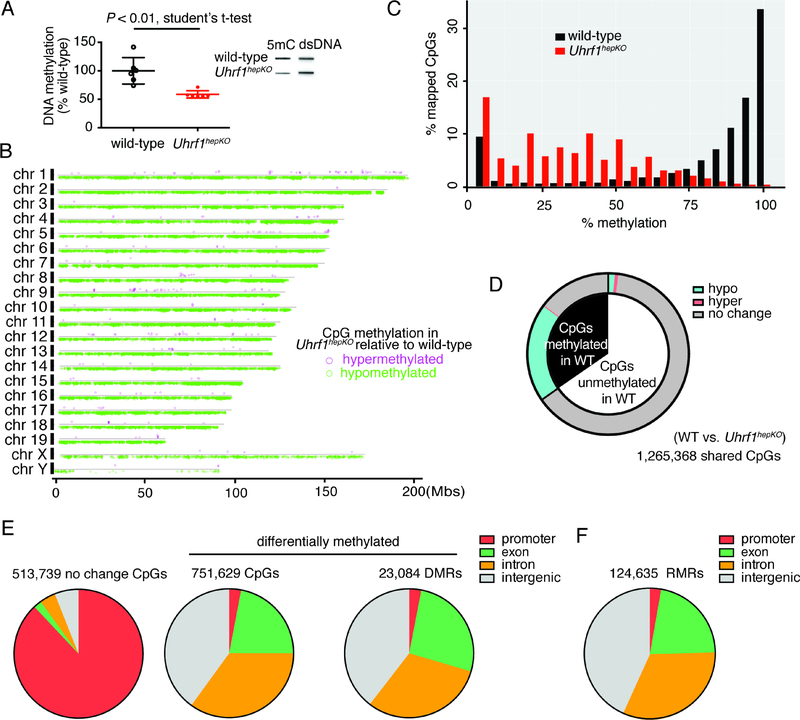
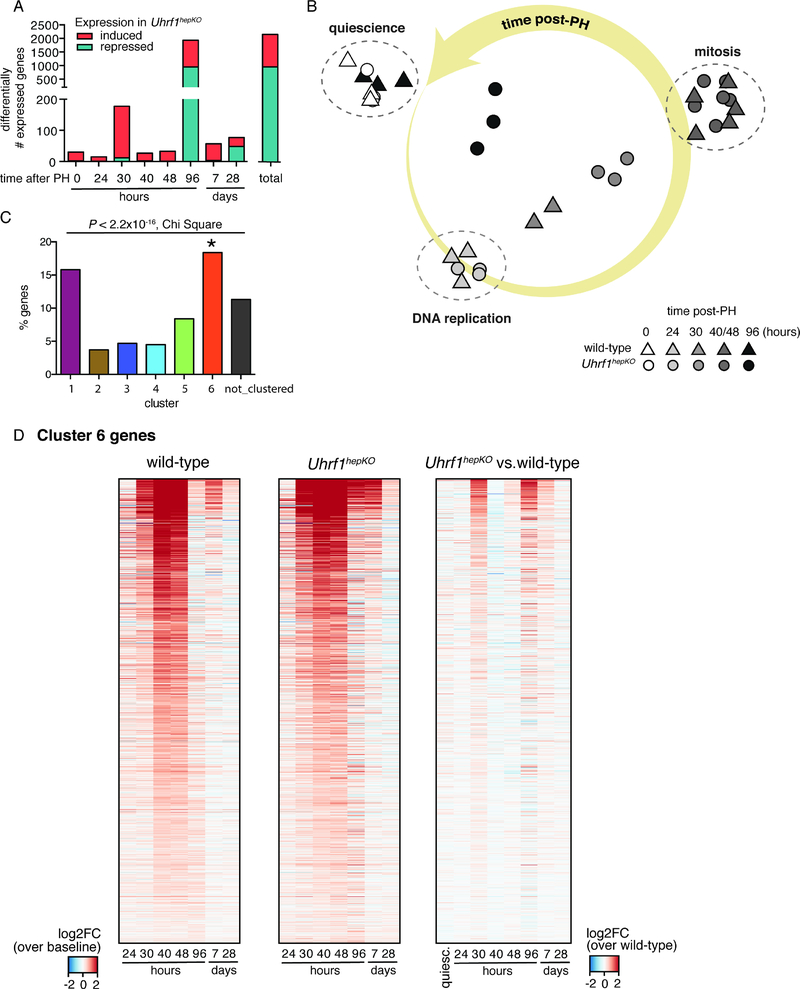
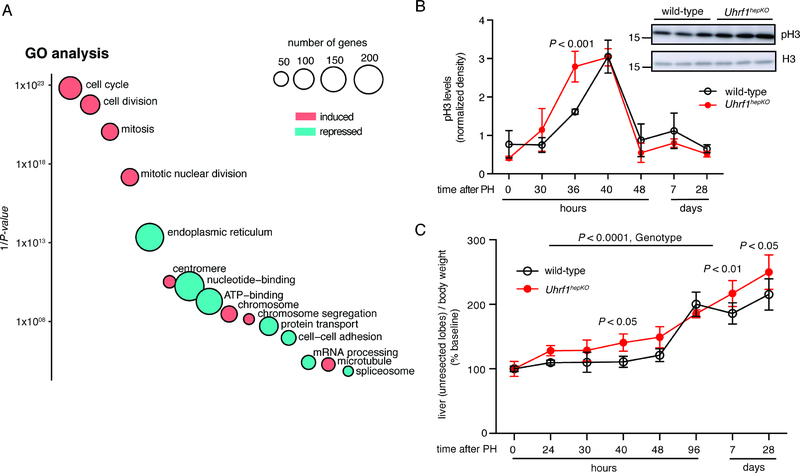
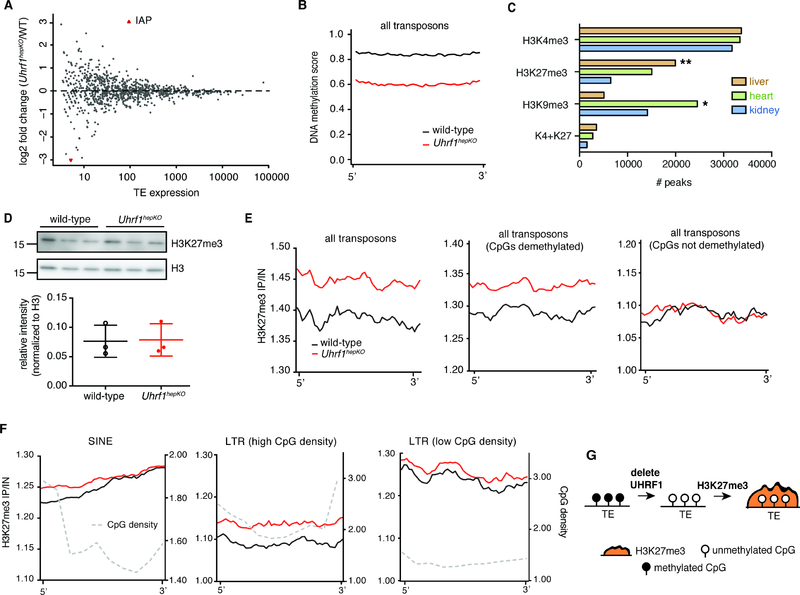
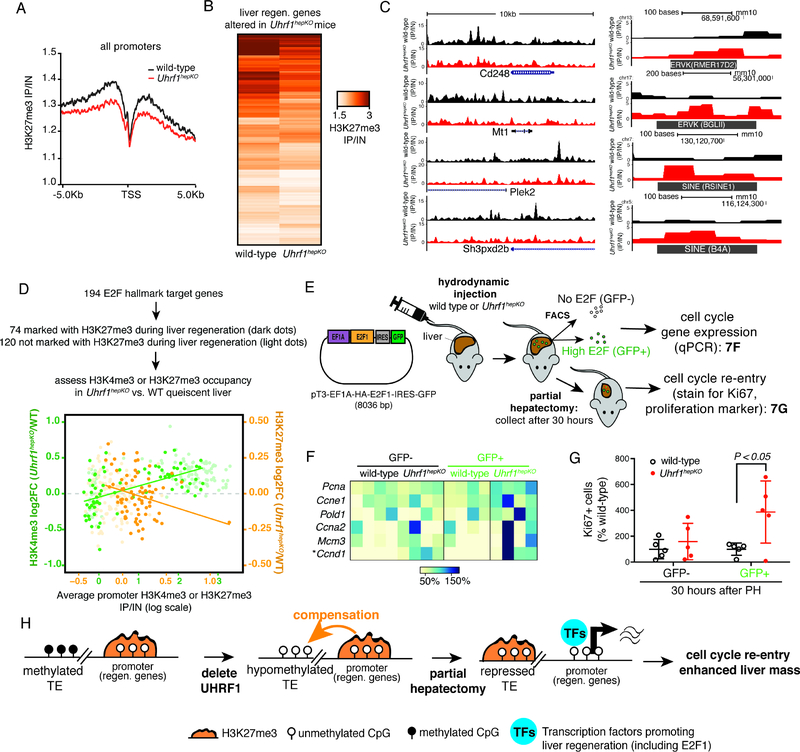
Two major functions of the epigenome are to regulate gene expression and to suppress transposons. It is unclear how these functions are balanced during physiological challenges requiring tissue regeneration, where exquisite coordination of gene expression is essential. Transcriptomic analysis of seven time points following partial hepatectomy identified the epigenetic regulator UHRF1, which is essential for DNA methylation, as dynamically expressed during liver regeneration in mice. UHRF1 deletion in hepatocytes (Uhrf1HepKO) caused genome-wide DNA hypomethylation but, surprisingly, had no measurable effect on gene or transposon expression or liver homeostasis. Partial hepatectomy of Uhrf1HepKO livers resulted in early and sustained activation of proregenerative genes and enhanced liver regeneration. This was attributed to redistribution of H3K27me3 from promoters to transposons, effectively silencing them and, consequently, alleviating repression of liver regeneration genes, priming them for expression in Uhrf1HepKO livers. Thus, epigenetic compensation safeguards the genome against transposon activation, indirectly affecting gene regulation.

Keywords: DNA methylation; H3K27me3; UHRF1; epigenetic compensation; epigenomics; liver biology; partial hepatectomy; tissue regeneration; transposons.


Conflict of interest statement

Competing interests: Authors declare no competing interests

Figures

Figure 1:
Figure 1:. Comprehensive transcriptomic profiling of mouse liver regeneration identifies a group of epigenetic regulators including Uhrf1.
(A) Cell cycle markers detected by immunohistochemistry (IHC, Ki67, and PCNA) and Western blot (pH3) on control liver samples following PH. (B) All DEGs at each time point following PH were compared to quiescent livers. (C) Gene clusters of co-regulated genes identified by unsupervised clustering of significantly changed genes in regenerating control livers. The total number of gens in each cluster and those in the top 3 GO categories are noted. (D). Average normalized counts of genes from each gene cluster in quiescent livers by RNA-seq. (E). Curated list of well-established epigenetic regulators found in cluster 6. (F) UHRF1 and DNMT1 protein expression with respect to the well- established cell cycle marker PCNA during liver regeneration. Mouse ES cells which express a high level of UHRF1 were used as a positive control for blotting and histone H3 was used as a loading control. Error bars represent s.d. See also Figure S1, Table S1, S2.
Figure 2:
Figure 2:. Uhrf1hepKO mouse livers appear normal.
(A) Normalized expression of Uhrf1 transcript at 10 days, 3 weeks, and 8 weeks in control and Uhrf1hepKO mouse livers measured by qPCR. * P < 0.0001 for the effect of genotype by two-way ANOVA. (B) Expression of UHRF1 protein in the liver of control or Uhrf1hepKO mice at 48 hours post-PH (N=3, time point of maximum UHRF1 detection in regenerating liver of control mice). (C) Representative pictures of 8 week old control and Uhrf1hepKO mice. (D) Body weight of control and Uhrf1hepKO mice at quiescence. (E) Representative pictures of dissected livers from 8 week old control and Uhrf1hepKO mice. (F) Representative hematoxylin and eosin staining of control and Uhrf1hepKO quiescent livers taken at 100X zoom. (G) Alanine aminotransferase (ALT) and aspartate aminotransferase (AST) measurements in serum collected from control and Uhrf1hepKO mice before and at 30 and 48 hours following PH (N=3). (H) Volcano plot comparing RNA-seq data from quiescent control and Uhrf1hepKO livers. Red dots denote the significantly changed genes (Padj. < 0.05). Significantly changed imprinted genes are indicated in blue. Error bars represent s.d. See also Figure S2 and Key Resources Table for genotyping primers.
Figure 3:
Figure 3:. Uhrf1hepKO mouse livers display genome-wide loss of DNA methylation in non-promoter regions.
(A) Bulk DNA methylation levels in control and Uhrf1hepKO quiescent livers as determined by slot blot (N=6; example of one blot provided in inset). (B) Genome-wide distribution of CpGs that were hyper- (pink) or hypo-methylated (green) in Uhrf1hepKO livers compared to controls. (C) Histogram of all RRBS mapped CpGs binned by percentage methylation. (D) Distribution of CpG methylation changes in Uhrf1hepKO livers based on eRRBS analysis, comparing CpGs which were methylated >80% (black) to those that were not (white, <20%) in control livers. (E) Annotation of genomic elements based on CpGs methylation status in Uhrf1hepKO mice compared to controls. (F) Residually methylated regions (RMRs) in Uhrf1hepKO quiescent livers were distributed across the genome in a pattern similar to the DMRs.
Figure 4:
Figure 4:. Hypomethylated DNA methylome leads to an earlier and more sustained activation of liver regeneration transcriptome.
(A) The number of DEGs that are induced (red) or repressed (teal) in Uhrf1hepKO mice compared to control livers collected at the same time points post-PH. (B) Principle component analysis of gene expression in quiescent and regenerating livers (24, 30, 40, 48, and 96 hours post-PH) from control and Uhrf1hepKO mice. Triangle = control. Circle = Uhrf1hepKO. Shading of data points (RNA-seq samples) is proportional to time post-PH (darker = later). Large yellow arrow indicate progression of time following surgery. Annotations were added for clarification of cell cycle events occurring in control mice at the relevant time points. (C) Percent of genes from each gene cluster identified in figure 1 that overlap with liver regeneration genes significantly induced in Uhrf1hepKO mice. (D) Heatmap of cluster 6 genes across all regeneration time points in control and Uhrf1hepKO mice. Red represents higher at each time point compared to quiescent livers (left 2 heatmaps) or higher in Uhrf1hepKO compared to control (right heatmap). Error bars represent s.d. See also Table S3.
Figure 5:
Figure 5:. Increased expression of cell cycle genes and enhanced liver regeneration in Uhrf1hepKO mice.
(A) GO DAVID analysis of all genes differentially expressed between control and Uhrf1hepKO livers post-PH. Circles represent GO categories that are most significantly enriched with y-axis being 1/P-value and size of circle proportional to number of genes in each category. Pink and cyan circles represent categories that are enriched when only genes that are overexpressed or repressed in Uhrf1hepKO livers are analyzed, respectively. (B) Densitometric quantification of western blots comparing pH3 levels between control and Uhrf1hepKO livers post-PH (N=3 mice per genotype per time point), inset showing Western blot at the 36 hr time point. (C) Liver-body weight ratio of the intact, non-resected liver lobes in control and Uhrf1hepKO mice post-PH normalized to quiescent livers of the same genotype (black = control, red = Uhrf1hepKO, N=3–5 mice per time point). P-values calculated by two-way ANOVA followed by Sidak’s multiple comparison tests. Error bars represent s.d. See also Figure S3.
Figure 6:
Figure 6:. Epigenetic compensation in Uhrf1hepKO mice protects against TE activation.
(A) Transposon expression in quiescent control and Uhrf1hepKO livers detected by RNA-seq with Ribo-Zero, red dots = FDR < 0.05. (B) Average DNA methylation enrichment profiles for control and Uhrf1hepKO mouse livers at all eRRBS mapped TEs. (C) Overlap of H3K27me3, H3K9me3, H3K4me3, and bivalent (K4+K27) peaks in mouse liver, heart, and kidney taken from the ENCODE database. (P < 2.2×10⁻¹⁶, by Chi-squared test with * and ** depicting the two groups that contributed the most to significance by residual calculations). (D) Liver H3K27me3 and H3K9me3 enrichment at promoters of all reference genes separated into 2 groups based on k-means clustering of enrichment scores to segregate genes that have high (top) and low (bottom) H3K27me3 occupancy surrounding the TSS. (E) Total H3K27me3 in quiescent control and Uhrf1hepKO mice as detected by Western blot with quantification by densitometry shown on the bottom (N=3 mice per group). (F) Average H3K27me3 ChlP-seq enrichment profiles for control and Uhrf1hepKO mouse livers at all eRRBS mapped TEs, those with demethylated CpGs, and those with no change in CpGs. (G) Average H3K27me3 ChIP-seq enrichment profiles for all eRRBS mapped IAP, DNA, LINE, SINE, and LTR TEs with high or low CpG density. CpG densities are also shown by grey dotted line. Since TEs are of unequal length and not always highly conserved in sequence, we created “metagenes” for each TE family that divided TEs into 40 equal bins for DNA methylation analysis and 50 equal bins for H3K27me3 enrichment analysis (default parameters) and plotted mean values for each bin. (H) Model depicting epigenetic compensation by H3K27me3 to repress transposons that lose DNA methylation. Error bars represent s.d. See also Figure S3.
Figure 7:
Figure 7:. Reprogramming of the epigenome via the loss of UHRF1 primes cell cycle genes for expression.
(A) Average H3K27me3 ChIP-seq enrichment plots for all gene promoters in control and Uhrf1hepKO livers. (B) Comparison of H3K27me3 enrichment scores for 201 genes that are marked with H3K27me3 and are differentially expressed between control and Uhrf1hepKO livers during regeneration. (C) UCSC genome browser screenshots of 5 genes from (B) that lost H3K27me3 in the promoter region and 5 TEs that gained H3K27me3. (D) Control versus Uhrf1hepKO liver H3K27me3 (orange) and H3K4me3 (green) enrichment at promoters of 74 H3K27me3-regulated (darker dots) and 120 not H3K27me3-regulated (lighter dots) E2F target genes. Lines represent line-of-best-fit based on 74 H3K27me3-regulated E2F target genes. (E) Cartoon describing the hydrodynamic injection of a plasmid encoding E2F1-IRES:GFP into control and Uhrf1hepKO mice. This was followed by FACS sorting quiescent livers for GFP positive and negative cells, and qPCR for E2F1 target genes or PH and then immunofloruescene staining of the cell cycle marker, Ki67. (F) Expression of E2F1 target genes in GFP+ hepatocytes from hydrodynamic injected control and Uhrf1hepKO mice measured by qPCR, normalized to maximum expression as 100% (N=4 mice per genotype, P < 0.0001 for the effect of genotype by two-way ANOVA, “*” P < 0.001 for subsequent Sidak’s comparisons between wild-type and Uhrf1hepKO livers sorted for GFP- (negative for E2F1 expression) and GFP+ (E2F1 overexpressing) hepatocytes. (G) Percent of GFP+ cells that are also Ki67+ in the liver of mice that had hydrodynamic tail vein injection and collected 30 hours after PH (N=3). P-value calculated by two-way ANOVA followed by Sidak’s multiple comparison tests. (H) Model showing that epigenetic compensation by H3K27me3 to repress hypomethylated transposons in Uhrf1hepKO mice enhances liver regeneration. Error bars represent s.d. See also Figure S4, Table S4.

Comment in

References

    1. Afgan E, Baker D, van den Beek M, Blankenberg D, Bouvier D, Cech M, Chilton J, Clements D, Coraor N, Eberhard C, et al. (2016). The Galaxy platform for accessible, reproducible and collaborative biomedical analyses: 2016 update. Nucleic Acids Res. 44, W3–W10. - PMC - PubMed
    1. Akalin A, Franke V, Vlahovicek K, Mason CE, and Schubeler D (2015). genomation: a toolkit to summarize, annotate and visualize genomic intervals. Bioinformatics 31, 1127–1129. - PubMed
    1. Akalin A, Kormaksson M, Li S, Garrett-Bakelman FE, Figueroa ME, Melnick A, and Mason CE (2012). MethylKit: a comprehensive R package for the analysis of genome-wide DNA methylation profiles. Genome Biol. 13, R87. - PMC - PubMed
    1. Alonso A, Bernstein E, and Hasson D (2018). Histone native chromatin immunoprecipitation. in histone variants: methods and protocols, Orsi GA, and Almouzni G, eds. (Springer; New York: ), pp. 77–104. - PubMed
    1. Apte U, Gkretsi V, Bowen William C, Mars Wendy M, Luo JH, Donthamsetty S, Orr A, Monga Satdarshan PS, Wu C, and Michalopoulos George K (2009). Enhanced liver regeneration following changes induced by hepatocyteD specific genetic ablation of integrin□linked kinase. Hepatology 50, 844–851. - PMC - PubMed

Publication types

Substances