. 2019 Sep 9;50(5):573-585.e5.
doi: 10.1016/j.devcel.2019.05.038. Epub 2019 Jun 20.

Efficient Golgi Forward Trafficking Requires GOLPH3-Driven, PI4P-Dependent Membrane Curvature

Affiliations

Efficient Golgi Forward Trafficking Requires GOLPH3-Driven, PI4P-Dependent Membrane Curvature

Juliati Rahajeng et al. Dev Cell. .

Abstract

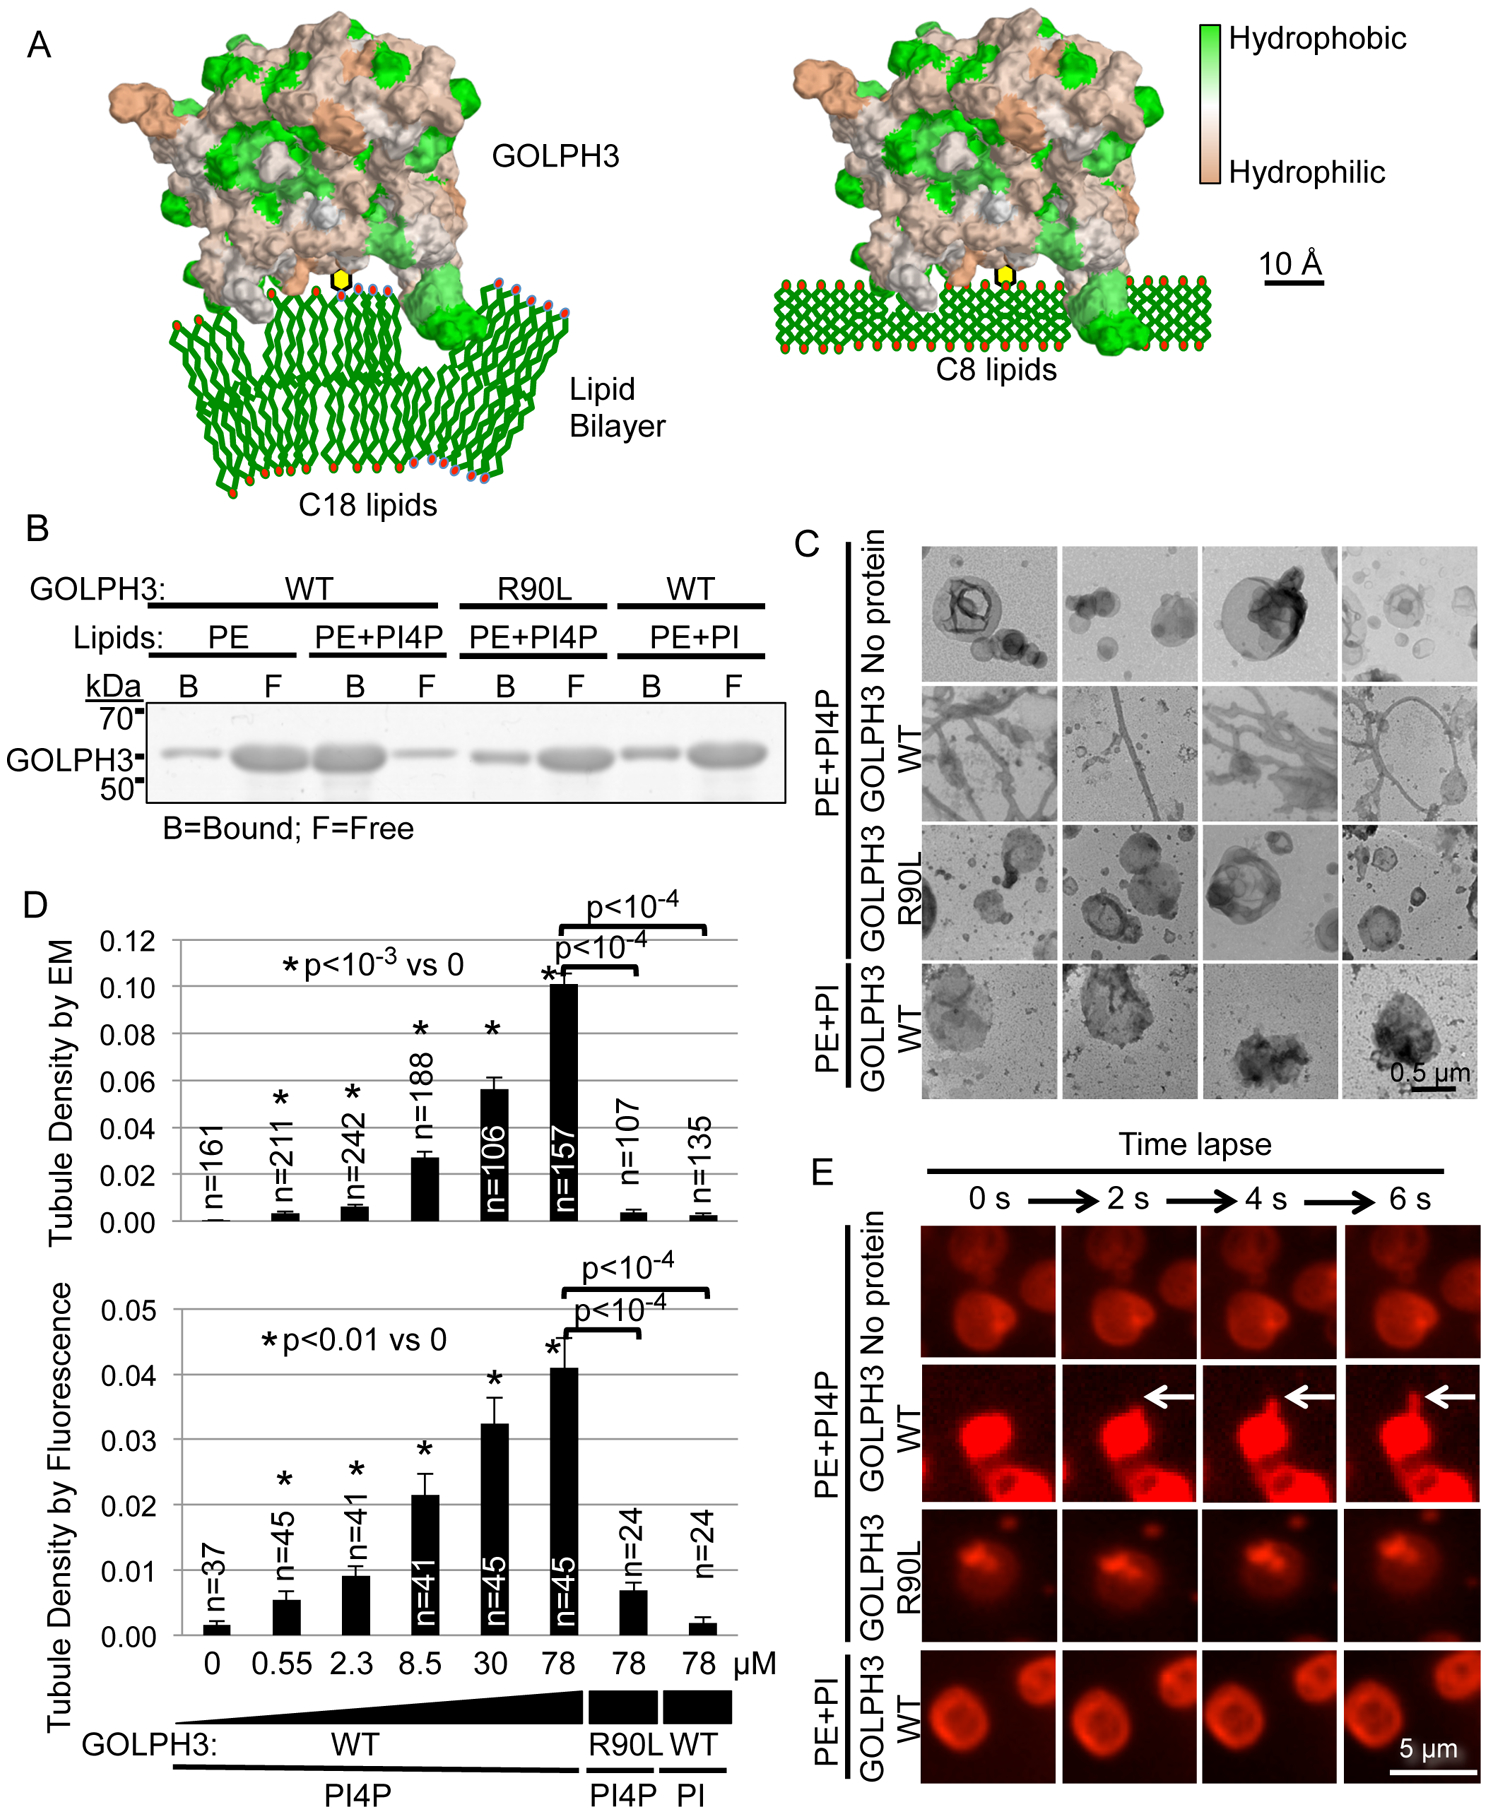
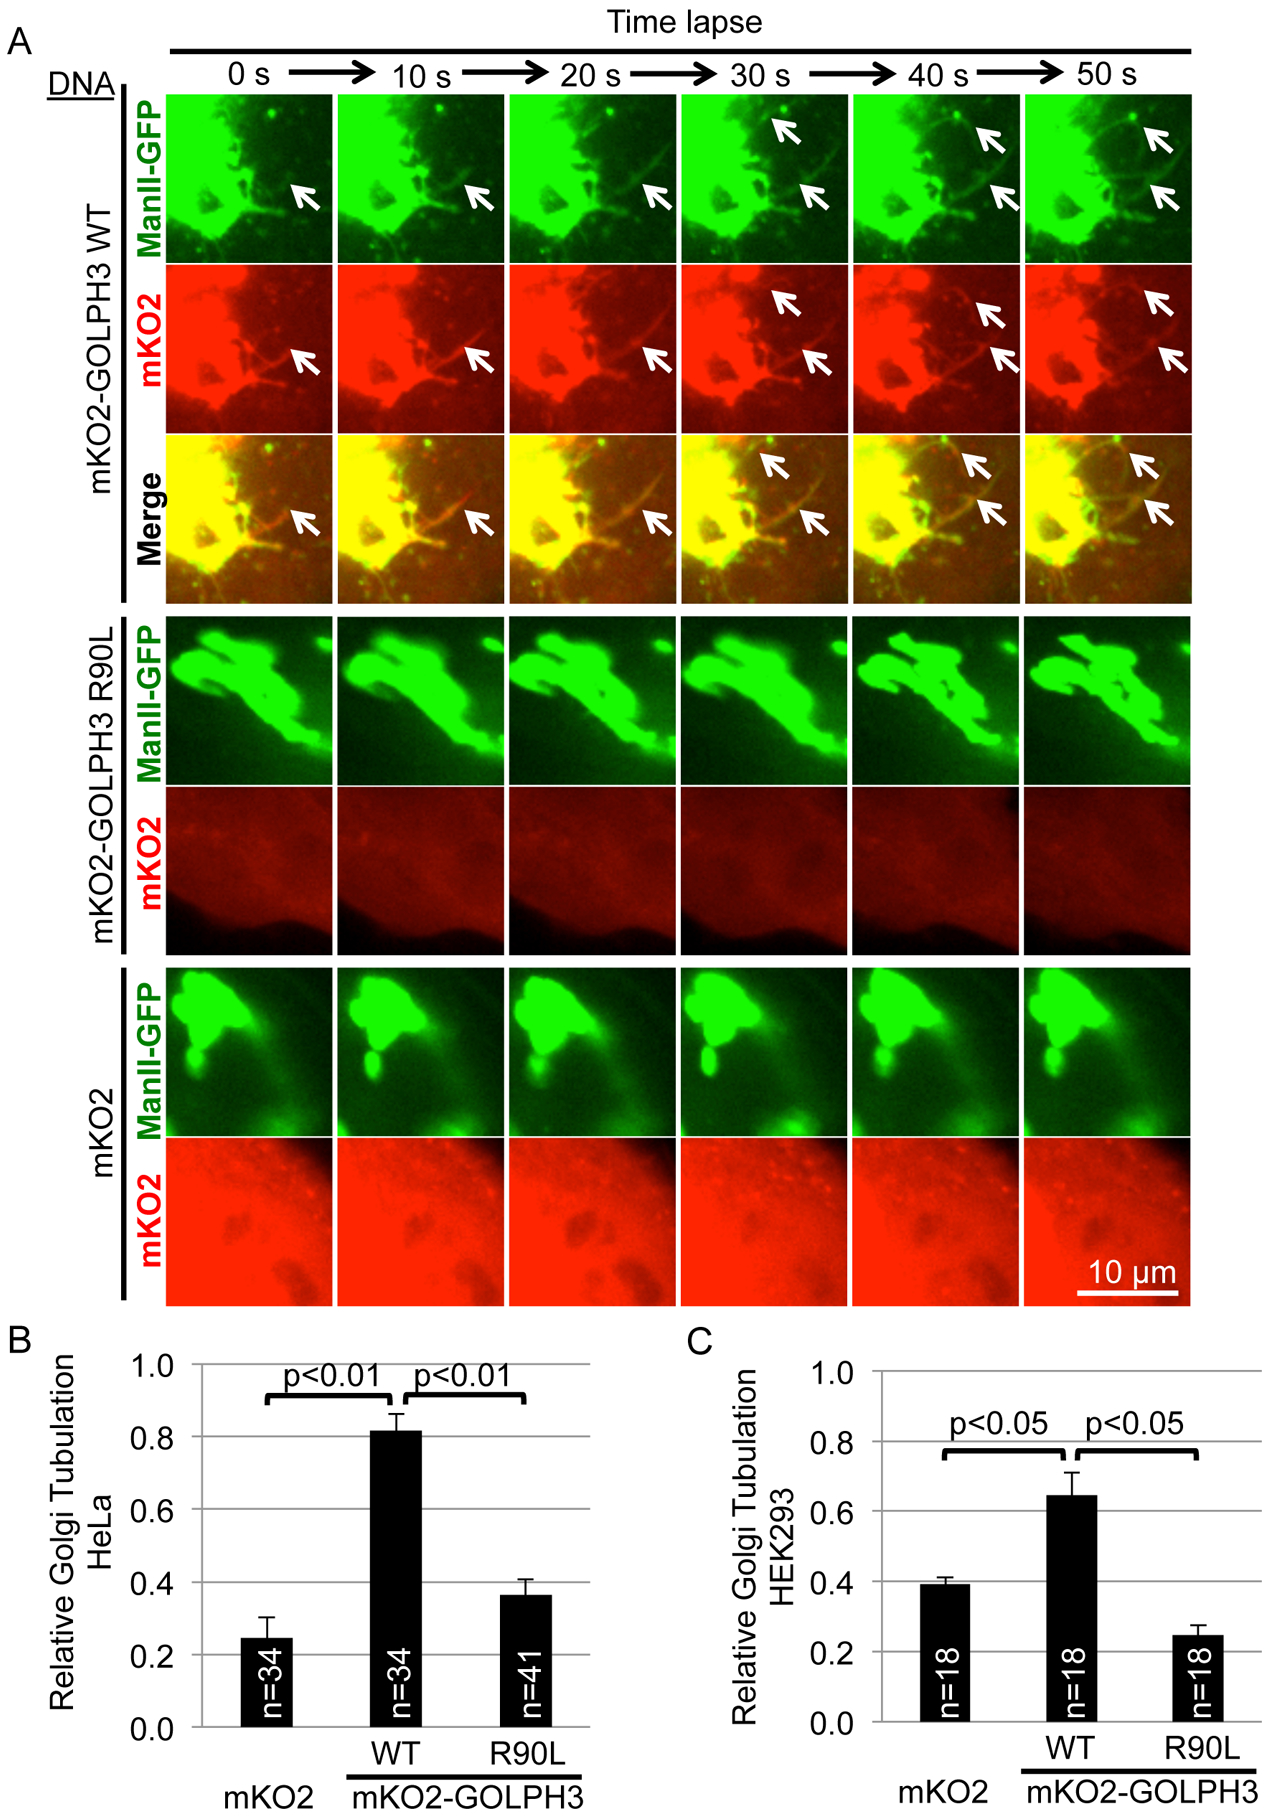
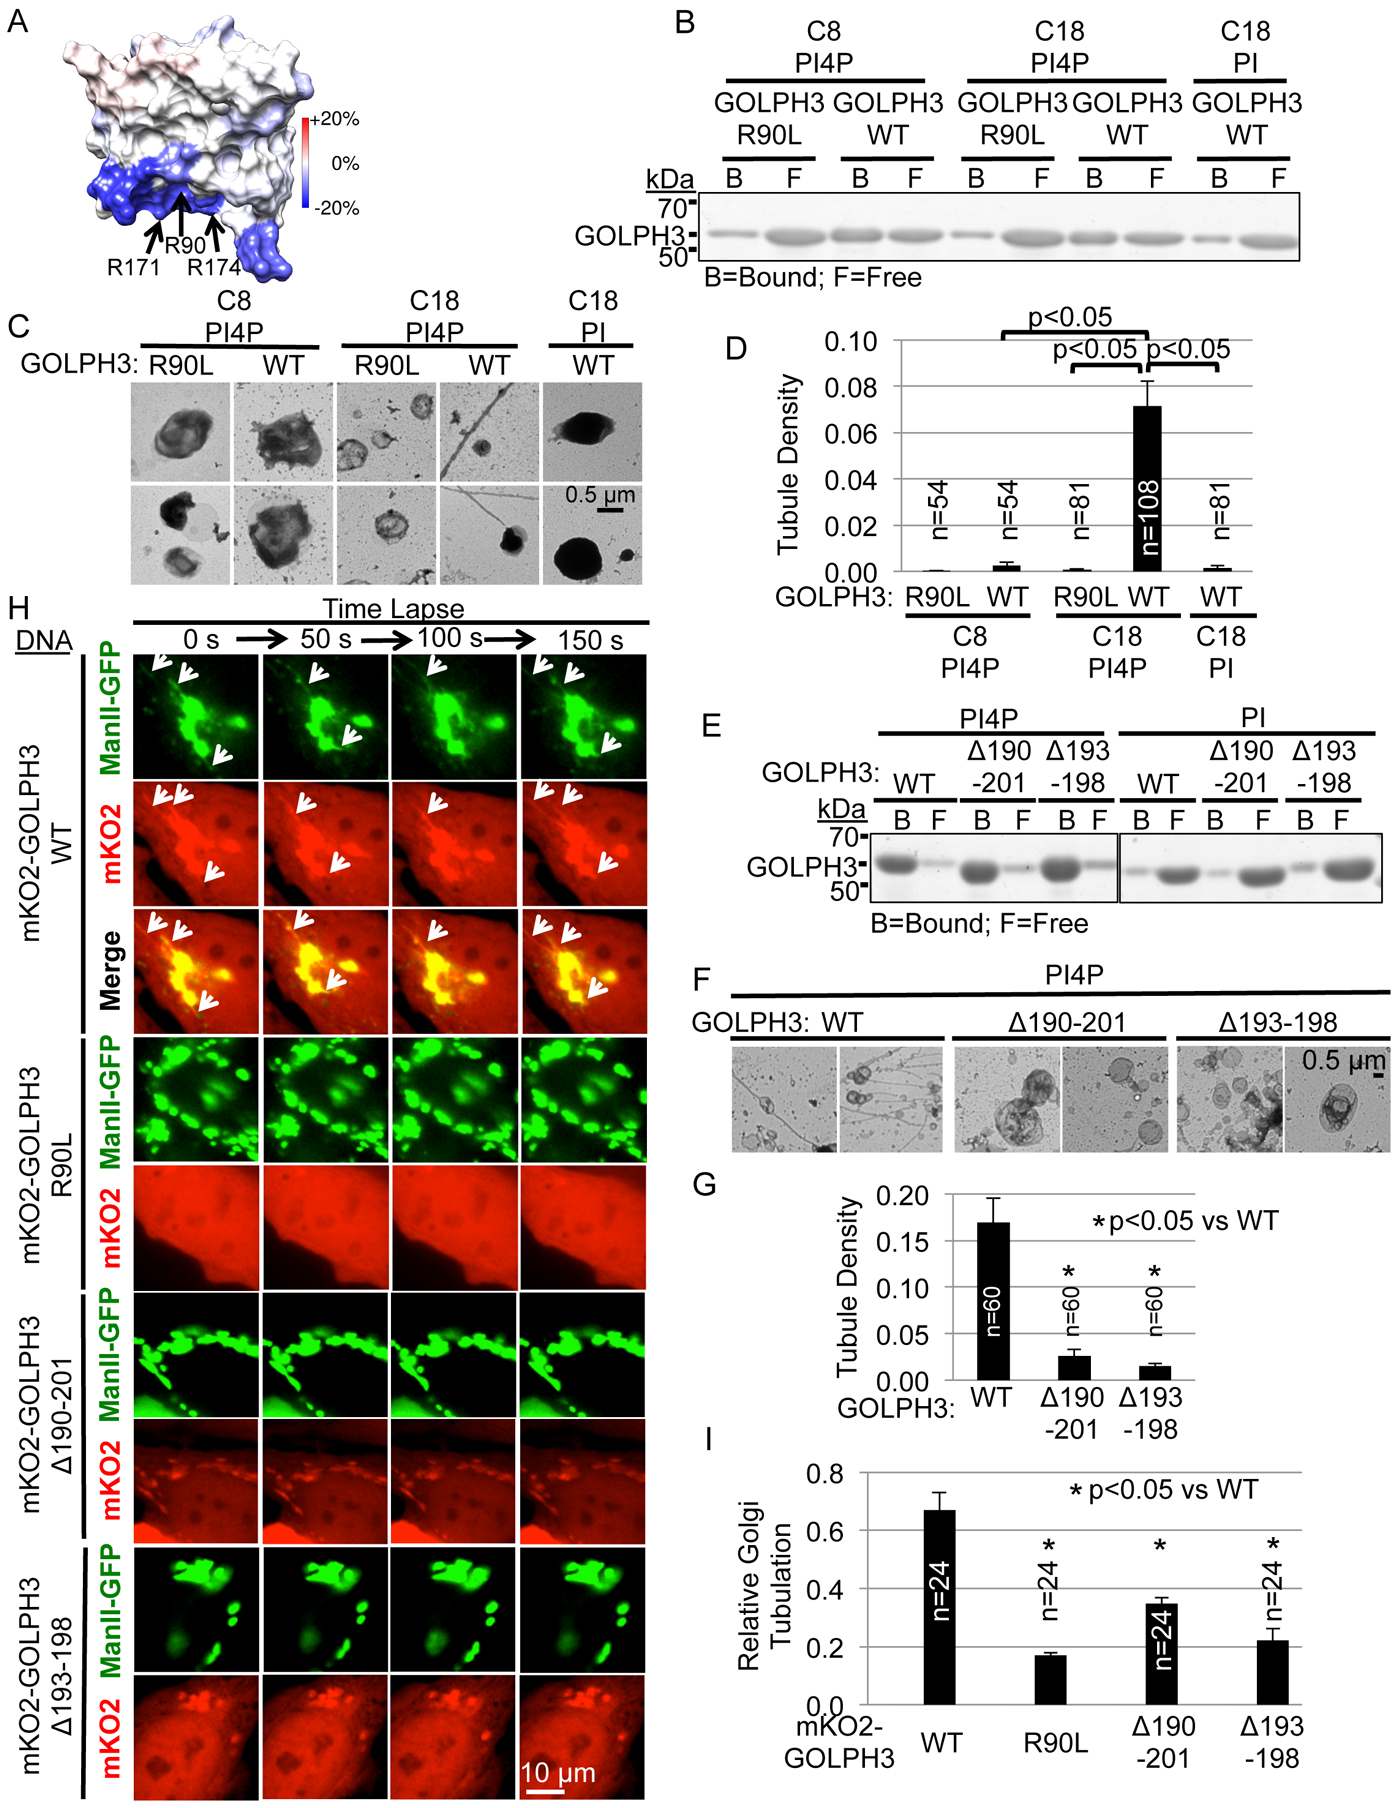
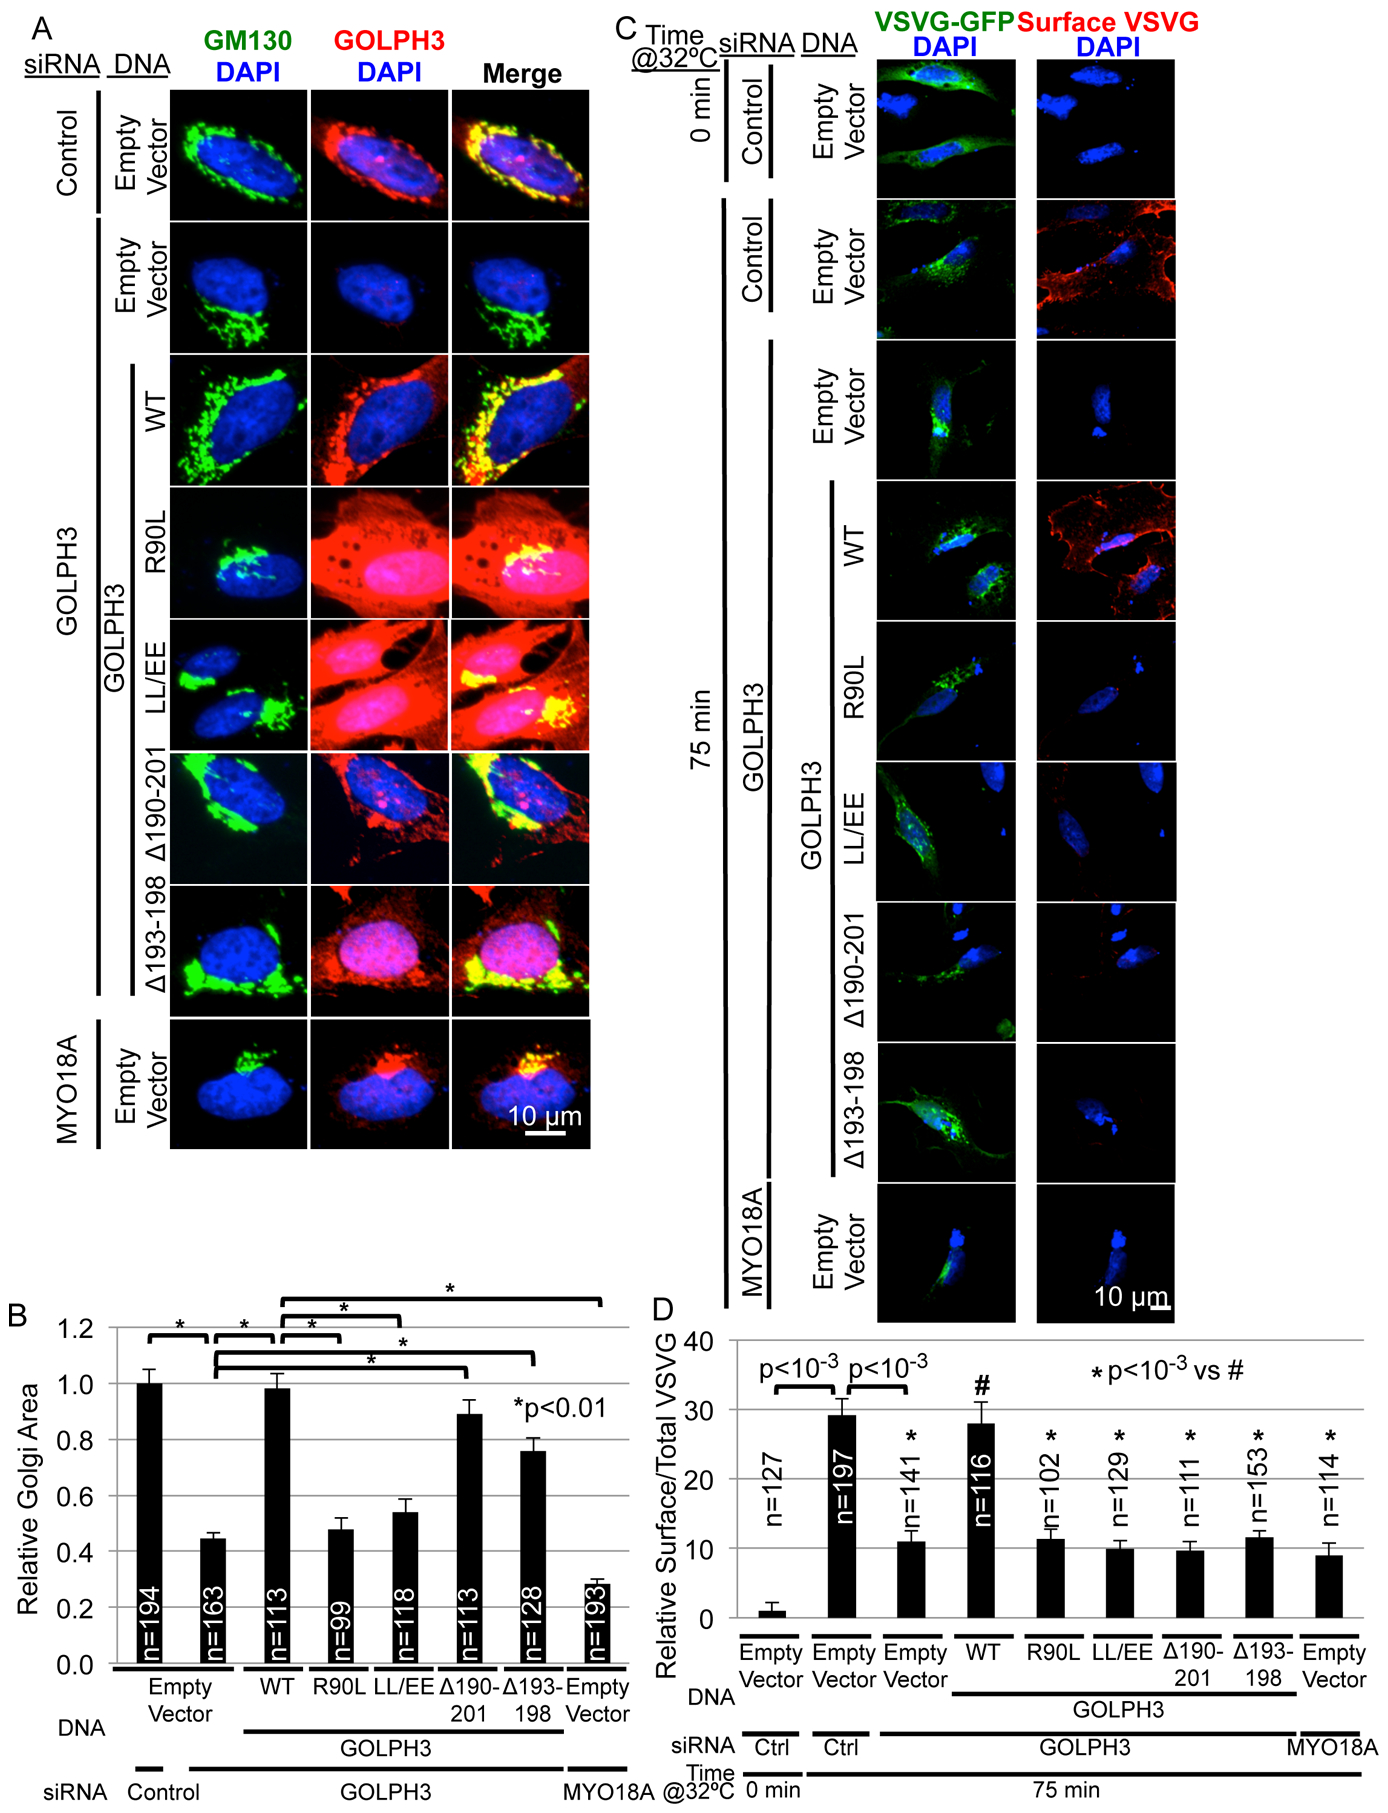
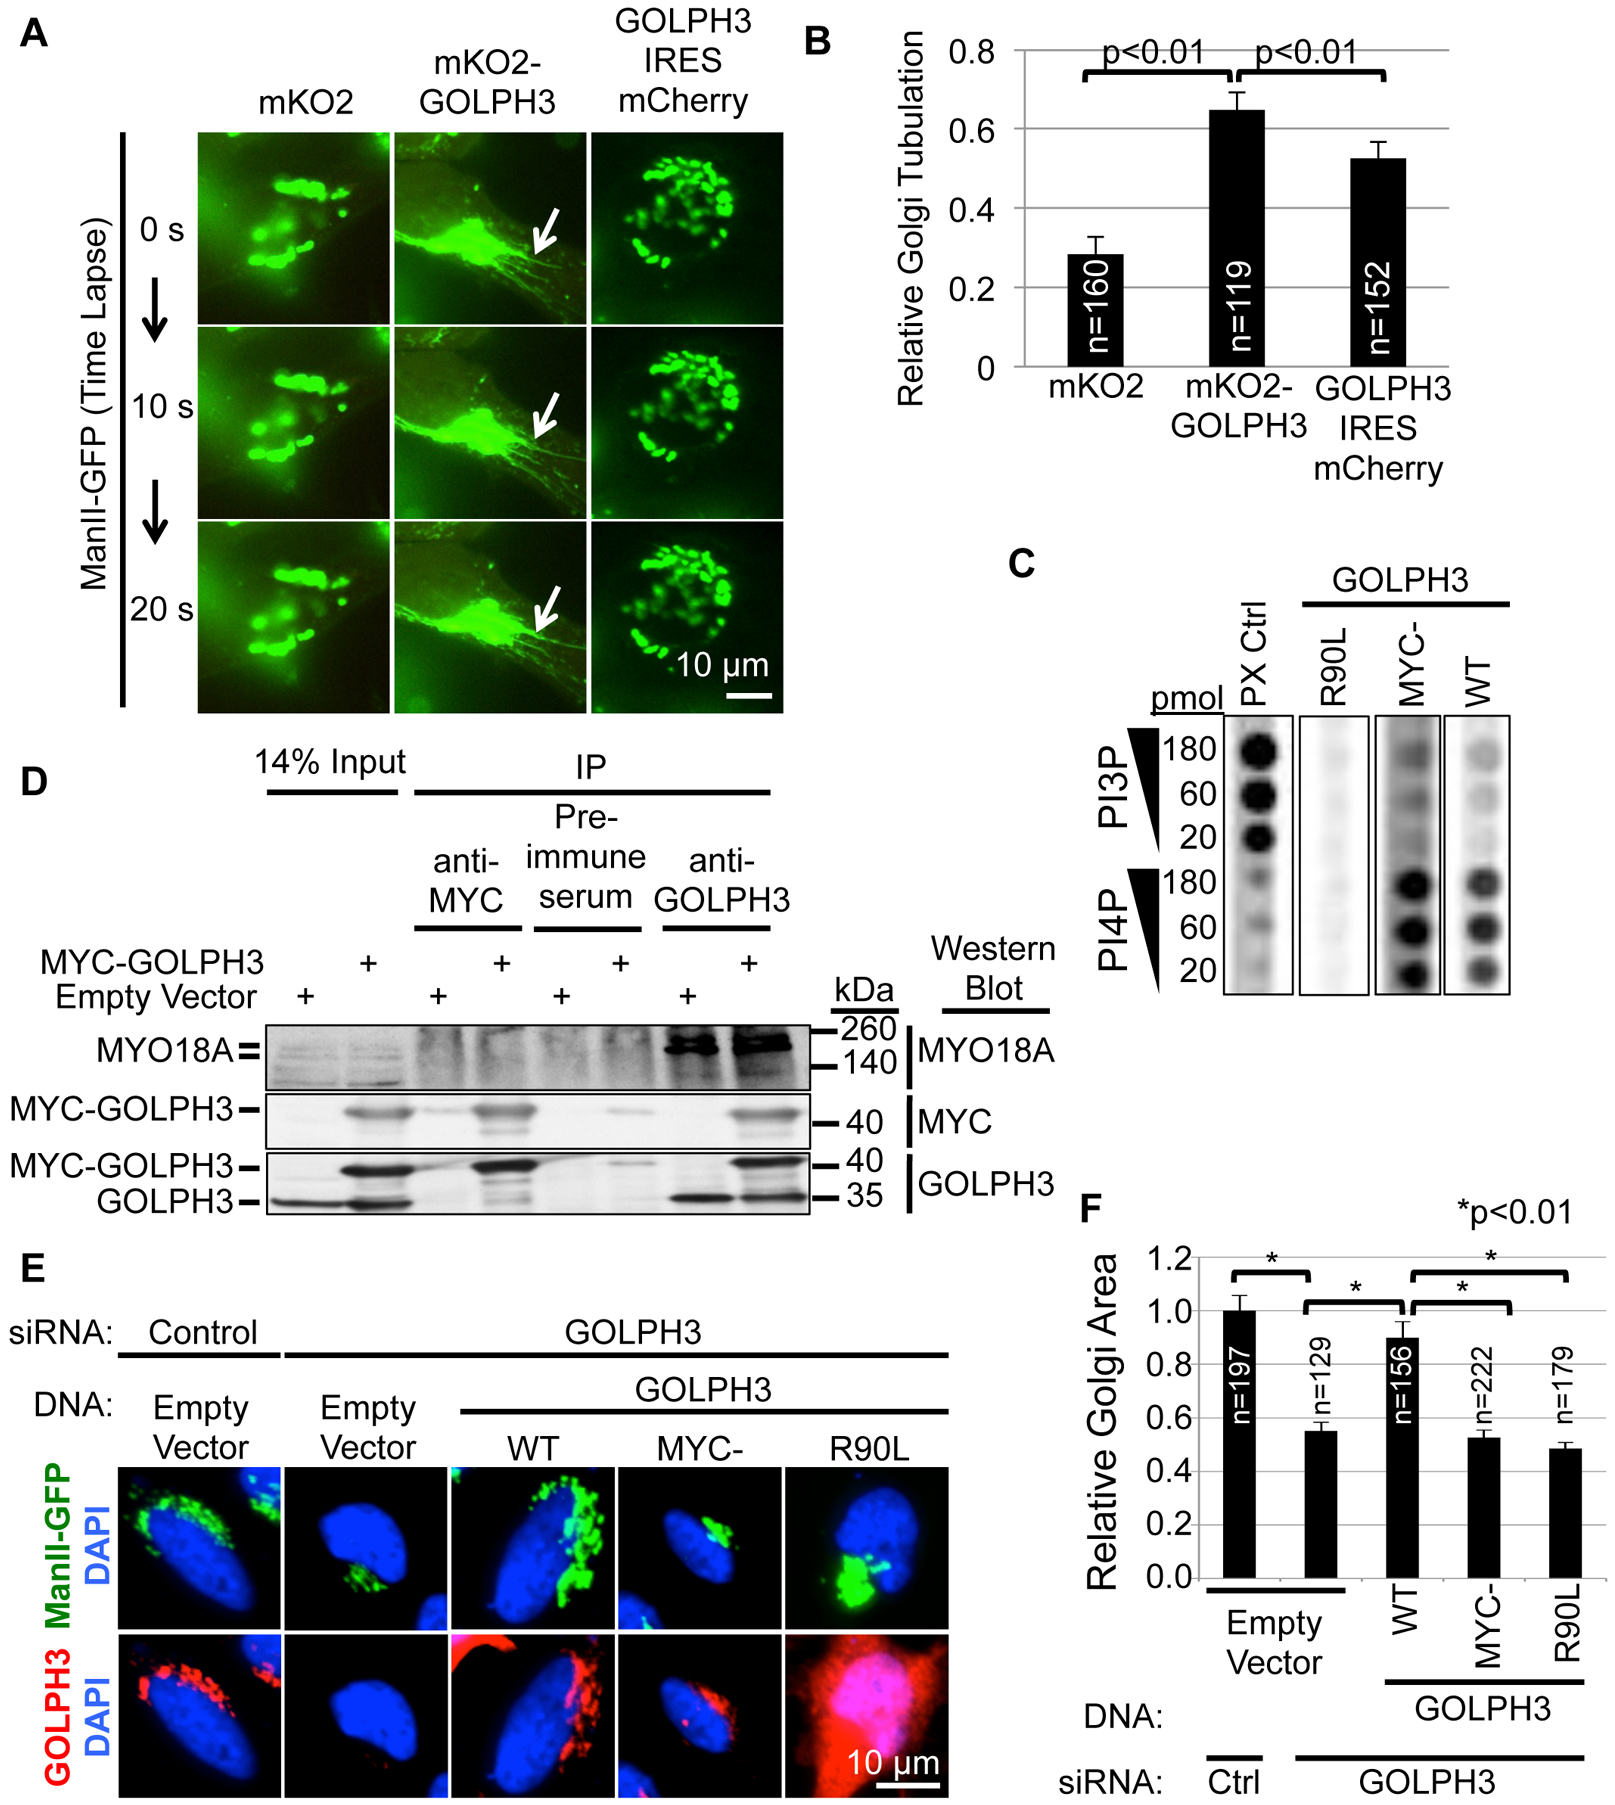
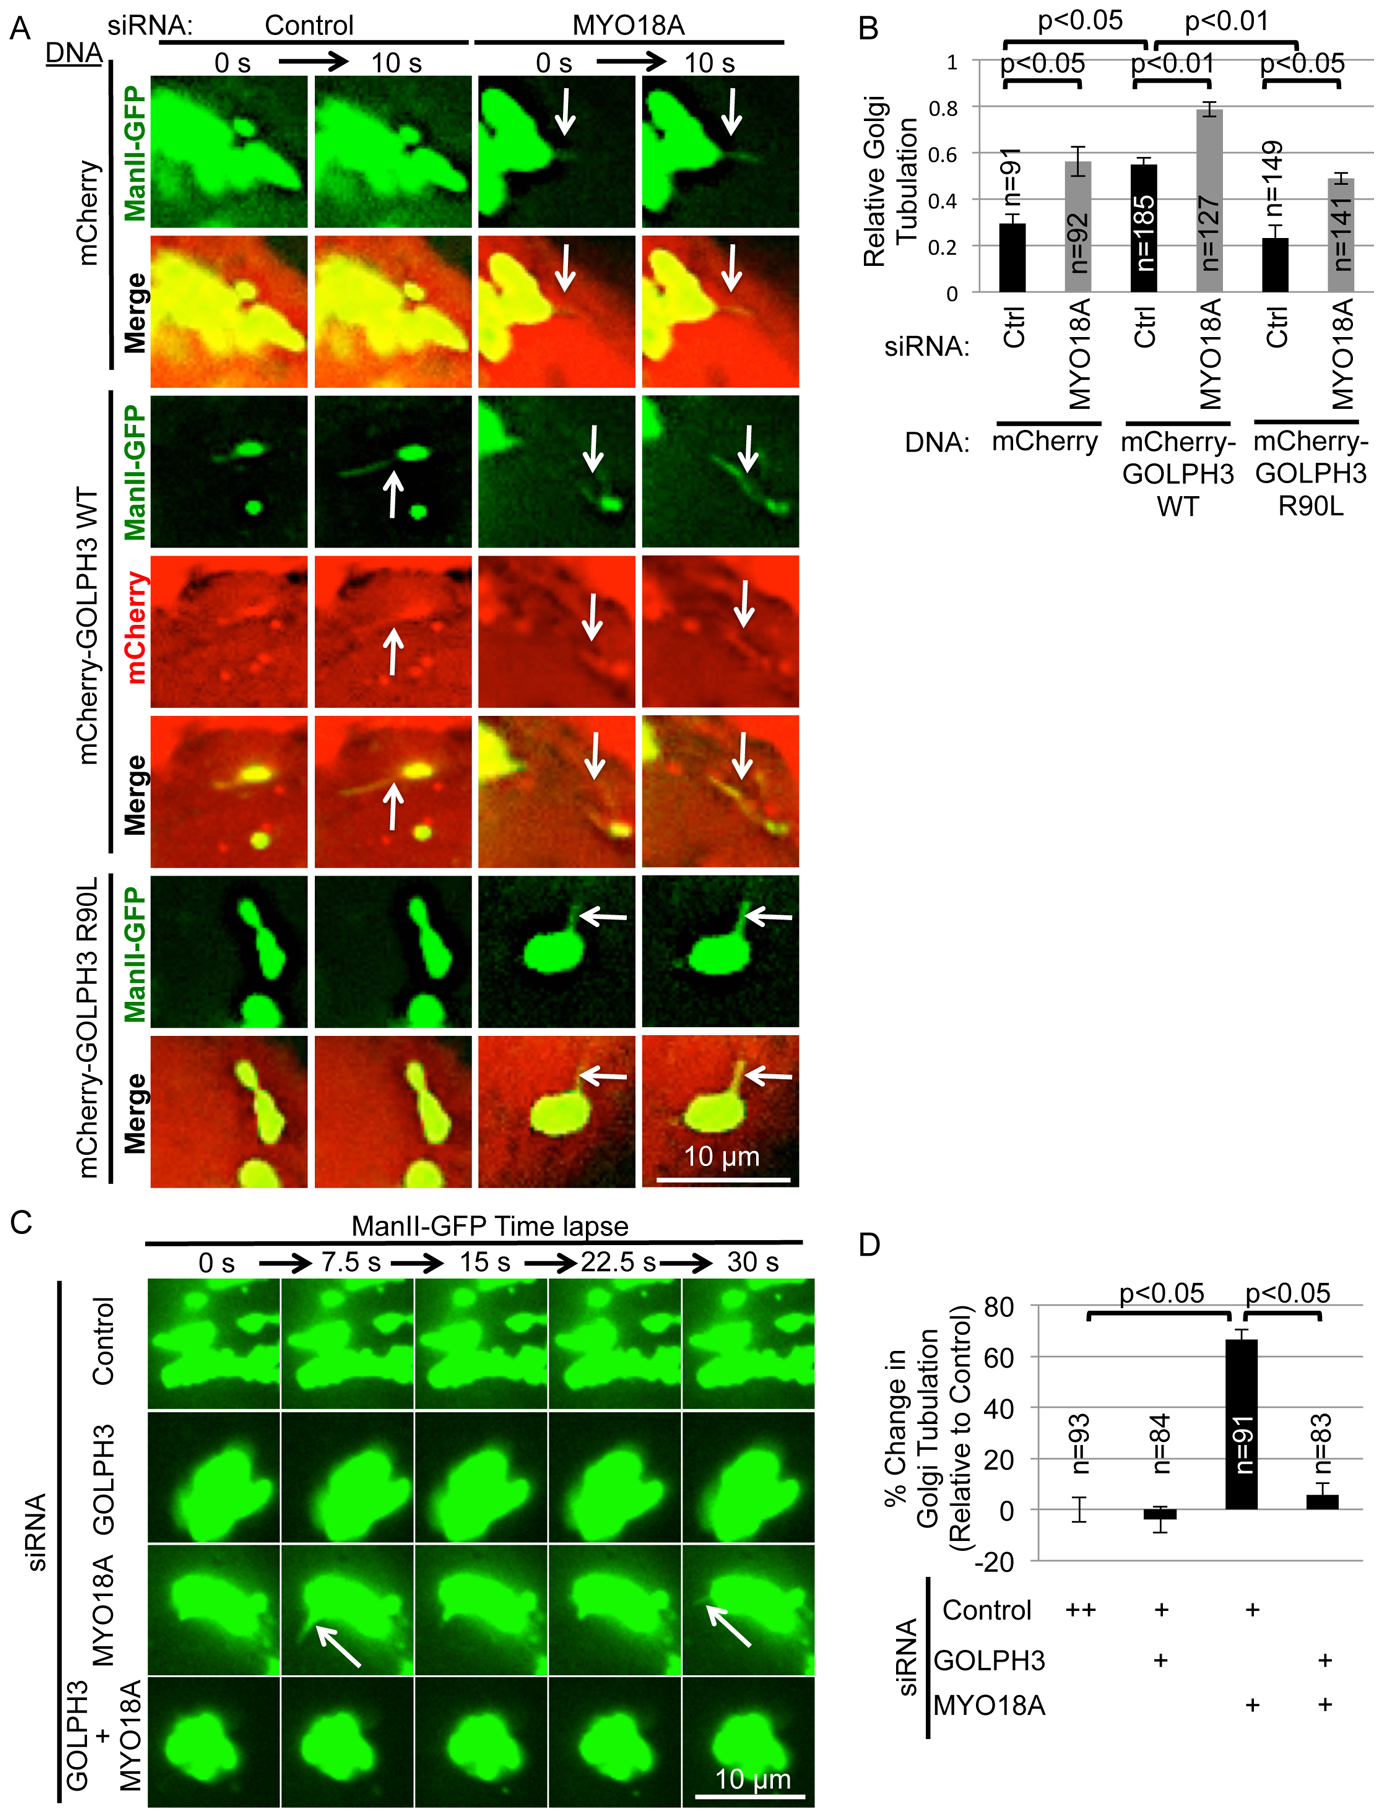
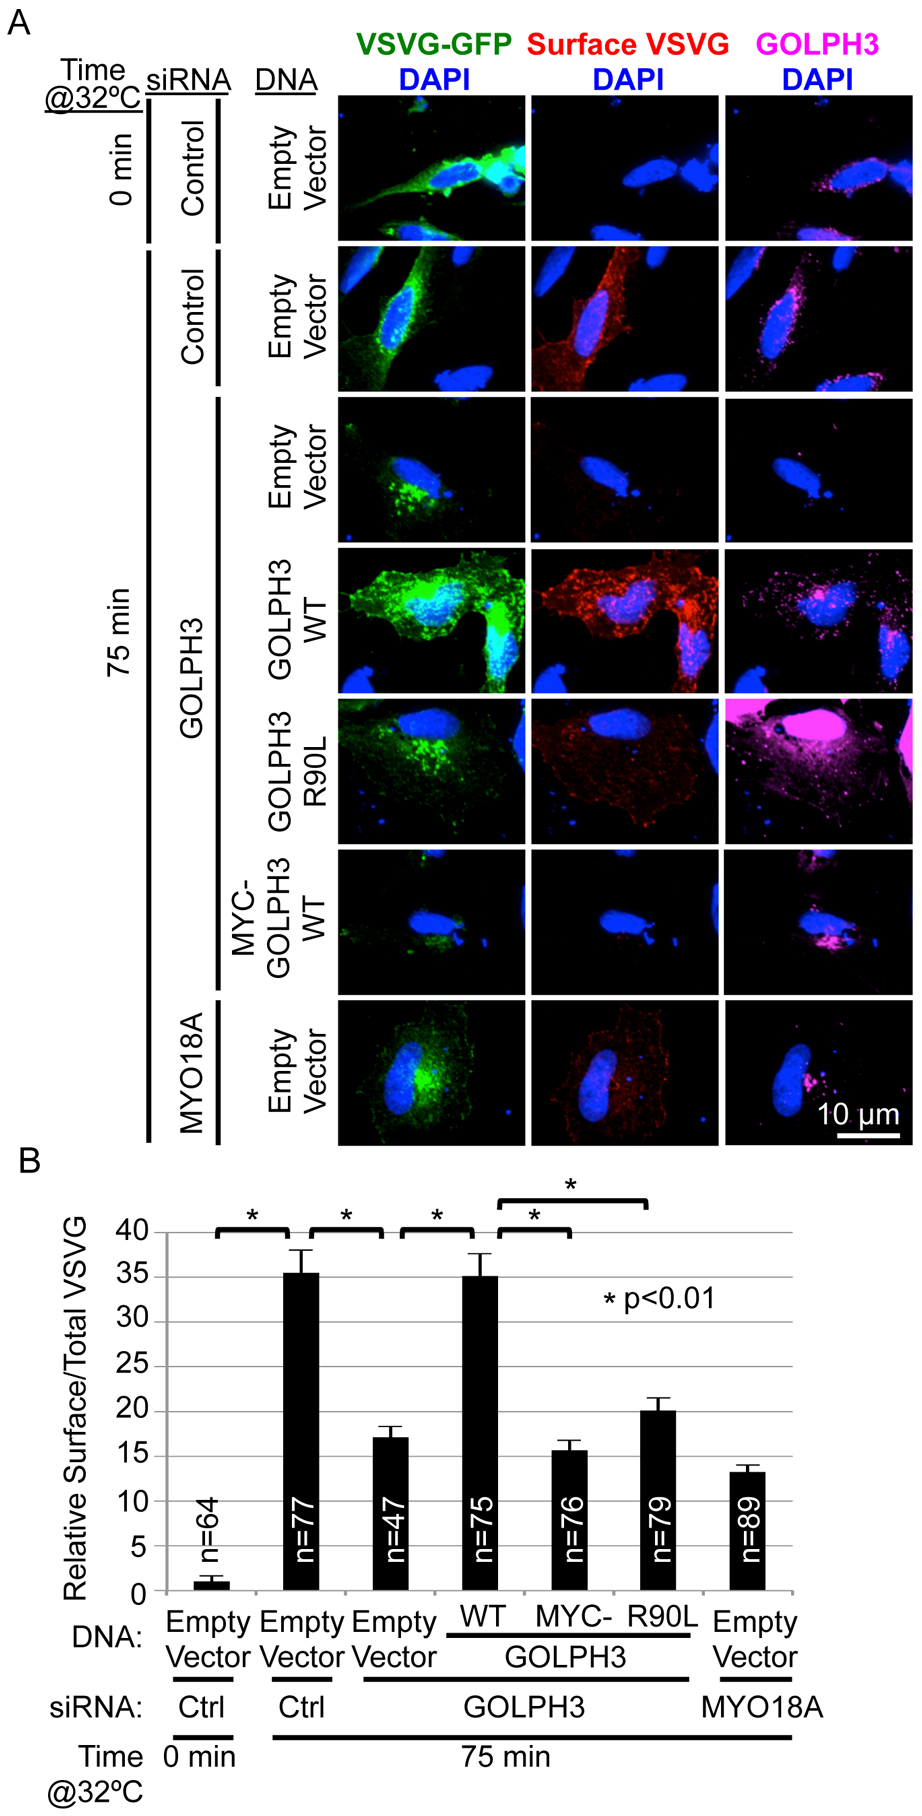
Vesicle budding for Golgi-to-plasma membrane trafficking is a key step in secretion. Proteins that induce curvature of the Golgi membrane are predicted to be required, by analogy to vesicle budding from other membranes. Here, we demonstrate that GOLPH3, upon binding to the phosphoinositide PI4P, induces curvature of synthetic membranes in vitro and the Golgi in cells. Moreover, efficient Golgi-to-plasma membrane trafficking critically depends on the ability of GOLPH3 to curve the Golgi membrane. Interestingly, uncoupling of GOLPH3 from its binding partner MYO18A results in extensive curvature of Golgi membranes, producing dramatic tubulation of the Golgi, but does not support forward trafficking. Thus, forward trafficking from the Golgi to the plasma membrane requires the ability of GOLPH3 both to induce Golgi membrane curvature and to recruit MYO18A. These data provide fundamental insight into the mechanism of Golgi trafficking and into the function of the unique Golgi secretory oncoproteins GOLPH3 and MYO18A.

Keywords: GOLPH3; Golgi; MYO18A; Vesicle trafficking; membrane curvature; membrane tubulation; phosphatidylinositol-4-phosphate; vesicle budding.


Conflict of interest statement

DECLARATION OF INTERESTS

The authors declare no competing interests.

Figures

Figure 1.
Figure 1.. GOLPH3 Binding to PI4P Causes Liposomal Tubulation
(A) Model of GOLPH3 (hydrophobicity/hydrophilicity surface map from PDB 3KN1) binding to PI4P in natural liposomes (C18 and higher) causing membrane curvature (left), whereas binding to short-chain (C8) liposomes does not (right; see also Figure 3). (B) Liposomes that contain 1.8 mol% PI4P, PI, or no phosphoinositide were incubated with 14 μM bacterially expressed GST-GOLPH3 (WT or the R90L mutant that does not bind PI4P). Liposome-bound and free protein were separated by ultracentrifugation and detected by SDS-PAGE/Coomassie Brilliant Blue. (C) Aliquots of the binding reactions from (B) were examined by EM. Four representative images are included for each condition. See also Figures S1A–D for comparison to the EPSIN ENTH domain and examples of vesicles containing PS or PC. (D) Quantification of (C) and (E), measuring tubulation in response to increasing concentrations of GOLPH3 (WT or the R90L mutant). Graphs indicate mean ± SEM of tubule density observed by EM (upper graph) or by fluorescence imaging (lower graph). The number (n) of randomly selected fields imaged is indicated, pooled from four (EM) or four (fluorescence) independent experiments. p values are indicated, calculated by t test. (E) Nile Red-labeled liposomes containing 1.8 mol% PI4P, PI, or no phosphoinositide were examined by confocal fluorescence time-lapse imaging (2 seconds per frame) upon addition of the indicated proteins (at 14 μM). See also Movie S1.
Figure 2.
Figure 2.. Expression of mKO2-GOLPH3 Drives Golgi Tubulation
(A) HeLa cells stably overexpressing ManII-GFP to mark the Golgi were transfected to express mKO2-GOLPH3 (WT), mKO2-GOLPH3-R90L, or mKO2 and imaged every 10 seconds. White arrows indicate Golgi tubulation. See also Movie S2 (time-lapse) and Figure S1E (using trans-Golgi marker SialT-GFP). (B and C) Quantification of (A) and a similar experiment performed in HEK293 cells (C). Graphs in (B) and (C) indicate mean ± SEM of relative Golgi tubulation for n randomly chosen fields pooled from five (B) or three (C) independent experiments. p values are indicated, calculated by t test.
Figure 3.
Figure 3.. GOLPH3-Induced Membrane Tubulation Depends on Insertion of the Hydrophobic β-Loop Partially into the Bilayer
(A) Deuterium exchange mass spectrometry (DXMS) comparing solvent accessibility of GOLPH3 alone versus bound to PI4P-containing liposomes. Changes in deuterium exchange are mapped onto the solvent-accessible surface of GOLPH3 (PDB 3KN1). Residues R90, R171, and R174, previously implicated in ligating PI4P, are protected upon binding (decreased exchange), providing validation. The hydrophobic β-loop is strongly protected. (B) GOLPH3 binds to both natural (C18 or greater) and short-chain (C8) lipid vesicles containing PI4P. To compensate for intrinsically reduced binding to C8 liposomes, PI4P in C18 vesicles was reduced (414 μM for C8 [2.7 mol%], 23 μM for C18 [0.15 mol%]) to produce similar binding of GOLPH3 to C8 and C18 vesicles to allow fair comparison of tubulation. Binding of GST-GOLPH3 (WT or R90L mutant) at 14 μM to the liposomes was assessed by separation into lipid-bound and free fractions by ultracentrifugation, quantified by SDS-PAGE/Coomassie Brilliant Blue (Figure S1G). (C) Aliquots of the binding reactions from (B) were examined by EM. Two representative examples are provided for each. Tubulation was observed upon GOLPH3 binding to long-chain, but not short-chain liposomes. (D) Quantification of liposomal tubulation for (C). (E) Deletion of the hydrophobic β-loop does not significantly affect binding to PI4P. PI4P- or PI-containing liposomes (at 4.2 mol%) were incubated with 1.4 μM GST-GOLPH3, WT or the Δ190–201 or Δ193–198 mutants that delete the hydrophobic β-loop, separated from free protein by ultracentrifugation, and analyzed by SDS-PAGE/Coomassie Brilliant Blue. (F) Aliquots of the binding reactions from (E) were examined by EM. Deletion of the hydrophobic β-loop significantly impairs GOLPH3-induced tubulation of lipid vesicles. (G) Quantification of liposomal tubulation for (F). (H) Confocal fluorescence time-lapse imaging of HeLa cells expressing ManII-GFP and mKO2-GOLPH3 WT or mutants. White arrows indicate Golgi tubulation. Deletion of the hydrophobic β loop impaired GOLPH3-driven Golgi tubulation. See also Movie S3. (I) Quantification of (H). All graphs indicate mean ± SEM and the number of fields examined (n), pooled from four (D), three (G), or four (I) independent experiments. p values are indicated, calculated by t test.
Figure 4.
Figure 4.. GOLPH3’s Hydrophobic β-Loop is Required for Forward Trafficking from the Golgi to the Plasma Membrane
(A) The hydrophobic β-loop is not required for GOLPH3-dependent extended Golgi morphology. GOLPH3 knockdown/rescue experiments were performed in HeLa cells by transfection of GOLPH3-specific siRNA (or control or MYO18A siRNA) followed by transfection of expression vectors for siRNA-resistant GOLPH3 (WT), the indicated mutants, or the empty vector. Cells were examined by IF to the Golgi (GM130) and GOLPH3. (B) Quantification of Golgi area for (A). Quantification of GOLPH3 expression is provided in Figure S2A. (C) Trafficking of ts045-VSVG-GFP to the PM was examined in a GOLPH3 knockdown/rescue experiment in HeLa cells (see Figure S2B for data demonstrating that VSVG-GFP is found in mKO2-GOLPH3-driven Golgi tubules and Figures S2C–F for assessment of ER-to-Golgi and Golgi-to-ER trafficking). HeLa cells were transfected with indicated siRNA and expression vector for siRNA-resistant GOLPH3 (WT), the indicated mutants, or empty vector, together with ts045-VSVG-GFP. Trafficking was arrested at the ER at 40°C (0 minutes at 32°C), followed by release at 32°C. IF was used to examine surface VSVG in unpermeabilized cells, followed by permeabilization to stain for GOLPH3 (Figure S2G). (D) Quantification of relative surface VSVG normalized to total VSVG per cell (C). Graphs in (B) and (D) show mean ± SEM, with the number of cells (n) indicated, pooled from four (B) or six (D) experiments. p values are indicated, calculated by t test. In (A) and (C) maximum projections of z-stacks are shown.
Figure 5.
Figure 5.. An N-Terminal Tag Impairs GOLPH3’s Interaction with MYO18A
(A) Overexpression of N-terminally tagged GOLPH3 significantly increases Golgi tubulation compared to untagged GOLPH3. Confocal time-lapse images were obtained every 10 seconds of HeLa cells expressing ManII-GFP and mKO2, mKO2-GOLPH3, or GOLPH3-IRES-mCherry. White arrows indicate Golgi tubulation. See also Movie S5. (B) Quantification of Golgi tubulation for (A). See also Figures S3A–C, and Movie S4. (C) 3xMYC-tagged GOLPH3 binds PI4P similarly to untagged (WT) GOLPH3. 35S-Met-labeled proteins produced by in vitro transcription and translation (expression validated by SDS-PAGE, see Figure S3D) were used for lipid blotting to detect binding to a dilution series of PI3P and PI4P. The PX control protein (CG4960) bound preferentially to PI3P, as expected (Dippold et al., 2009). (D) MYO18A co-IP’d with GOLPH3, but not with 3xMYC-GOLPH3. HeLa cells were transfected with either expression vector for 3xMYC-GOLPH3 or empty vector. IPs using pre-immune serum (negative control), anti-GOLPH3, or anti-MYC antibodies were examined by Western blotting against MYC and GOLPH3 (to validate the IP) and MYO18A (to detect co-IP). While IP of GOLPH3 robustly co-IPs MYO18A, IP of 3xMYC-GOLPH3 does not. (E) 3xMYC-GOLPH3 is unable to restore normal Golgi extended ribbon morphology in cells depleted of endogenous GOLPH3. HeLa cells stably expressing ManII-GFP were transfected with control or GOLPH3-specific siRNA and expression vectors for siRNA-resistant GOLPH3 (WT), 3xMYC-GOLPH3, GOLPH3-R90L, or empty vector. IF was performed to assess GOLPH3 levels (see Figure S3E) and Golgi morphology. Maximum projections of z-stacks are shown. (F) Quantification of Golgi area for (E). See also Figure S3E for GOLPH3 expression. Graphs in (B) and (F) show mean ± SEM, with the number of cells (n) indicated, pooled from three (B) or four (F) experiments. p values are indicated, calculated by t test.
Figure 6.
Figure 6.. Golgi Tubulation is Driven by Endogenous GOLPH3, but MYO18A Reduces the Appearance of Tubules
(A) Golgi tubulation is significantly increased in cells depleted for MYO18A. HeLa cells stably expressing ManII-GFP were transfected with either control or MYO18A-specific siRNA oligonucleotides and expression vectors for mCherry, mCherry-GOLPH3 (WT), or mCherry-GOLPH3-R90L. Protein expression and knockdown were validated by Western blotting of parallel coverslips (Figure S4A). Confocal time-lapse images were captured every 10 seconds. See also Movie S6. (B) Quantification of Golgi tubulation for (A). Depletion of MYO18A results in enhanced Golgi tubulation, even without overexpression of tagged GOLPH3. See Figure S4B and Movie S7 for demonstration that loss of F-actin also drives Golgi tubulation, and Figure S4C–D for demonstration that endogenous GOLPH3 is found on Golgi tubules that occur upon depletion of MYO18A, but that ARF1 is generally not on GOLPH3-driven tubules. (C) Golgi tubulation seen in MYO18A-depleted cells is dependent on endogenous GOLPH3. HeLa cells stably expressing ManII-GFP were transfected with combinations of control, GOLPH3, and MYO18A-specific siRNA oligonucleotides. Protein knockdown was validated by Western blotting of parallel coverslips (Figure S4E). Confocal time-lapse images were captured every 7.5 seconds. See also Movie S8. Figures S5A and B and Movie S9 demonstrate that rescue with wild-type GOLPH3 restores Golgi tubulation, dependent on GOLPH3’s ability to bind PI4P and to induce membrane curvature. (D) Quantification of Golgi tubulation for (C). Graphs in (B) and (D) show mean ± SEM, with the number of cells (n) indicated, pooled from six (B) or four (D) independent experiments. p values are indicated, calculated by t test. White arrows indicate Golgi tubulation.
Figure 7.
Figure 7.. GOLPH3 Interaction with MYO18A is Required for Golgi-to-PM Trafficking
(A) A GOLPH3 knockdown/rescue experiment was performed to examine trafficking of the experimental cargo ts045-VSVG-GFP. HeLa cells were transfected with control, GOLPH3, or MYO18A-specific siRNA oligonucleotides and expression vectors for ts045-VSVG-GFP and for siRNA-resistant GOLPH3 (WT), GOLPH3-R90L, 3xMYC-GOLPH3 (WT), or empty vector. After incubation at 40°C overnight, cells were shifted to 32°C for 75 min to allow trafficking, and then fixed and stained for surface VSVG, followed by permeabilization and staining for GOLPH3 and DAPI. Maximum projections of z-stacks are shown. (B) Quantification of VSVG-GFP trafficking for (A). Graph shows mean ± SEM, with the number of cells (n) indicated, pooled from three experiments. p values are indicated, calculated by t test.

References

    1. Bell AW, Ward MA, Blackstock MP, Freeman HN, Choudhary JS, Lewis AP, Chotai D, Fazel A, Gushue JN, Paiement J, et al. (2001). Proteomics characterization of abundant Golgi membrane proteins. J Biol Chem 276, 5152–5165. - PubMed
    1. Berger E, Thurnher M, and Muller U (1987). Galactosyltransferase and sialyltransferase are located in different subcellular compartments in HeLa cells. Exp. Cell Res 173, 267–273. - PubMed
    1. Bishe B, Syed GH, Field SJ, and Siddiqui A (2012). Role of phosphatidylinositol 4-phosphate (PI4P) and its binding protein GOLPH3 in hepatitis C virus secretion. J Biol Chem 287, 27637–27647. - PMC - PubMed
    1. Blagoveshchenskaya A, Cheong FY, Rohde HM, Glover G, Knödler A, Nicolson T, Boehmelt G, and Mayinger P (2008). Integration of Golgi trafficking and growth factor signaling by the lipid phosphatase SAC1. J. Cell Biol 180, 803–812. - PMC - PubMed
    1. Buschman M, and Field S (2018a). MYO18A: An unusual myosin. Adv Biol Regul 67, 84–92. - PMC - PubMed

Publication types