. 2019 Jul 8;29(13):2120-2130.e7.
doi: 10.1016/j.cub.2019.05.049. Epub 2019 Jun 20.

Self-Organization of Minimal Anaphase Spindle Midzone Bundles

Affiliations

Self-Organization of Minimal Anaphase Spindle Midzone Bundles

Jonathon Hannabuss et al. Curr Biol. .

Abstract

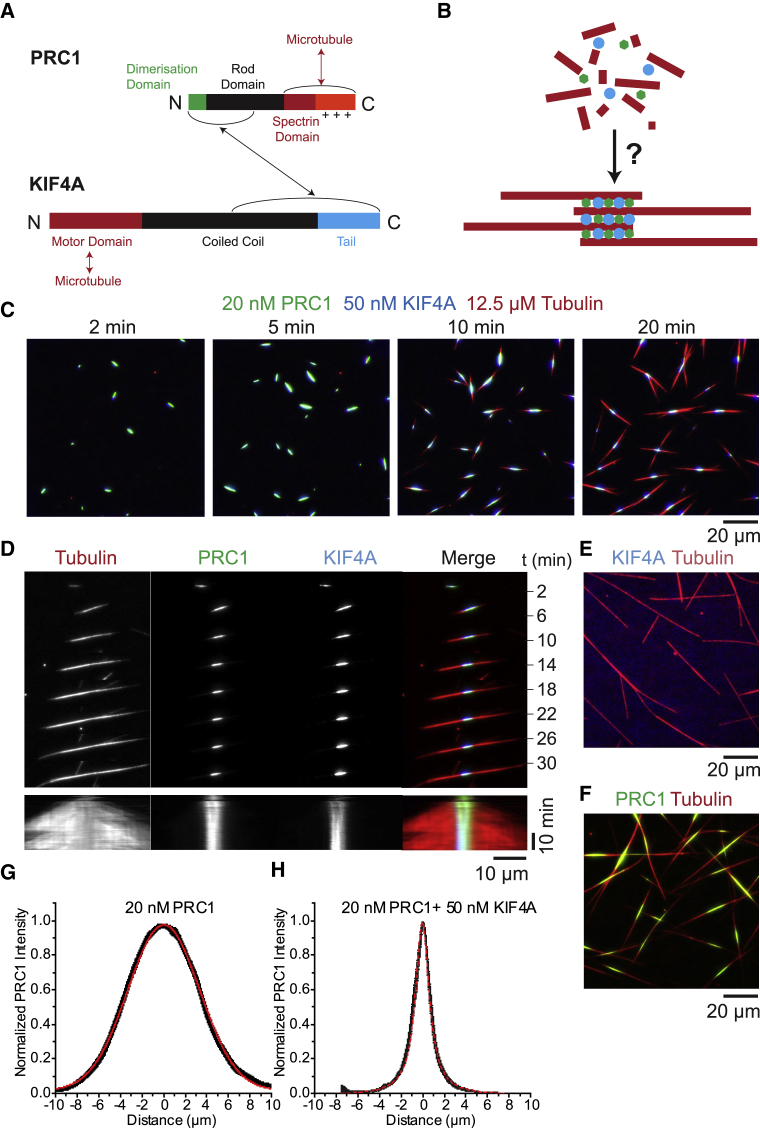
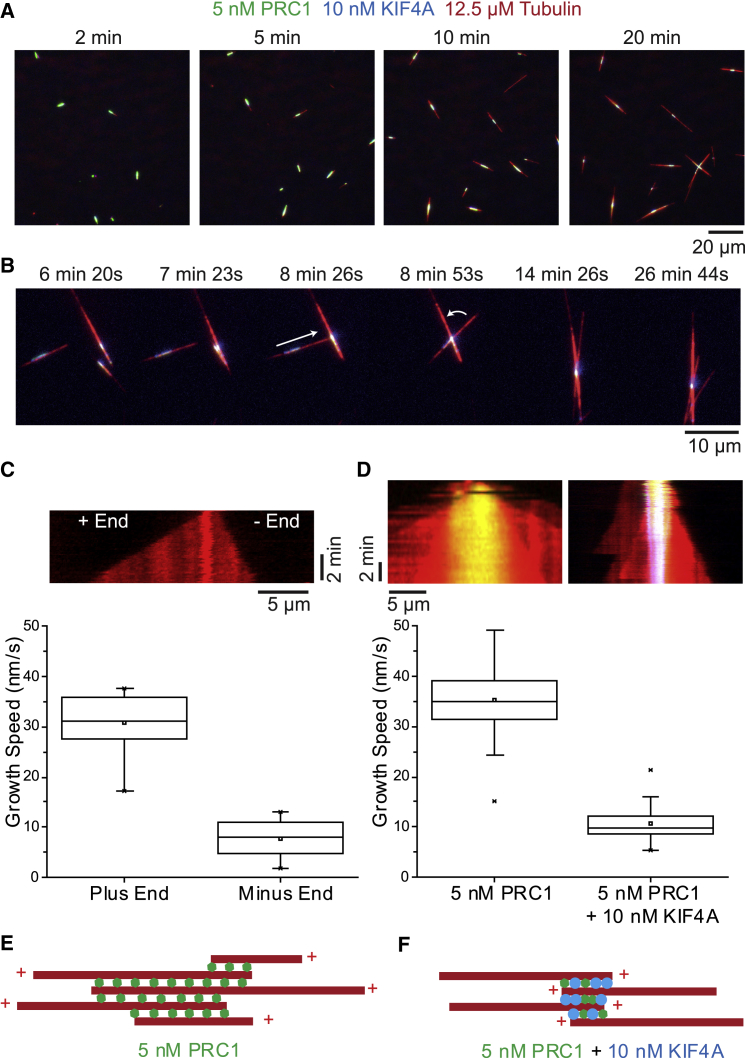
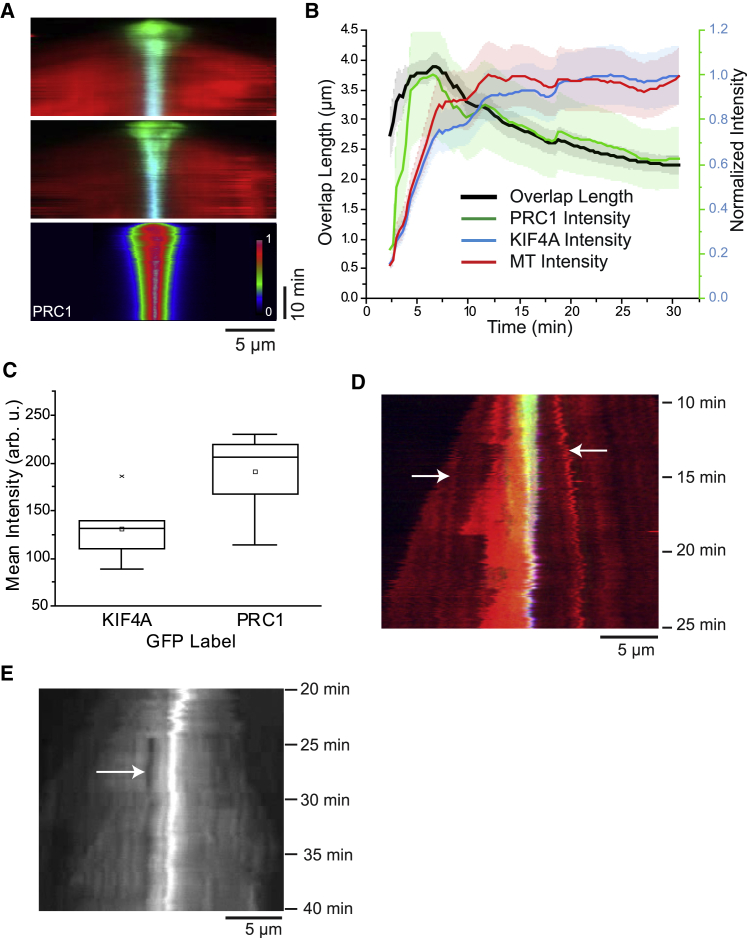
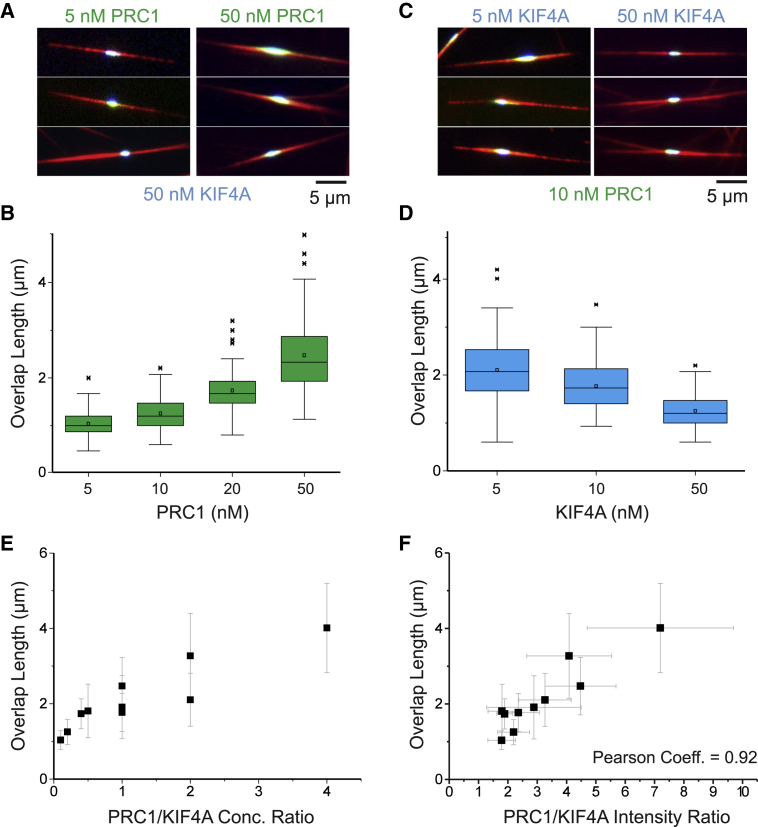
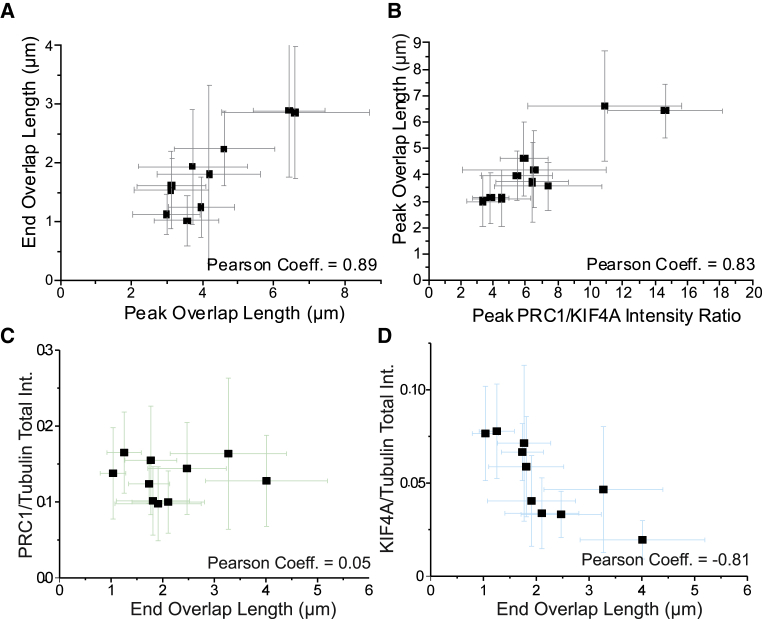
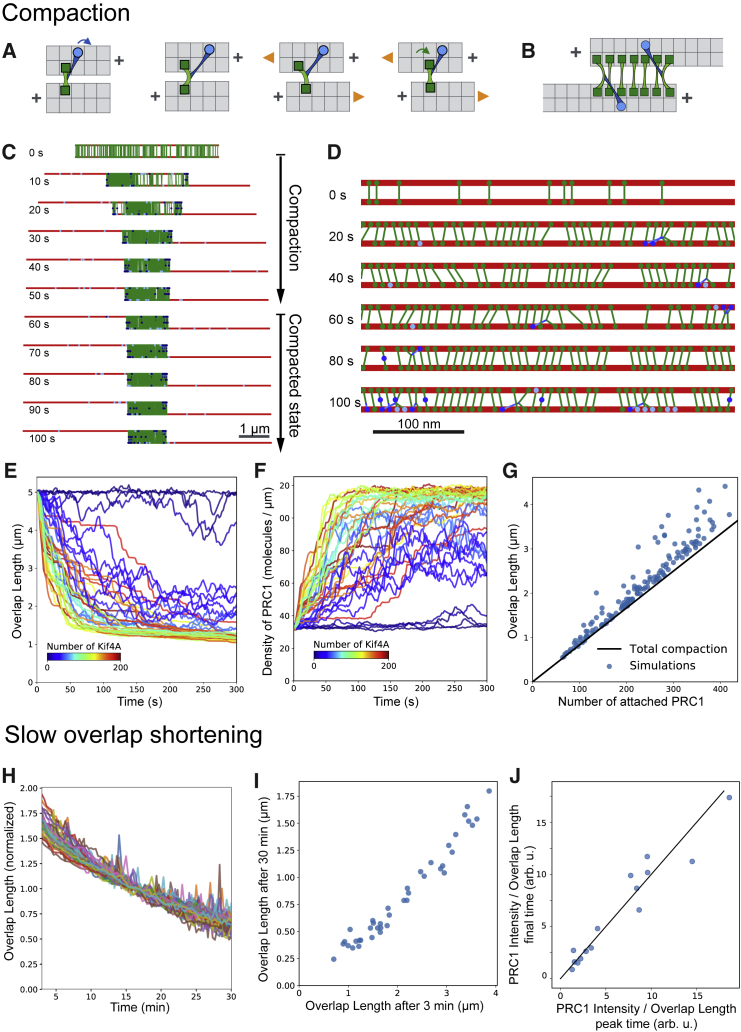
In anaphase spindles, antiparallel microtubules associate to form tight midzone bundles, as required for functional spindle architecture and correct chromosome segregation. Several proteins selectively bind to these overlaps to control cytokinesis. How midzone bundles assemble is poorly understood. Here, using an in vitro reconstitution approach, we demonstrate that minimal midzone bundles can reliably self-organize in solution from dynamic microtubules, the microtubule crosslinker PRC1, and the motor protein KIF4A. The length of the central antiparallel overlaps in these microtubule bundles is similar to that observed in cells and is controlled by the PRC1/KIF4A ratio. Experiments and computer simulations demonstrate that minimal midzone bundle formation results from promoting antiparallel microtubule crosslinking, stopping microtubule plus-end dynamicity, and motor-driven midzone compaction and alignment. The robustness of this process suggests that a similar self-organization mechanism may contribute to the reorganization of the spindle architecture during the metaphase to anaphase transition in cells.

Keywords: Cytosim; anaphase; computer simulation; in vitro reconstitution; kinesin; microtubule; mitotic spindle; motor protein; self-organization; spindle midzone.


Figures

Figure 1
Figure 1
Self-Organization of Minimal Anaphase Midzone Bundles (A) Schematic of PRC1 (top) and KIF4A (bottom) domains and interactions. (B) Schematic of the formation of minimal anaphase midzone bundles. (C) Triple-color TIRF microscopy images showing the time course of self-organization of antiparallel microtubule bundles in the presence of 20-nM PRC1-Alexa546 (green), 50-nM KIF4A-mBFP (blue), and 12.5-μM Alexa647-tubulin (red). Times in minutes after initiating microtubule nucleation by a temperature shift to 30°C are shown. See Video S1. (D) Single- and triple-color TIRF microscopy image sequences (top) and kymographs (bottom) showing PRC1 and KIF4A accumulation in the central part of the antiparallel microtubule bundle; condition as in (C). (E) TIRF microscopy image of individual microtubules polymerized in a solution containing 50-nM KIF4A-mBFP (blue) and 12.5-μM Alexa647-tubulin (red), taken 20 min after initiating nucleation. (F) TIRF microscopy image of microtubule bundles polymerized in the presence of 20-nM PRC1-Alexa546 (green) and 12.5-μM Alexa647-tubulin (red), taken 20 min after initiating nucleation. See Video S2. (G and H) Average normalized PRC1 fluorescence intensity profiles along the bundle axis at 30 min, for microtubule bundles formed in the presence of 20-nM PRC1 only (G; n = 9) and with 20-nM PRC1 and 50-nM KIF4A (H; n = 14). The linewidth shows the SE of the average. The profiles have been fit (red line) with a Gaussian (G; σ = 6.6 μm) and Lorentzian distribution (H; σ = 1.5 μm), respectively. The temperature was 30°C. See also Figures S1 and S6.
Figure 2
Figure 2
Microtubule Organization in Minimal Central Anaphase Spindles (A) TIRF microscopy images of self-organization of minimal anaphase midzone bundles in the presence of 5-nM PRC1-Alexa546 (green), 10-nM KIF4A-mBFP (blue), and 12.5-μM Alexa647-tubulin (red). Times in minutes after initiating microtubule nucleation by a temperature shift to 30°C are shown. (B) Image sequence showing an example of antiparallel midzone bundle fusion and alignment; condition as in (A). (C) (Top) Kymograph of a representative microtubule growing in the presence of 50-nM KIF4A-mBFP only, as in Figure 1E. (Bottom) Boxplot shows the speeds of plus and minus ends from individual dynamic microtubules (n = 18). The box represents the interquartile range (IQR) and whiskers represent the range (-outliers); x = outliers (>1.5 × IQR); box line, median; square, mean. (D) Kymographs (top) and corresponding boxplots (bottom) showing the growth speeds of microtubules growing outward in minimal midzone bundles assembled under conditions as in (A) (n = 32) and from bundles formed only in the presence of 5-nM PRC1-Alexa546 (n = 57). (E) Schematic illustrating the microtubule orientations in PRC1-only bundles (as in Figure 1F). (F) The inverted microtubule orientation in antiparallel bundles formed by both PRC1 and KIF4A (as in A and B and Figures 1C and 1D).
Figure 3
Figure 3
Time Course of Minimal Midzone Bundle Formation (A) (Top) Kymographs showing the time course of the formation of two antiparallel bundles in the presence of 20-nM PRC1-Alexa546 (green), 50-nM KIF4A-mBFP (blue), and 12.5-μM Alexa647-tubulin (red), imaged by TIRF microscopy (condition as in Figures 1C and 1D). (Bottom) Average normalized PRC1 intensity (n = 14) is shown. (B) Mean overlap length and normalized mean total fluorescence intensity measured in the overlap region of minimal midzone bundles for Alexa647-tubulin, PRC1-Alexa546, and KIF4A-mBFP plotted as a function of time (n = 17); protein concentrations as in (A). The shaded areas show the SE. (C) Boxplots showing the mean intensity of KIF4A and PRC1 in the overlap region at the endpoint of overlap formation (∼30 min; n = 8); protein concentrations as in (A). To enable a comparison of absolute final amounts of the proteins, two sets of experiments were done with either the KIF4A or PRC1 labeled with GFP, showing a 1.5- to 2-fold excess of PRC1 over KIF4A. (D) Kymograph showing the tubulin fluorescence of an antiparallel bundle consisting of 3 microtubules soon after nucleation. The white arrows indicate speckles of higher tubulin labeling density, which show slow (∼3 nm/s) antiparallel sliding. Time is in minutes after initiating microtubule nucleation. Protein concentrations are as in Figure 2A. (E) Kymograph showing the tubulin fluorescence of a minimal midzone bundle formed in the presence of 5-nM PRC1-Alexa546, 50-nM KIF4A-mBFP, and 12.5-μM Alexa647-tubulin. A bleach mark was placed on the bundle outside of the central antiparallel microtubule overlap ∼25 min after initiating nucleation. The distance between the bleach mark and the overlap remained constant. The temperature was 30°C. See also Figures S2 and S3.
Figure 4
Figure 4
PRC1 and KIF4A Control Final Antiparallel Microtubule Overlap Length (A) Triple-color TIRF microscopy images showing minimal midzone bundles at different PRC1-Alexa546 concentrations (5 nM and 50 nM, green), with the same KIF4A-mBFP concentration (50 nM, blue), taken ∼40 min after initiating nucleation. See Video S3. (B) Boxplot showing the distribution of final overlap lengths in self-organized minimal midzone bundles measured at t = ∼40 min in the presence of 50-nM KIF4A-mBFP and varying PRC1-Alexa546 concentrations as indicated; n > 100 overlaps for each condition. (C) Triple-color TIRF microscopy images showing minimal midzone bundles at different KIF4A-mBFP concentrations (5 nM and 50 nM, blue), with the same PRC1-Alexa546 concentrations (10 nM, green), taken ∼40 min after initiating nucleation. See Video S4. (D) Boxplot showing the distribution of final overlap lengths in the presence of 10-nM PRC1-Alexa546 and varying concentrations of KIF4A-mBFP. Box represents IQR and whiskers represent range (-outliers); x = outliers (>1.5 × IQR); box line, median; square, mean. (E) Scatterplot of the mean final overlap length as a function of the PRC1/KIF4A concentration ratio. Overlap lengths were measured for the PRC1/KIF4A concentration pairs (in nM/nM): 5/5, 5/10, 5/50, 10/5, 10/10, 10/50, 20/5, 20/10, 20/50, and 50/50 (n > 93 overlaps per condition); error bars represent SD. (F) Scatterplot of the mean final overlap length as a function of the mean total PRC1/KIF4A fluorescence intensity ratio as measured in the same overlaps as in (E); error bars represent SD. The Alexa647-tubulin concentration was always 12.5 μM. The temperature was 30°C. See also Figures S3 and S4.
Figure 5
Figure 5
Overlap Length Correlations (A) The maximum (peak) lengths and the final lengths of antiparallel microtubule overlaps in self-organized minimal midzone bundles were extracted from time courses of overlap length. For each combination of PRC1 and KIF4A concentrations (datasets as used for Figures 4C and 4D), the mean peak overlap length and mean final overlap length show a positive correlation. (B) Plot of the mean peak overlap length against the mean PRC1/KIF4A intensity ratio measured in the overlap at the time of its maximum length, also demonstrating a positive correlation. Errors are SD. (C and D) Mean PRC1/tubulin (C) and mean KIF4A/tubulin (D) total fluorescence intensity ratios in the overlap region versus the mean end overlap length, calculated from the same datasets as used for (A) and (B). See also Figure S4.
Figure 6
Figure 6
Model of Overlap Formation (A) Sliding mechanism. KIF4A pulls a PRC1 molecule that is linking two microtubules, inducing strain on both PRC1 heads. The top PRC1 head releases the strain by biased diffusion toward the plus end. The bottom PRC1 head releases the strain by biased diffusion or microtubule sliding. (B) PRC1 compaction stalls microtubule sliding. (C) Representative simulation with 2 microtubules (length 5 μm), 200 PRC1 and 132 KIF4A (Table S1, set 1). See Video S5. (D) Magnified view of the simulation shown in (C). See Video S6. (E) Dynamics of overlap length in simulations (mircotubule length 5 μm; 200 PRC1; Table S1, set 1). Lines stand for individual simulations where the number of KIF4A varies from 0 to 200 (see color scale). (F) PRC1 density for the same simulations as in (E). (G) Scatterplot showing the correlation between the length of the overlap and the number of PRC1 molecules attached in the overlap after 300 s. Each dot represents one simulation (Table S1, set 1) but with randomized numbers of KIF4A (30–200) and PRC1 (100–600) and microtubule length (3–7 μm). The diagonal black line represents full compaction (i.e., one molecule per 8 nm). (H) Shortening of overlaps in different simulations containing 100 KIF4A and between 100 and 600 PRC1 (Table S1, set 1). In these simulations, compaction is reached earlier than 3 min after KIF4A addition (E), and this plot focuses on later times. (I) Overlap at 3 min (when total compaction reached) versus overlap at 30 min for data shown in (H). (J) Comparison between the experimental ratio between PRC1 intensity and overlap length, at the time of maximal overlap (x axis) and at final time (y axis). Dots represent individual overlaps from the data shown in Figure 3B. The diagonal indicates perfect conservation of this quantity. See also Figure S5.

References

    1. Douglas M.E., Mishima M. Still entangled: assembly of the central spindle by multiple microtubule modulators. Semin. Cell Dev. Biol. 2010;21:899–908. - PubMed
    2. Douglas, M.E., and Mishima, M. (2010). Still entangled: assembly of the central spindle by multiple microtubule modulators. Semin. Cell Dev. Biol. 21, 899-908. - PubMed
    1. Glotzer M. The 3Ms of central spindle assembly: microtubules, motors and MAPs. Nat. Rev. Mol. Cell Biol. 2009;10:9–20. - PMC - PubMed
    2. Glotzer, M. (2009). The 3Ms of central spindle assembly: microtubules, motors and MAPs. Nat. Rev. Mol. Cell Biol. 10, 9-20. - PMC - PubMed
    1. Mastronarde D.N., McDonald K.L., Ding R., McIntosh J.R. Interpolar spindle microtubules in PTK cells. J. Cell Biol. 1993;123:1475–1489. - PMC - PubMed
    2. Mastronarde, D.N., McDonald, K.L., Ding, R., and McIntosh, J.R. (1993). Interpolar spindle microtubules in PTK cells. J. Cell Biol. 123, 1475-1489. - PMC - PubMed
    1. Green R.A., Paluch E., Oegema K. Cytokinesis in animal cells. Annu. Rev. Cell Dev. Biol. 2012;28:29–58. - PubMed
    2. Green, R.A., Paluch, E., and Oegema, K. (2012). Cytokinesis in animal cells. Annu. Rev. Cell Dev. Biol. 28, 29-58. - PubMed
    1. Jiang W., Jimenez G., Wells N.J., Hope T.J., Wahl G.M., Hunter T., Fukunaga R. PRC1: a human mitotic spindle-associated CDK substrate protein required for cytokinesis. Mol. Cell. 1998;2:877–885. - PubMed
    2. Jiang, W., Jimenez, G., Wells, N.J., Hope, T.J., Wahl, G.M., Hunter, T., and Fukunaga, R. (1998). PRC1: a human mitotic spindle-associated CDK substrate protein required for cytokinesis. Mol. Cell 2, 877-885. - PubMed

Publication types

MeSH terms

LinkOut - more resources