. 2019 May 24:10:623.
doi: 10.3389/fphys.2019.00623. eCollection 2019.

Post-mortem Characterisation of a Case With an ACTG1 Variant, Agenesis of the Corpus Callosum and Neuronal Heterotopia

Affiliations

Post-mortem Characterisation of a Case With an ACTG1 Variant, Agenesis of the Corpus Callosum and Neuronal Heterotopia

Regina Vontell et al. Front Physiol. .

Abstract

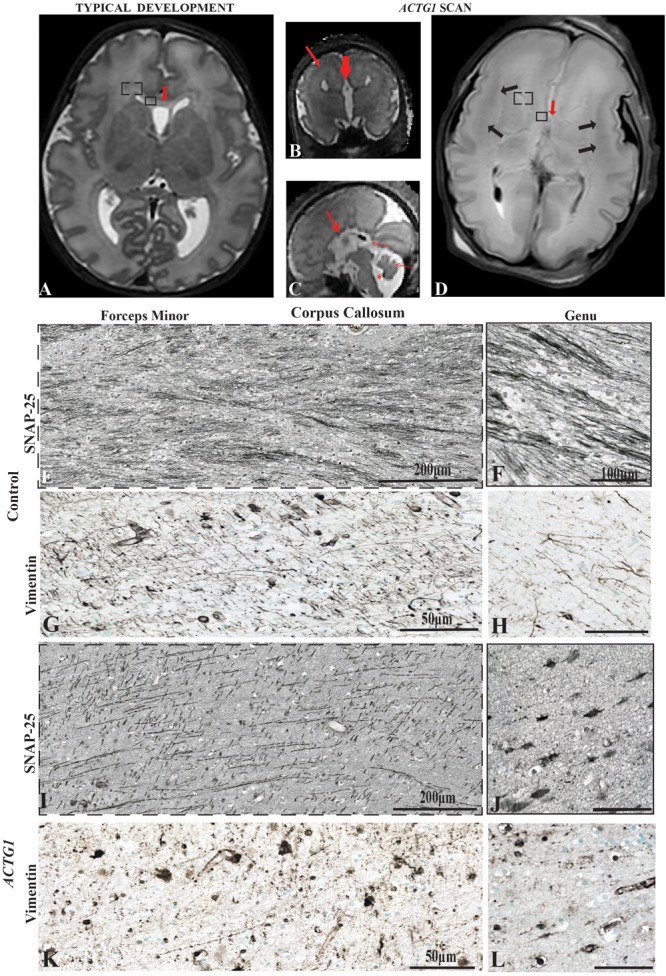
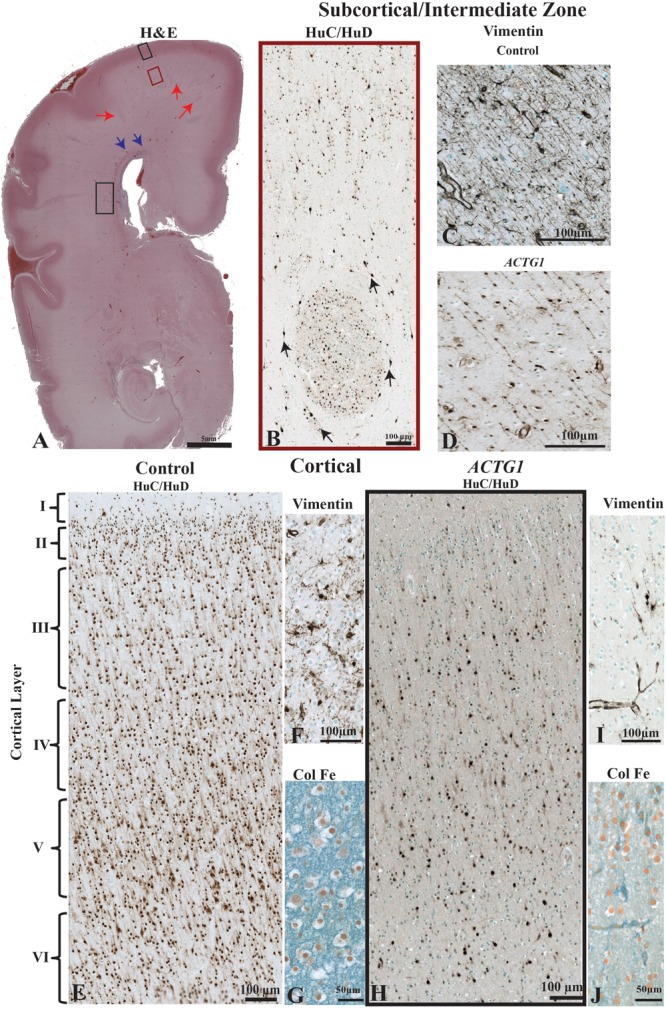
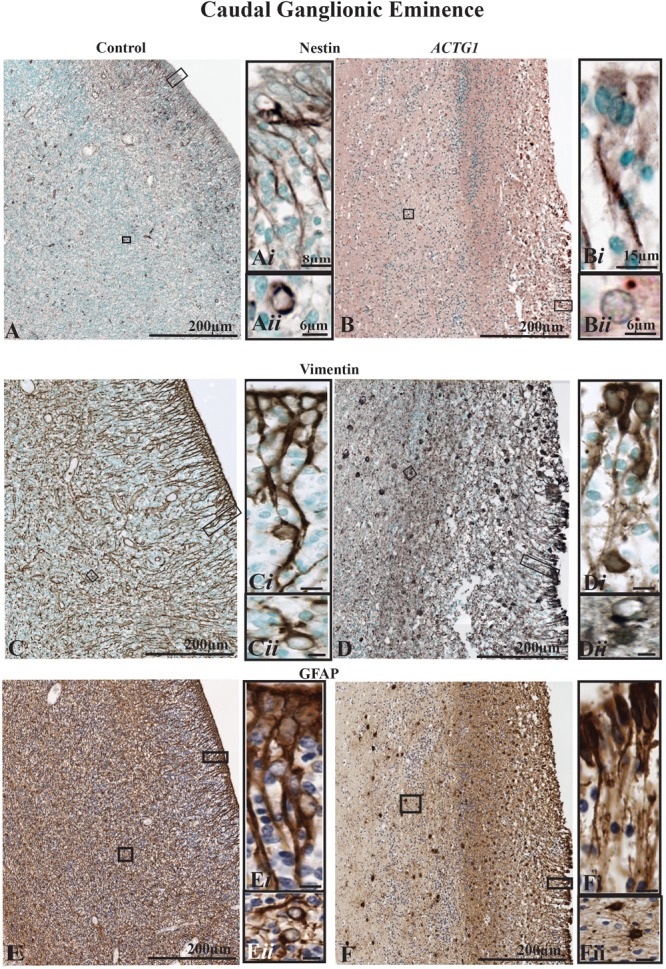
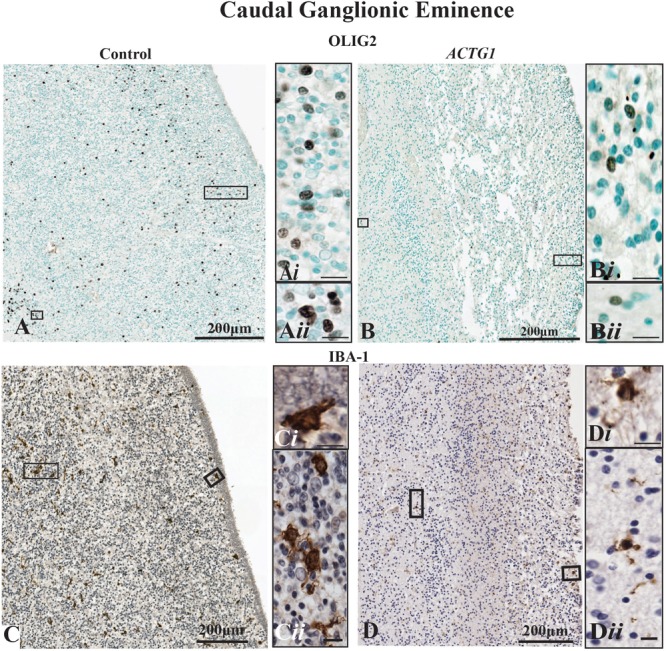
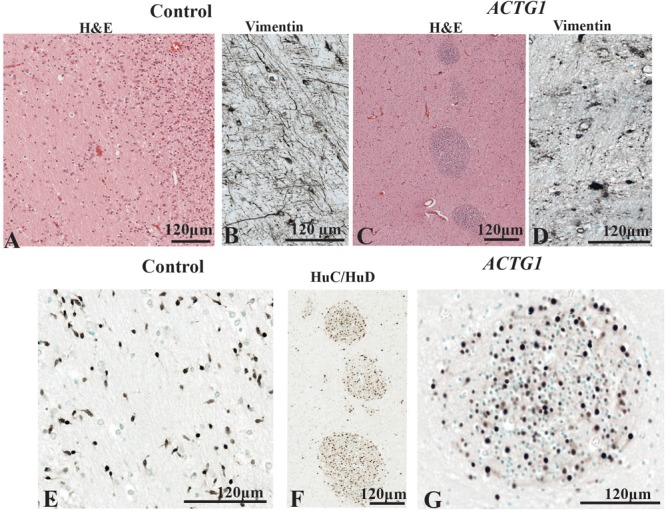
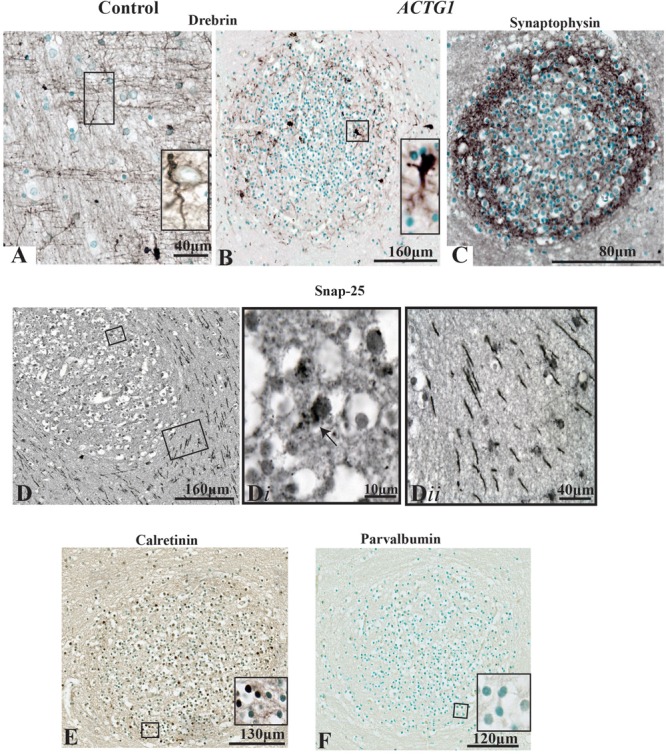
Cytoplasmic Actin Gamma 1 (ACTG1) gene variant are autosomal dominant and can cause CNS anomalies (Baraitser Winter Malformation Syndrome; BWMS). ACTG1 anomalies in offspring include agenesis of the corpus callosum (ACC) and neuronal heterotopia which are ectopic nodules of nerve cells that failed to migrate appropriately. Subcortical and periventricular neuronal heterotopia have been described previously in association with ACC. In this case report, we investigated a neonatal brain with an ACTG1 gene variant and a phenotype of ACC, and neuronal heterotopia (ACC-H) which was diagnosed on antenatal MR imaging and was consistent with band heterotopia seen on post-mortem brain images. Histologically clusters of neurons were seen in both the subcortical and periventricular white matter (PVWM) brain region that coincided with impaired abnormalities in glial formation. Immunohistochemistry was performed on paraffin-embedded brain tissue blocks from this case with ACTG1 variant and an age-matched control. Using tissue sections from the frontal lobe, we examined the distribution of neuronal cells (HuC/HuD, calretinin, and parvalbumin), growth cone (drebrin), and synaptic proteins (synaptophysin and SNAP-25). Additionally, we investigated how the ACTG1 variant altered astroglia (nestin, GFAP, vimentin); oligodendroglia (OLIG2) and microglia (Iba-1) in the corpus callosum, cortex, caudal ganglionic eminence, and PVWM. As predicted in the ACTG1 variant case, we found a lack of midline radial glia and glutamatergic fibers. We also found disturbances in the cortical region, in glial cells and a lack of extracellular matrix components in the ACTG1 variant. The caudal ganglionic eminence and the PVWM regions in the ACTG1 variant lacked several cellular components that were identified in a control case. Within the neuronal heterotopia, we found evidence of glutamatergic and GABAergic neurons with apparent synaptic connections. The data presented from this case study with BWMS with variants in the ACTG1 gene provides insight as to the composition of neuronal heterotopia, and how disturbances of important migratory signals may dramatically affect ongoing brain development.

Keywords: corpus callosum; growth cone; heterotopia; radial glia; synaptic proteins.


Figures

FIGURE 1
FIGURE 1
Magnetic Resonance Imaging axial plane using T2 weighted images. In the transverse orientation, the scans show normal anatomical characteristics of a fetal brain at 35 GA wks (A). Coronal T2 weighted image of the case with a variant in the ACTG1 gene and agenesis of the corpus callosum with neuronal heterotopia (ACC-H) at 35.30 weeks showing the absence of the corpus callosum (thick red arrow) and prominent low signal intensity band in the subcortical white matter (thin red arrow; B). The sagittal T2 weighted image of the ACTG1 variant, shows the absence of the corpus callosum (thick red arrow) and shortened cerebellar vermis, rotated away from the brainstem (thin red arrow) giving an enlarged fourth ventricle (asterisk; C). The genu of the corpus callosum is seen in panel (A; red arrow) but is absent in the case with agenesis of the corpus callosum (ACTG1 variant, D, red arrow). On post-mortem imaging, the brain in the fetal case with ACTG1 variant (D) showed an absence of the corpus callosum and decreased cortical folding frontally. There is extensive bilateral abnormal low signal intensity within the subcortical white matter (black arrows) on the T2 weighted MRI. Immunostaining of SNAP-25 (E,F,I,J) and vimentin (G,H,K,L) from the forceps minor (E,G,I,K) and the genu (F,H,J,L) of the corpus callosum of the frontal lobe (represented as a box-in region in images A,D). Image E shows normal axonal fibers in the control, whereas, in the photomicrograph I the axons are not as numerous and have unusual tangential fibers seen in ACTG1 variant. Images (F,J), show SNAP-25 positive fibers in the genu of the corpus callosum from the control case (F) which are severely reduced in ACC-H (J). The callosal fibers rely on the midline glial structures to serve as guidance mechanisms. Image (G) shows normal vimentin positive indusium griseum glia (IGG) that guide the callosal axons of forceps minor. The horizontal IGGs are punctate in the ACTG1 variant (K). Callosal fibers cross the hemisphere by following tracts laid out by the glial wedge as seen in the control (H) which are absent in the ACTG1 variant (L). Scale bar in images (H,J,L) = 100 μm.
FIGURE 2
FIGURE 2
The morphological differences between the age match control and the case with ACTG1 variant, neuronal heterotopia, and agenesis of the corpus callosum. In image (A), a coronally oriented scan from Haematoxylin and Eosin (H&E) staining of the frontal lobe of the brain of the ACTG1 variant shows neuronal heterotopia in the subcortical, intermediate zone white matter (red arrows) and in the periventricular white matter regions (black rectangle). The blue arrows in image (A), are pointing to a region where there are severe disruptions of the callosal fiber tracts. In image (B), the immunoreactivity of anti-HuC/HuD from the subcortical region (from the red-boxed region on image A) shows an example of a whirling heterotopia with neurons located in and around a nodular structure. The black arrows are pointing to neurons adjacent to the heterotopia. Image (C), show the immunoreactivity from using anti-vimentin, which identifies radial glia and astrocytes in the control. In the ACTG1 variant (D), the vimentin-positive radial glia are fragmented and sporadically situated. The black boxed seen in image (A) in the rostral frontal cortical region from the ACTG1 variant is exemplified in image (H) using anti-mouse HuC/HuD. This image shows the poorly distribution of cortical neurons compared to the control in image (E). Anti-vimentin staining of the cortex (F,I) show normal radial glia fiber end (F; control) which are nearly absent (I; ACTG1 variant). Additional differences can be seen in the extracellular matrix in the cortex using the Colloidal Iron Stain. Image (G) shows a vast perineuronal network with hyaluronic acid complexes, which is not as dense in the ACTG1 variant (J).
FIGURE 3
FIGURE 3
Immunoreactivity of cell proliferation (MIB-1) neurons (HuC/HuD) and growth cone structures (Drebrin) from the caudal ganglionic eminence (CGE) of a control case (32 GA wks; A,C,E) and the case with heterotopia and agenesis of the corpus callosum (ACTG1 variant; 35 GA wks; B,D,F). In image (A), the black arrows are pointing to positive cells for mouse anti-MIB-1 (ki-67) and demonstrate a reasonable distribution of proliferating cells (Ai). Whereas, in image (B), the red arrows are pointing to the sparse population of proliferative cells in the ACTG1 variant that are not as strongly stained (Bi). HuC/HuD immunoreactivity shows the neuronal population in the CGE is seen in the control brain (C,Ci) and in ACTG1 variant (D,Di). Drebrin positive, growth structures are seen in images (E,F). The control brain is densely packed with growth cones (E) and the inset shows elongating extensions arising from the cell (black arrows; Ei). The ACTG1 variant has neurons that are positive for drebrin (F), but the cell shown in the inset (Fi) exemplifies that the staining is dense and fragmented rather than perinuclear with long extensions.
FIGURE 4
FIGURE 4
The radial glia proliferation and filament marker, nestin (images A,B), and the radial glia and astroglia markers [vimentin (images C,D) and GFAP (images E,F)] in the caudal ganglionic eminence (CGE). Immunoreactivity of nestin in the control brain (A) demonstrates a normal distribution along the ependymal cells that develop from tanycytes, types of transitional cells with radially extending processes that extend from the lining of the ventricle (Ai) into the lateral ganglionic eminence. Image (Aii) shows a newly form astrocyte, that was probably migrating out of the CGE with perinuclear nestin expression. The ependymal lining is fragmented in the case with heterotopia and agenesis of the corpus callosum (ACC-H; images B,D,F) and the nestin-positive radial glial are sparse and lack the long extending processes (Bi) additionally astroglia seen in the CGE do not have strong perinuclear staining (Bii). The mouse anti-vimentin and the mouse anti-GFAP immunostaining show a similar pattern to the Nestin in the cases. In the control case (C,E) there densely packed radial glia and the fibers are strongly positive for vimentin (C,Ci) and GFAP (E,Ei). Immature astrocytes are seen in the CGE (Cii,Eii) with stout processes. Whereas, in the ACTG1 variant (D,F) the radial glia fibers are thin (Di,Fi) and fragmented as they emerge from the ventricular lining. In the CGE of the ACTG1 variant, there are dense vimentin and GFAP positive cuboidal gliotic astrocytes (Dii,Fii). Scale bar in images (Ci–Fii) = 8 μm.
FIGURE 5
FIGURE 5
Oligodendroglia and microglia populations shown with markers for mouse anti-OLIG2 and rabbit anti-Iba-1. In the control case (image A) the OLIG2 positive cells are dispersed throughout the caudal ganglionic eminence (CGE), and the insets show densely OLIG2 positive nuclei (Ai,Aii) found throughout the CGE. Image (B) demonstrates that the OLIG2 positive nuclei in the CGE lack in the heterotopia and agenesis of the corpus callosum (ACC-H) case (insets Bi,Bii). The immunoreactivity of rabbit anti-Iba-1 shows ameboidal microglia (C) are seen in the beneath the ependymal cells (Ci) of the CGE and in regions adjacent to the white matter (Cii) of the control case. The ACTG1 variant (D) show Iba-1 immuno-stained microglia beneath the ependymal cells (Di), but in the CGE adjacent to the white matter the microglia in the ACTG1 variant are much smaller (Dii). Scale bar in inset images = 9 μm.
FIGURE 6
FIGURE 6
The periventricular white matter (PVWM) adjacent to the caudal ganglionic eminence (CGE; see Figure 2A). In the control, the hematoxylin stain shows the normal morphology of the PVWM (A) whereas in the case ACTG1 variant and heterotopia and agenesis of the corpus callosum (ACC-H) cellular clusters are found instead white matter fibers (C). Inside the control (B) case there are linear radial glial along with perpendicular astroglia seen with anti-vimentin, however, in the ACTG1 variant, the astroglia processes are disjointed (D). The HuC/HuD immunostaining in the control case demonstrates migrating neurons within the PVWM (E) in the control case. Images (F,G) show that the cellular clusters are neuronal heterotopia seen the ACTG1 variant using mouse anti-HuC/HuD.
FIGURE 7
FIGURE 7
Photomicrographs of the periventricular white matter (PVWM) region adjacent to the caudal ganglionic eminence (CGE; outlined in Figure 2) demonstrating the growth cone proteins (anti-drebrin), synaptic connections (anti-synaptophysin and anti-SNAP-25) and interneuronal proteins (anti-calretinin and anti-parvalbumin). In the control case (A) anti-drebin expression is seen on growth cones as long bipolar extensions. In contrast, the case with ACTG1 variant, heterotopia are identified with neurons expressing dense drebrin protein with blunt and short extensions (B). The immunoreactivity of synaptophysin densely surrounds the outer regions of the neuronal heterotopia (C). Detection of glutamatergic cells inside the neuronal heterotopia is seen with anti-SNAP-25 staining (D,Di). Of interest, the PVWM region surrounding the neuronal heterotopia have SNAP-25 positive axons (Dii). Additionally, rabbit anti-calretinin neurons seen in the neuronal heterotopia (E) however, the neuronal heterotopia were negative for rabbit anti-parvalbumin (F).

References

    1. Achiron R., Achiron A. (2001). Development of the human fetal corpus callosum: a high-resolution, cross-sectional sonographic study. Ultrasound Obstet. Gynecol. 18 343–347. 10.1046/j.0960-7692.2001.00512.x - DOI - PubMed
    1. Antonucci F., Corradini I., Morini R., Fossati G., Menna E., Pozzi D., et al. (2013). Reduced SNAP-25 alters short-term plasticity at developing glutamatergic synapses. EMBO Rep. 14 645–651. 10.1038/embor.2013.75 - DOI - PMC - PubMed
    1. Bramanti V., Tomassoni D., Avitabile M., Amenta F., Avola R. (2010). Biomarkers of glial cell proliferation and differentiation in culture. Front. Biosci. 2 558–570. 10.2741/s85 - DOI - PubMed
    1. Brazel C. Y., Romanko M. J., Rothstein R. P., Levison S. W. (2003). Roles of the mammalian subventricular zone in brain development. Prog. Neurobiol. 69 49–69. 10.1016/s0301-0082(03)00002-9 - DOI - PubMed
    1. Bruckner G., Brauer K., Hartig W., Wolff J. R., Rickmann M. J., Derouiche A., et al. (1993). Perineuronal nets provide a polyanionic, glia-associated form of microenvironment around certain neurons in many parts of the rat brain. Glia 8 183–200. 10.1002/glia.440080306 - DOI - PubMed