. 2019 Jun 7:10:1247.
doi: 10.3389/fimmu.2019.01247. eCollection 2019.

CD49a Expression Identifies a Subset of Intrahepatic Macrophages in Humans

Affiliations

CD49a Expression Identifies a Subset of Intrahepatic Macrophages in Humans

Glòria Martrus et al. Front Immunol. .

Abstract

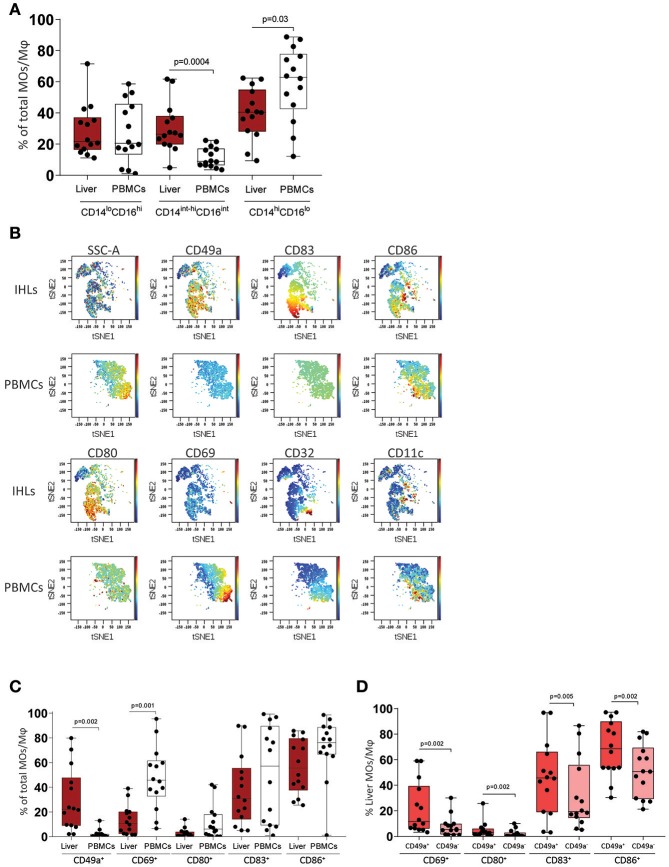
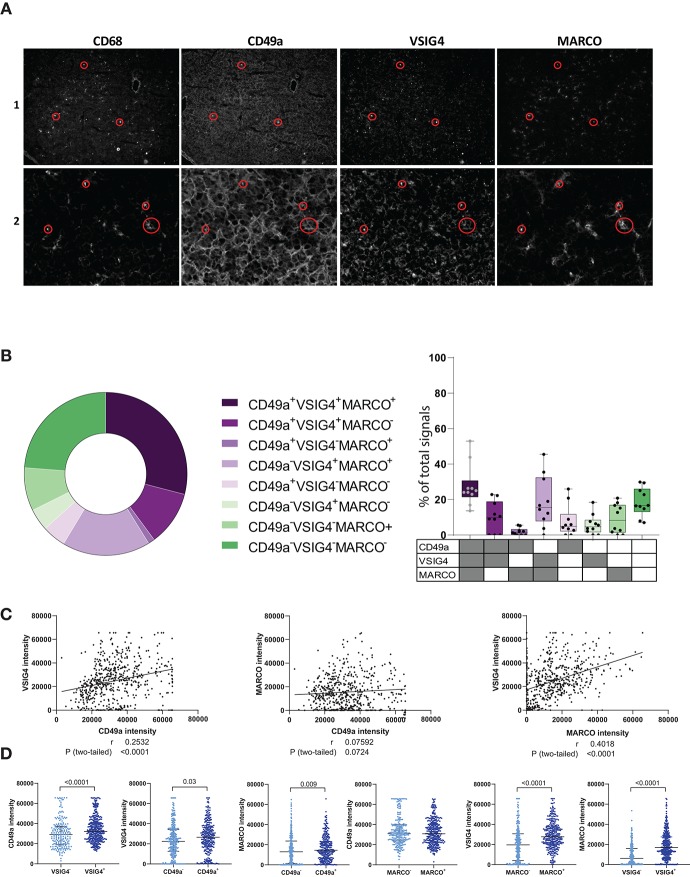
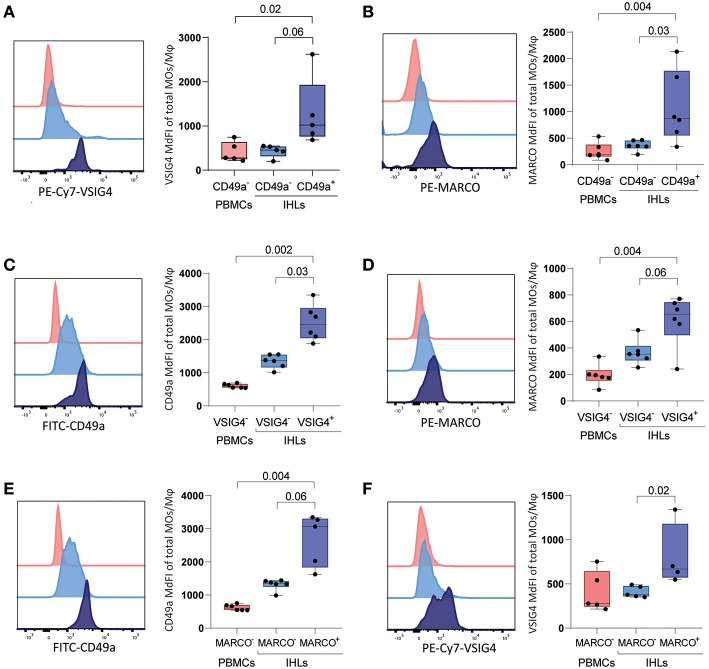
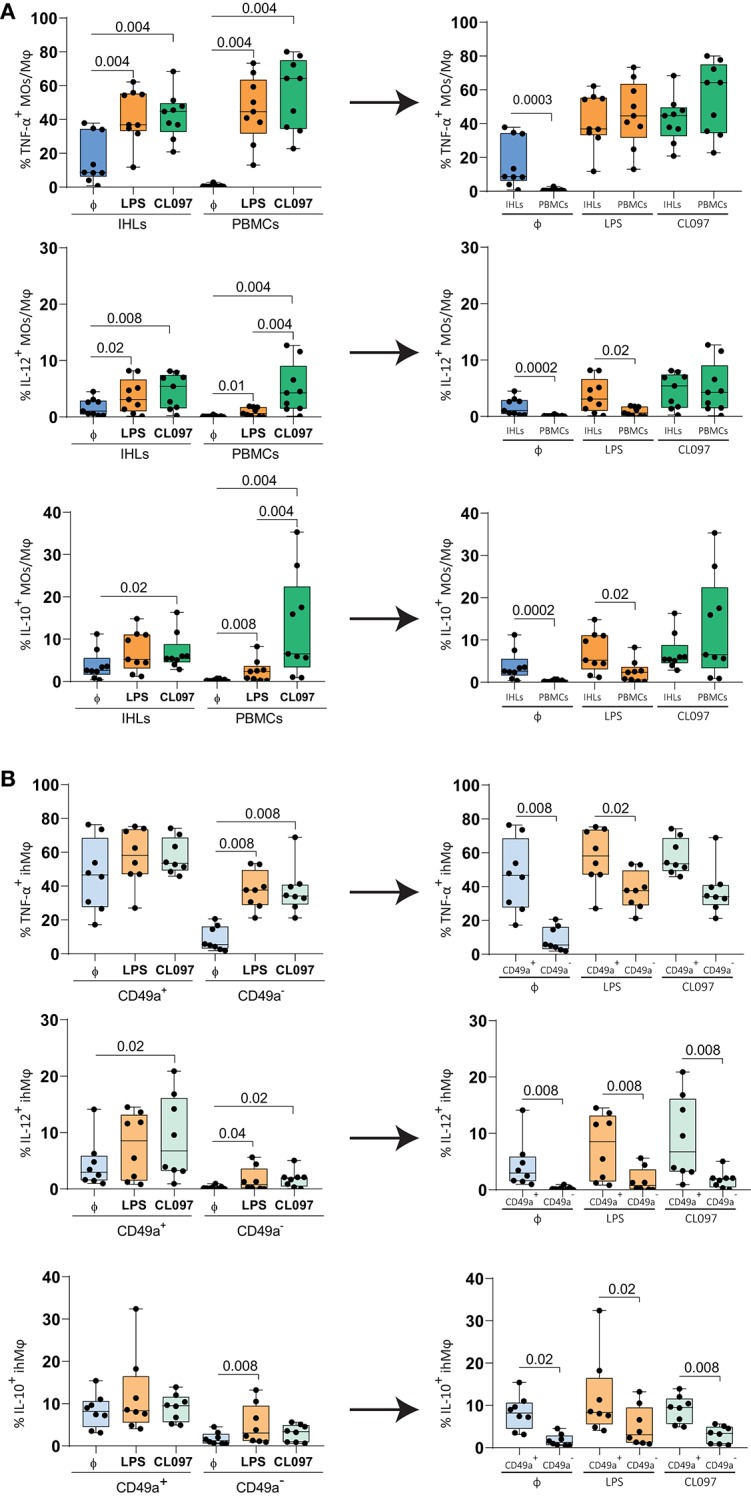
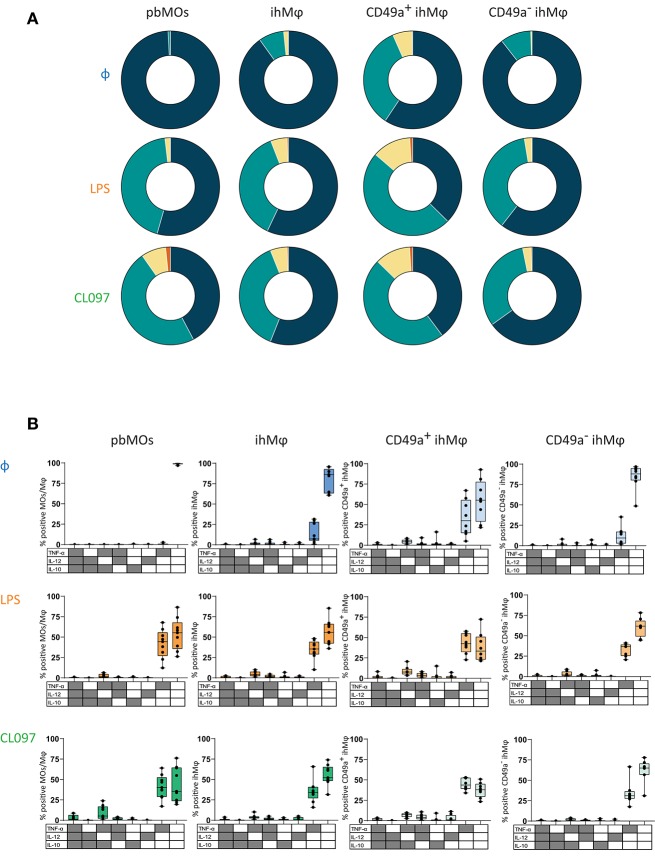
Macrophages play central roles in inflammatory reactions and initiation of immune responses during infections. More than 80% of total tissue macrophages are described to be located in the liver as liver-resident macrophages, also named Kupffer cells (KCs). While studies in mice have established a central role of liver-resident KCs in regulating liver inflammation, their phenotype and function are not well-characterized in humans. Comparing paired human liver and peripheral blood samples, we observed significant differences in the distribution of macrophage (Mφ) subsets, with lower frequencies of CD14hiCD16lo and higher frequencies of CD14int-hiCD16int Mφ in human livers. Intrahepatic Mφ consisted of diverse subsets with differential expression of CD49a, a liver-residency marker previously described for human and mice NK cells, and VSIG4 and/or MARCO, two recently described human tissue Mφ markers. Furthermore, intrahepatic CD49a+ Mφ expressed significantly higher levels of maturation and activation markers, exhibited higher baseline levels of TNF-α, IL-12, and IL-10 production, but responded less to additional in vitro TLR stimulation. In contrast, intrahepatic CD49a- Mφ were highly responsive to stimulation with TLR ligands, similar to what was observed for CD49a- monocytes (MOs) in peripheral blood. Taken together, these studies identified populations of CD49a+, VSIG4+, and/or MARCO+ Mφ in human livers, and demonstrated that intrahepatic CD49a+ Mφ differed in phenotype and function from intrahepatic CD49a- Mφ as well as from peripheral blood-derived monocytes.

Keywords: CD49a; cell activation; human liver; monocytes/macrophages; tissue residency.


Figures

Figure 1
Figure 1
Immunophenotyping of macrophages (Mφ) and monocytes (MOs) in leukocytes from liver (IHLs) and blood (PBMCs). (A) Comparison of cell subset distribution between intrahepatic leukocytes (IHLs) (dark red) and matched peripheral blood mononuclear cells (PBMCs) (white) (n = 14). (B) t-SNE analysis of one representative sample showing the expression of CD49a, CD83, CD86, CD32, CD80, CD11c, and CD69 in both PBMCs and IHLs. (C) Scatter plots showing the frequency of CD49a+, CD69+, CD80+, CD83+, and CD86+ cells on Mφ on IHLs (dark red) and MOs on PBMCs (white). (D) Scatter plots showing the frequency of CD69+, CD80+, CD83+, and CD86+ cells on CD49a+ ihMφ (red) and CD49a ihMφ (salmon). Median with min-max range is shown (n = 14). All samples were analyzed using Mann-Whitney test and were additionally corrected for test-multiplicity using the original FDR method of Benjamini and Hochberg. Only statistically significant p-values are shown.
Figure 2
Figure 2
Immunofluorescence data showing CD49a, VSIG4 and MARCO expression in human intrahepatic macrophages. (A) Representative immunofluorescence staining of CD68, CD49a, VSIG4, and MARCO in frozen and acetone-fixed liver tissue sections in two liver samples. The red circles depict examples of co-expression of the four markers. (B) Boolean gating on masked CD68+ signals defining CD49a, VSIG4 and MARCO signal combinations (n = 561 signals from 10 tissue slides). (C) Correlation plots between CD49a and VSIG4 signal intensity (left), CD49a and MARCO (middle) and MARCO and VSIG4 (right) in cells defined as CD68+ (n = 561 pairs). (D) Scatter plots showing signal intensities of CD49a, MARCO and VSIG4 on CD68+ cells, categorized by VSIG4+/− (n = 209 for VSIG4 and n = 352 for VSIG4+), CD49a+/− (n = 291 for CD49a and n = 270 for CD49a+), and MARCO+/− signals (n = 247 for MARCO and n = 314 for MARCO+). Negative signals for each marker are represented in light blue and positive signals in dark blue. Median is depicted and error bars indicate the interquartile range, p-value determined by Mann–Whitney test.
Figure 3
Figure 3
Expression of VSIG4, MARCO and CD49a on freshly isolated PBMCs and IHLs (A) (left) Representative histogram of VSIG4 expression on gated CD49a PBMCs (red), CD49a ihMφ (light blue), and CD49a+ ihMφ (dark blue). (right) Scatter plot summarizing VSIG4 MdFI on CD49a PBMCs (red), CD49a ihMφ (light blue) and CD49a+ ihMφ (dark blue) (n = 5). (B) (left) Representative histogram of MARCO expression on gated CD49a PBMCs (red), CD49a ihMφ (light blue) and CD49a+ ihMφ (dark blue). (right) Scatter plot summarizing MARCO MdFI on CD49a PBMCs (red), CD49a ihMφ (light blue) and CD49a+ ihMφ (dark blue) (n = 6). (C) (left) Representative histogram of CD49a expression on gated VSIG4 PBMCs (red), VSIG4 ihMφ (light blue) and VSIG4+ ihMφ (dark blue). (right) Scatter plot summarizing CD49a MdFI on VSIG4 PBMCs (red), VSIG4 ihMφ (light blue) and VSIG4+ ihMφ (dark blue) (n = 6). (D) (left) Representative histogram of MARCO expression on gated VSIG4 PBMCs (red), VSIG4 ihMφ (light blue) and VSIG4+ ihMφ (dark blue). (right) Scatter plot summarizing MARCO MdFI on VSIG4 PBMCs (red), VSIG4 ihMφ (light blue) and VSIG4+ ihMφ (dark blue) (n = 6). (E) (left) Representative histogram of CD49a expression on gated MARCO PBMCs (red), MARCO ihMφ (light blue) and MARCO+ ihMφ (dark blue). (right) Scatter plot summarizing CD49a MdFI on MARCO PBMCs (red), MARCO ihMφ (light blue) and MARCO+ ihMφ (dark blue) (n = 6 for PBMCs and MARCO IHLs, n = 5 for MARCO+ IHLs). (F) (left) Representative histogram of VSIG4 expression on gated MARCO PBMCs (red), MARCO ihMφ (light blue) and MARCO+ ihMφ (dark blue). (right) Scatter plot summarizing VSIG4 MdFI on MARCO PBMCs (red), MARCO ihMφ (light blue) and MARCO+ ihMφ (dark blue) (n = 5 for PBMCs and MARCO IHLs, n = 4 for MARCO+ IHLs). One sample was excluded due to the low proportion of MARCO+ cells. Median is depicted and error bars indicate the min-max range, p-value determined by Mann-Whitney test (PBMCs vs. IHLs) and Wilcoxon matched-pairs signed rank test when comparing IHL populations.
Figure 4
Figure 4
Functional responses of paired ihMφ and pbMOs to CL097 and LPS stimulations compared to unstimulated cells. (A) Scatter plots showing the comparison of the frequencies of TFN-α+ cells (top), IL-12+ cells (middle) and IL-10+ cells (bottom) between pbMOs and ihMϕ stimulated with LPS (orange) or CL097 (green), to unstimulated cells (blue) (n = 9). (B) Comparison of the frequency of TFN-α+ ihMφ (top) IL-12+ ihMφ (middle) and IL-10+ (bottom) cells between CD49a+ and CD49a ihMφ once stimulated with LPS (light orange) or CL097 (light green), to unstimulated cells (light blue) (n = 8). Medians and min-max range are showed. Liver and PBMCs comparisons were analyzed with a Mann–Whitney test and corrected for test-multiplicity using the original FDR method of Benjamini and Hochberg. Data in (B) was analyzed using a Wilcoxon matched-pairs signed rank test when comparing IHL populations. The arrows represent the reorganization of the same data. One sample was excluded from B due to the low amount of cells within the CD49a+ ihMφ gating. Φ: unstimulated. Only statistically significant p-values are shown.
Figure 5
Figure 5
Polyfunction on cytokine responses of paired ihMφ and pbMOs. (A) Pie chart summarizing the percentage of MOs/Mφ expressing 0, 1, 2, or 3 cytokines, without stimulation or following LPS- or CL097-stimulation (blue: 0; green 1; yellow: 2; orange: 3) (n = 9 for pbMOs and ihMφ, n = 8 for CD49a+ ihMφ and CD49a ihMφ). (B) Boolean gating of cells expressing TNF-α, IL-12, and/or IL-10 on LPS-(orange), CL097-(green)stimulated pbMOs, ihMφ, CD49a+ ihMφ, and CD49a ihMφ. Unstimulated (blue) condition was used to calculate the baseline production of cytokines. One sample was excluded from the ihMφ analysis due to the low amount of cells within the CD49a+ ihMφ gating Medians and min-max range are showed.

References

    1. Manzella A, Ohtomo K, Monzawa S, Lim JH. Schistosomiasis of the liver. Abdom Imaging. (2008) 33:144–50. 10.1007/s00261-007-9329-7 - DOI - PubMed
    1. Crispe IN. Immune tolerance in liver disease. Hepatology. (2014) 60:2109–17. 10.1002/hep.27254 - DOI - PMC - PubMed
    1. Huang H, Lu Y, Zhou T, Gu G, Xia Q. Innate immune cells in immune tolerance after liver transplantation. Front Immunol. (2018) 9:2401. 10.3389/fimmu.2018.02401 - DOI - PMC - PubMed
    1. Crispe IN. The liver as a lymphoid organ. Annu Rev Immunol. (2009) 27:147–63. 10.1146/annurev.immunol.021908.132629 - DOI - PubMed
    1. Gao B, Jeong WI, Tian Z. Liver: an organ with predominant innate immunity. Hepatology. (2008) 47:729–36. 10.1002/hep.22034 - DOI - PubMed

Publication types

Substances