. 2019 Jun 4:10:442.
doi: 10.3389/fgene.2019.00442. eCollection 2019.

Genome Sequence Analysis Reveals Selection Signatures in Endangered Trypanotolerant West African Muturu Cattle

Affiliations

Genome Sequence Analysis Reveals Selection Signatures in Endangered Trypanotolerant West African Muturu Cattle

Abdulfatai Tijjani et al. Front Genet. .

Abstract

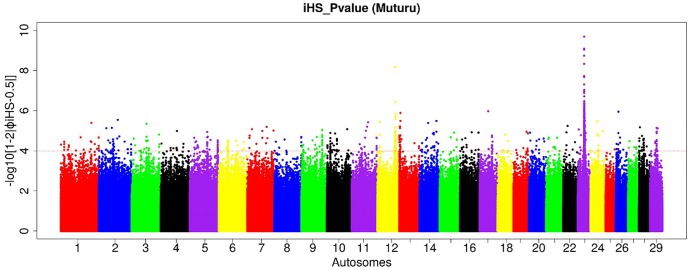
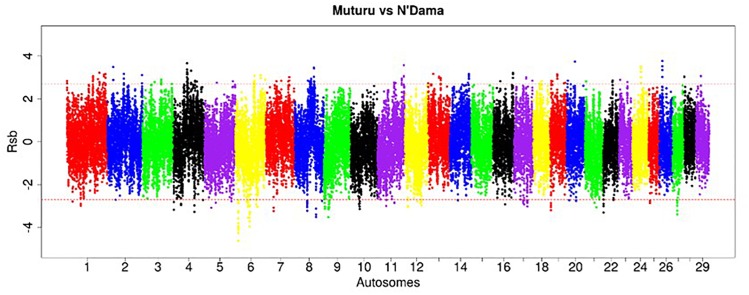
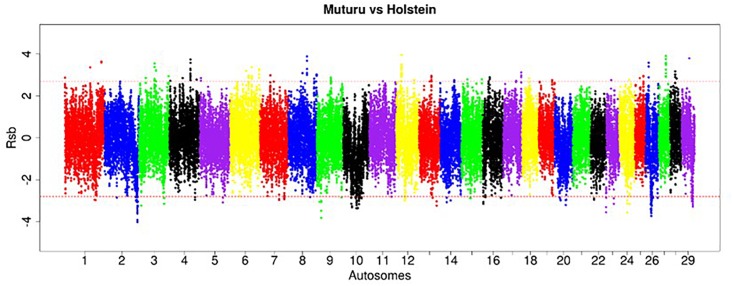
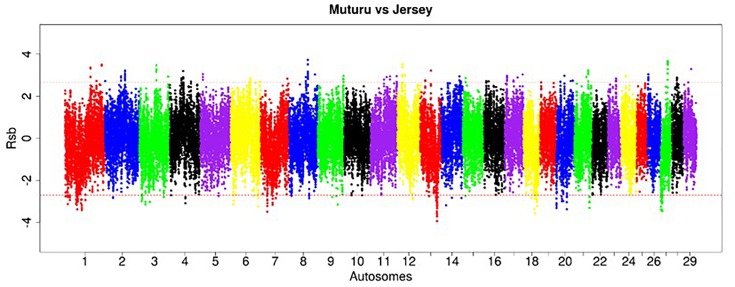
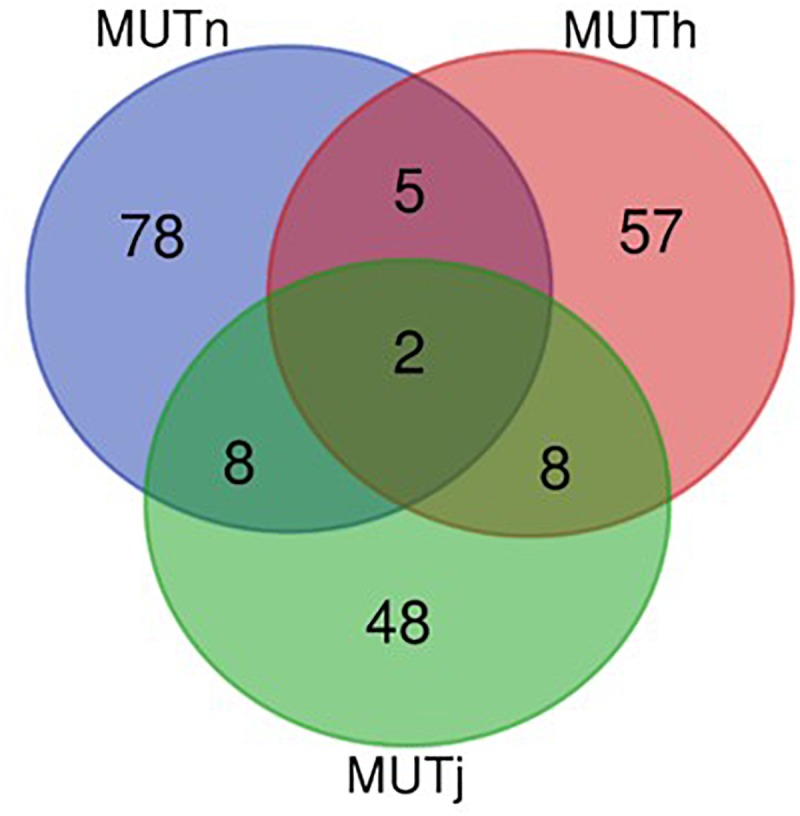
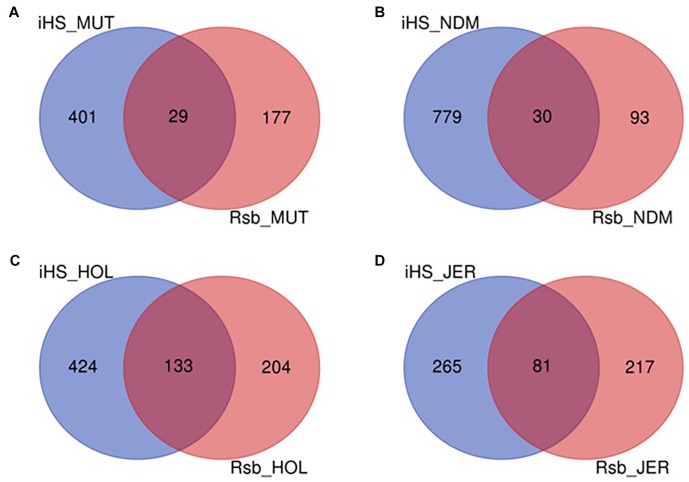
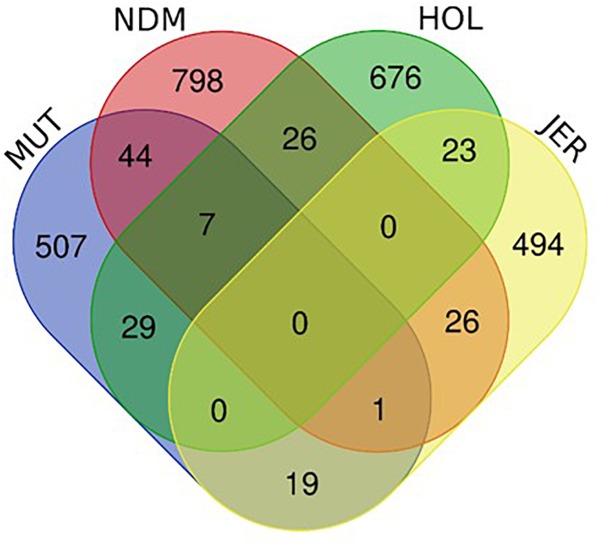
Like most West African Bos taurus, the shorthorn Muturu is under threat of replacement or crossbreeding with zebu. Their populations are now reduced to a few hundred breeding individuals and they are considered endangered. So far, the genetic variation and genetic basis of the trypanotolerant Muturu environmental adaptation have not been assessed. Here, we present genome-wide candidate positive selection signatures in Muturu following within-population iHS and between population Rsb signatures of selection analysis. We compared the results in Muturu with the ones obtained in N'Dama, a West African longhorn trypanotolerant taurine, and in two European taurine (Holstein and Jersey). The results reveal candidate signatures of selection regions in Muturu including genes linked to the innate (e.g., TRIM10, TRIM15, TRIM40, and TRIM26) and the adaptive (e.g., JSP.1, BOLA-DQA2, BOLA-DQA5, BOLA-DRB3, and BLA-DQB) immune responses. The most significant regions are identified on BTA 23 at the bovine major histocompatibility complex (MHC) (iHS analysis) and on BTA 12 at genes including a heat tolerance gene (INTS6) (Rsb analysis). Other candidate selected regions include genes related to growth traits/stature (e.g., GHR and GHRHR), coat color (e.g., MITF and KIT), feed efficiency (e.g., ZRANB3 and MAP3K5) and reproduction (e.g., RFX2, SRY, LAP3, and GPX5). Genes under common signatures of selection regions with N'Dama, including for adaptive immunity and heat tolerance, suggest shared mechanisms of adaptation to environmental challenges for these two West African taurine cattle. Interestingly, out of the 242,910 SNPs identified within the candidate selected regions in Muturu, 917 are missense SNPs (0.4%), with an unequal distribution across 273 genes. Fifteen genes including RBBP8, NID1, TEX15, LAMA3, TRIM40, and OR12D3 comprise 220 missense variants, each between 11 and 32. Our results, while providing insights into the candidate genes under selection in Muturu, are paving the way to the identification of genes and their polymorphisms linked to the unique tropical adaptive traits of the West Africa taurine, including trypanotolerance.

Keywords: African Bos taurus; MHC; comparative genomics; disease resistance; heat tolerance.


Figures

FIGURE 1
FIGURE 1
Venn diagram of unique and shared autosomal bi-allelic SNPs between Muturu and other taurine. MUT, Muturu; NDM, N’Dama; HOL, Holstein; JER, Jersey.
FIGURE 2
FIGURE 2
Heat map of genetic relationships among the four B. taurus based on average Nei’s genetic distances matrix. (A) individuals and (B) populations comparisons. MUT, Muturu; NDM, N’Dama; HOL, Holstein; JER, Jersey.
FIGURE 3
FIGURE 3
Population structure of the four B. taurus breeds. (A) PC 1 versus PC 2, (B) PC 3 versus PC 4 and (C) Admixture analysis K = 2–4.
FIGURE 4
FIGURE 4
Manhattan plot of the genome-wide distribution of iHS scores for the autosomes in Muturu cattle. The red dash line indicates the threshold of P < 0.0001 [equivalent of –log (iHS) > 4] at which windows are considered under selection.
FIGURE 5
FIGURE 5
Manhattan plot of the genome-wide distribution of Rsb Muturu – N’Dama. Red dash lines are the threshold of the windows in the top 0.5% Rsb scores.
FIGURE 6
FIGURE 6
Manhattan plot of the genome-wide distribution of Rsb Muturu – Holstein. Red dash lines are the thresholds of the windows in the top 0.5% Rsb scores.
FIGURE 7
FIGURE 7
Manhattan plot of the distribution of Rsb Muturu – Jersey. Red dash lines are the thresholds of the windows in the top 0.5% Rsb scores.
FIGURE 8
FIGURE 8
Venn diagram of unique and shared genes within candidate selected regions between Muturu and other taurine following Rsb analysis. MUTn, Muturu – N’Dama; MUTh, Muturu – Holstein; MUTj, Muturu – Jersey.
FIGURE 9
FIGURE 9
Venn diagram showing the unique and shared candidate genes in the four B. taurus following iHS and Rsb analysis. (A) Muturu (MUT), (B) N’Dama (NDM), (C) Holstein (HOL), (D) Jersey (JER).
FIGURE 10
FIGURE 10
Venn diagram showing unique and shared candidate genes identified in candidate regions under selection (iHS and Rsb) in Muturu (MUT), N’Dama (NDM), Holstein (HOL), and Jersey (JER).

References

    1. Adebambo O. A. (2001). The muturu: a rare sacred breed of cattle in Nigeria. Anim. Genet. Resour. 31 27–36. 10.1017/s1014233900001450 - DOI
    1. Alexander D. H., Novembre J., Lange K. (2009). Fast model-based estimation of ancestry in unrelated individuals. Genome Res. 19 1655–1664. 10.1101/gr.094052.109 - DOI - PMC - PubMed
    1. Amills M., Ramiya V., Nonmine J., Lewin H. (1998). The major histocompatibility complex. Rev. Sci. Tech. Off. Int. Epiz. 17 108–120. - PubMed
    1. An X., Wang L., Hou J., Li G., Song Y., Wang J., et al. (2011). Novel polymorphisms of goat growth hormone and growth hormone receptor genes and their effects on growth traits. Mol. Biol. Rep. 38 4037–4043. 10.1007/s11033-010-0522-3 - DOI - PubMed
    1. Anguita E., Gupta R., Olariu V., Valk P. J., Peterson C., Delwel R., et al. (2016). A somatic mutation of GFI1B identified in leukemia alters cell fate via a SPI1 (PU. 1) centered genetic regulatory network. Dev. Biol. 411 277–286. 10.1016/j.ydbio.2016.02.002 - DOI - PubMed