Categorizing a continuous predictor subject to measurement error
- PMID: 31231451
- PMCID: PMC6588013
- DOI: 10.1214/18-EJS1489
Categorizing a continuous predictor subject to measurement error
Abstract
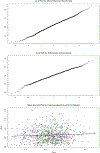
Epidemiologists often categorize a continuous risk predictor, even when the true risk model is not a categorical one. Nonetheless, such categorization is thought to be more robust and interpretable, and thus their goal is to fit the categorical model and interpret the categorical parameters. We address the question: with measurement error and categorization, how can we do what epidemiologists want, namely to estimate the parameters of the categorical model that would have been estimated if the true predictor was observed? We develop a general methodology for such an analysis, and illustrate it in linear and logistic regression. Simulation studies are presented and the methodology is applied to a nutrition data set. Discussion of alternative approaches is also included.
Keywords: Categorization; differential misclassification; epidemiology practice; inverse problems; measurement error.
Figures

Similar articles
-
Comparing the effects of continuous and discrete covariate mismeasurement, with emphasis on the dichotomization of mismeasured predictors.Biometrics. 2002 Dec;58(4):878-87. doi: 10.1111/j.0006-341x.2002.00878.x. Biometrics. 2002. PMID: 12495142
-
A Simulation Study of Categorizing Continuous Exposure Variables Measured with Error in Autism Research: Small Changes with Large Effects.Int J Environ Res Public Health. 2015 Aug 24;12(8):10198-234. doi: 10.3390/ijerph120810198. Int J Environ Res Public Health. 2015. PMID: 26305250 Free PMC article.
-
Getting less of what you want: reductions in statistical power and increased bias when categorizing medication adherence data.J Behav Med. 2016 Dec;39(6):969-980. doi: 10.1007/s10865-016-9727-9. Epub 2016 Feb 27. J Behav Med. 2016. PMID: 26921166 Free PMC article.
-
Understanding the effect of categorization of a continuous predictor with application to neuro-oncology.Neurooncol Pract. 2021 Aug 4;9(2):87-90. doi: 10.1093/nop/npab049. eCollection 2022 Apr. Neurooncol Pract. 2021. PMID: 35371519 Free PMC article. Review.
-
Analytic approaches to longitudinal caries data in adults.Community Dent Oral Epidemiol. 1997 Feb;25(1):42-51. doi: 10.1111/j.1600-0528.1997.tb00898.x. Community Dent Oral Epidemiol. 1997. PMID: 9088691 Review.
Cited by
-
Reflection on modern methods: five myths about measurement error in epidemiological research.Int J Epidemiol. 2020 Feb 1;49(1):338-347. doi: 10.1093/ije/dyz251. Int J Epidemiol. 2020. PMID: 31821469 Free PMC article.
-
Misstatements, misperceptions, and mistakes in controlling for covariates in observational research.Elife. 2024 May 16;13:e82268. doi: 10.7554/eLife.82268. Elife. 2024. PMID: 38752987 Free PMC article. Review.
References
-
- Berry SM, Carroll RJ, and Ruppert D (2002). Bayesian smoothing and regression splines for measurement error problems. Journal of the American Statistical Association 97, 457, 160–169.
-
- Buonaccorsi JP (2010). Measurement Error: Models, Methods and Applications. Chapman & Hall.
-
- Carroll RJ, Ruppert D, Stefanski LA, and Crainiceanu CM (2006). Measurement Error in Nonlinear Models: A Modern Perspective, Second Edition Chapman and Hall.
-
- Chaix B, Kestens Y, Duncan DT, Brondeel R, Méline J, Aarbaoui TE, Pannier B, and Merlo J (2016). A gps-based methodology to analyze environment-health associations at the trip level: case-crossover analyses of built environments and walking. American Journal of Epidemiology 184, 8, 579–589. - PubMed
Grants and funding
LinkOut - more resources
Full Text Sources
