. 2019 Jun 11;10(39):3865-3878.
doi: 10.18632/oncotarget.26988.

Investigating the role of LSD2 as an epigenetic regulator in Ewing sarcoma

Affiliations

Investigating the role of LSD2 as an epigenetic regulator in Ewing sarcoma

Priyal O Patel et al. Oncotarget. .

Abstract

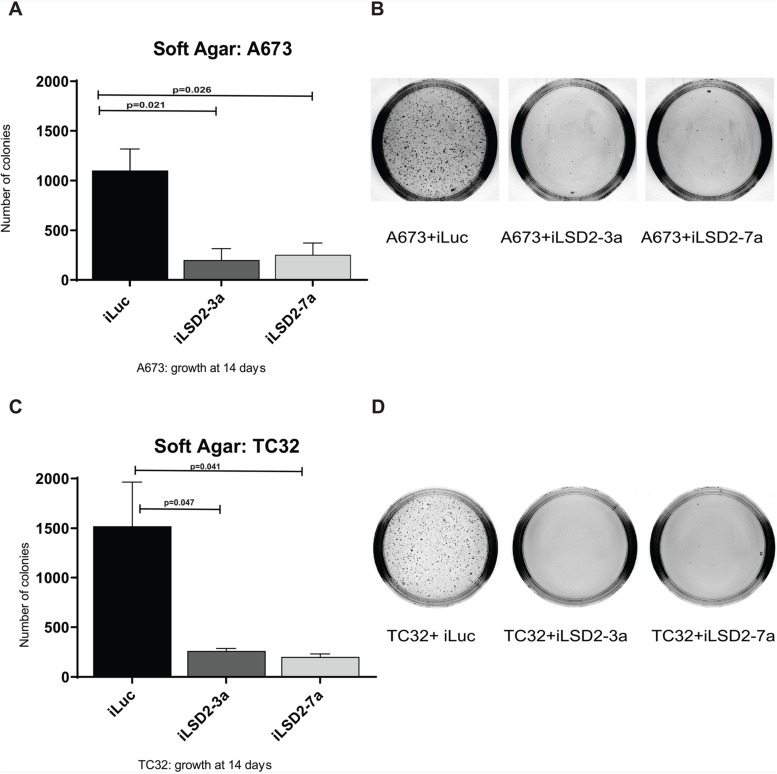
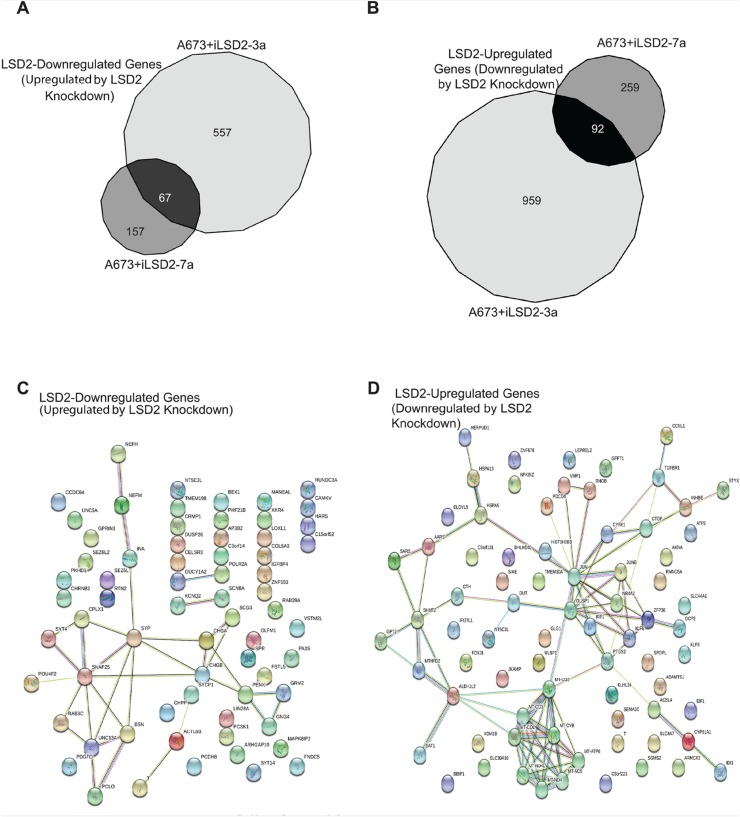
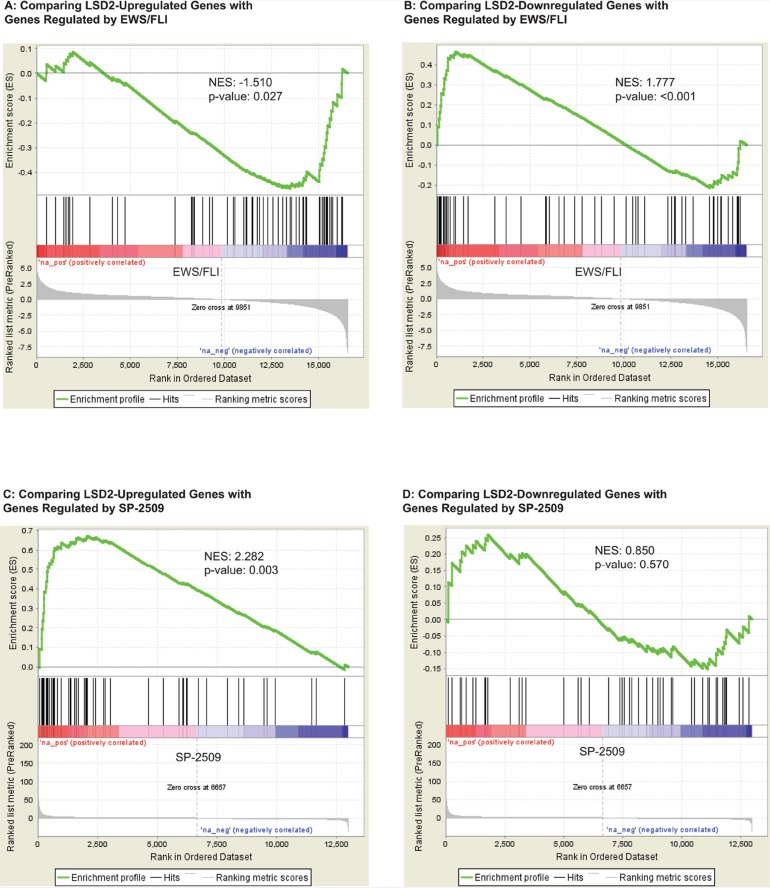
Ewing sarcoma is the second most common solid bone malignancy diagnosed in pediatric and young adolescent populations. Despite aggressive multi-modal treatment strategies, 5-year event-free survival remains at 75% for patients with localized disease and 20% for patients with metastases. Thus, the need for novel therapeutic options is imperative. Recent studies have focused on epigenetic misregulation in Ewing sarcoma development and potential new oncotargets for treatment. This project focused on the study of LSD2, a flavin-dependent histone demethylase found to be overexpressed in numerous cancers. We previously demonstrated that Ewing sarcoma cell lines are extremely susceptible to small molecule LSD1 blockade with SP-2509. Drug sensitivity correlated with the degree of LSD2 induction following treatment. As such, the purpose of this study was to determine the role of LSD2 in the epigenetic regulation of Ewing sarcoma, characterize genes regulated by LSD2, and examine the impact of SP-2509 drug treatment on LSD2 gene regulation. Genetic depletion (shRNA) of LSD2 significantly impaired oncogenic transformation with only a modest impact on proliferation. Transcriptional analysis of Ewing sarcoma cells following LSD2knockdown revealed modulation of genes primarily involved in metabolic regulation and nervous system development. Gene set enrichment analysis showed that SP-2509 does not impact LSD2 targeted genes. Although there are currently no small molecule agents that specifically target LSD2, our results support further investigations into agents that can inhibit this histone demethylase as a possible treatment for Ewing sarcoma.

Keywords: Ewing sarcoma; LSD1/KDM1A; LSD2/KDM1B; SP-2509.


Conflict of interest statement

CONFLICTS OF INTEREST Stephen L. Lessnick is a consultant/advisory board member for Salarius Pharmaceuticals.

Figures

Figure 1
Figure 1. Two LSD2 isoforms identified in A673 cells.
The most widely studied LSD2 isoform (NM_153042.3) in the NCBI database has 18 exons. The first isoform isolated from A673 cells had a total of 17 exons, with exon 8 missing. The second isoform of LSD2 had only 16 exons, with exons 7 and 8 missing. Numbers indicate LSD2 exon number with black boxes denoting deleted regions.
Figure 2
Figure 2. LSD2 mRNA expression decreased after retroviral infection with shRNAs.
(A/B) qRT-PCR analysis of LSD2 mRNA expression in A673 and TC32 cells following retroviral infection with either LSD2 shRNA (iLSD2-3a/iLSD2-7a) or control (iLuc) constructs. Cells collected 3 days post puromycin selection. Data represents mean expression ± SEM from three independent experiments. (C/D) qRT-PCR analysis of LSD1 mRNA expression from cells described as above.
Figure 3
Figure 3. LSD2 protein expression following retroviral knockdown.
(A/B) Densitometry quantification of LSD2 protein levels in A673 and TC32 cells following retroviral infection with either LSD2 shRNA (iLSD2-3a/iLSD2-7a) or control (iLuc) constructs. Cells collected 3 days post puromycin selection. Data represents mean fold change ± SEM compared to iLuc control from 3 independent experiments. (C/D) Representative western blot images of LSD2, LSD1 and α-tubulin (loading control) protein levels from cells described as above. (E/F) Densitometry quantification of LSD1 protein levels from A673 and TC32 cells treated as above.
Figure 4
Figure 4. LSD2 knockdown and its impact on Ewing sarcoma cellular proliferation.
IncuCyte proliferation analysis of A673 (A) and TC32 (B) cells following retroviral infection with either LSD2 shRNA (iLSD2-3a/iLSD2-7a) or control (iLuc) constructs. Phase contrast images taken every three hours. Data represents mean confluence ± SEM from 3 independent experiments. Dashed line denotes time taken for iLuc control cells to reach 100% confluency.
Figure 5
Figure 5. LSD2 knockdown significantly impairs the anchorage-independent growth capacity of Ewing sarcoma cells.
Soft agar colony quantification of A673 (A) and TC32 (C) cells stably transduced with LSD2 or iLuc control shRNA constructs following puromycin selection. Data represents mean colony number ± SEM from 3 independent experiments. Representative agar images of A673 (B) and TC32 (D) cells treated as above, 14 days post seeding.
Figure 6
Figure 6. Core A673 LSD2 transcriptional profile.
RNA seq Venn diagram analysis of genes significantly (>1.5 fold change) downregulated (A) and upregulated (B) by LSD2 in A673 cells. STRING pathway analysis of the core LSD2 downregulated (n=67) (C) and upregulated (n=92) (D) genes in A673 cells. The colored nodes represent the inputted proteins into STRING. The colors are automatically assigned by STRING and are used as a visual aid to show the proteins that have a functional relationship with each other (http://version10.string-db.org/help/faq/#are-the-colors-assigned-to-nodes-significant.) Empty nodes represent proteins of unknown structure, while filled nodes are proteins for which the 3D structure is known.
Figure 7
Figure 7. GSEA data supports a functional relationship between transcriptional genes regulated by LSD2 and EWS/FLI.
(A) GSEA data comparing LSD2-upregulated genes with genes controlled by EWS/FLI. (B) GSEA data comparing LSD2-downregulated genes with ESW/FLI regulated genes. Genes up- (C) and downregulated (D) by LSD2 compared with genes regulated by SP-2509 drug treatment.

References

    1. Esiashvili N, Goodman M, Marcus RB Jr. Changes in incidence and survival of Ewing sarcoma patients over the past 3 decades: Surveillance Epidemiology and End Results data. J Pediatr Hematol Oncol. 2008; 30: 425-30. 10.1097/MPH.0b013e31816e22f3. . - DOI - PubMed
    1. Monument MJ, Johnson KM, Grossmann AH, Schiffman JD, Randall RL, Lessnick SL. Microsatellites with macro-influence in ewing sarcoma. Genes (Basel). 2012; 3: 444-60. 10.3390/genes3030444. . - DOI - PMC - PubMed
    1. Pishas KI, Drenberg CD, Taslim C, Theisen ER, Johnson KM, Saund RS, Pop IL, Crompton BD, Lawlor ER, Tirode F, Mora J, Delattre O, Beckerle MC, et al.. Therapeutic Targeting of KDM1A/LSD1 in Ewing Sarcoma with SP-2509 Engages the Endoplasmic Reticulum Stress Response. Mol Cancer Ther. 2018; 17: 1902-16. 10.1158/1535-7163.MCT-18-0373. . - DOI - PMC - PubMed
    1. Sankar S, Bell R, Stephens B, Zhuo R, Sharma S, Bearss DJ, Lessnick SL. Mechanism and relevance of EWS/FLI-mediated transcriptional repression in Ewing sarcoma. Oncogene. 2016; 35: 6155-6. 10.1038/onc.2016.142. . - DOI - PubMed
    1. Sankar S, Theisen ER, Bearss J, Mulvihill T, Hoffman LM, Sorna V, Beckerle MC, Sharma S, Lessnick SL. Reversible LSD1 inhibition interferes with global EWS/ETS transcriptional activity and impedes Ewing sarcoma tumor growth. Clin Cancer Res. 2014; 20: 4584-97. 10.1158/1078-0432.CCR-14-0072. . - DOI - PMC - PubMed