

Expression of the receptor of advanced glycation end-products (RAGE) and membranal location in peripheral blood mononuclear cells (PBMC) in obesity and insulin resistance
- PMID: 31231489
- PMCID: PMC6570754
- DOI: 10.22038/ijbms.2019.34571.8206
Expression of the receptor of advanced glycation end-products (RAGE) and membranal location in peripheral blood mononuclear cells (PBMC) in obesity and insulin resistance
Abstract
Objectives: The present study aimed to evaluate the receptor of advanced glycation end-products (RAGE), NF-kB, NRF2 gene expression, and RAGE cell distribution in peripheral blood mononuclear cells (PBMC) in subjects with obesity and IR compared with healthy subjects.
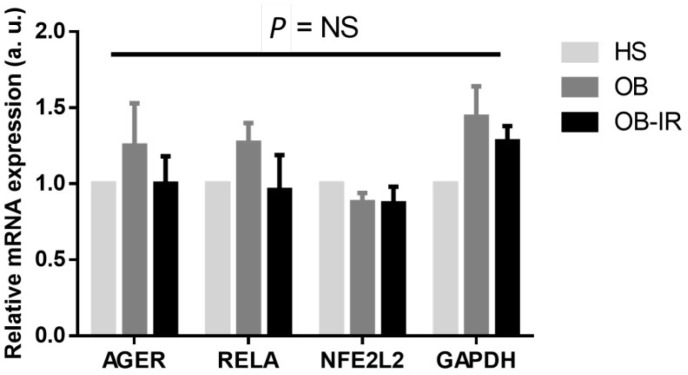
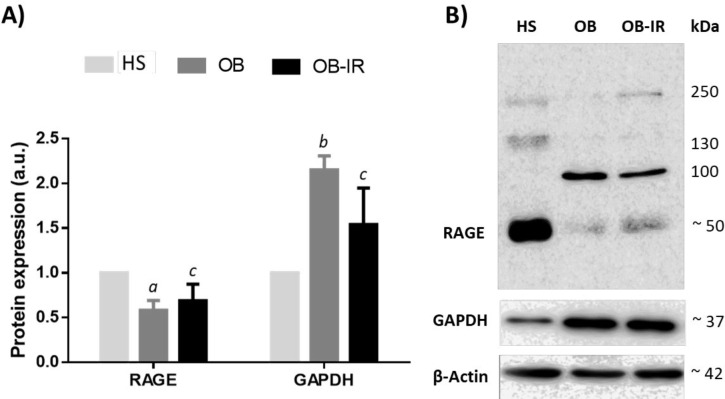
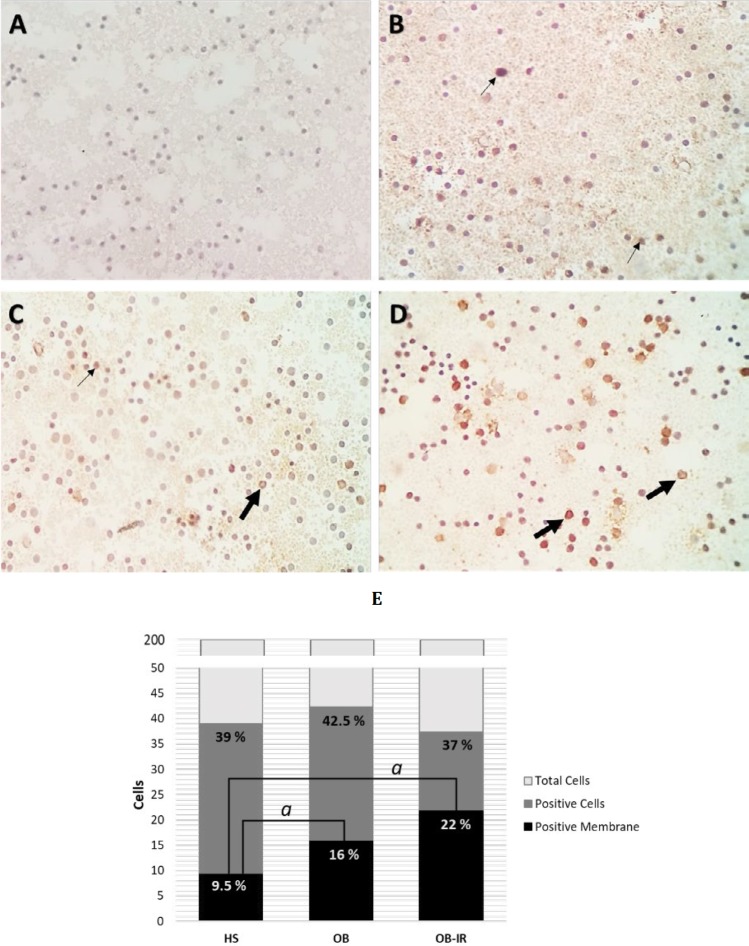
Materials and methods: The mRNA expression levels of RAGE, NF-kB, NRF2, and GAPDH were determined in PBMC by qPCR in 20 obese (OB), 17 obese with insulin resistance (OB-IR), and 20 healthy subjects (HS), matched by age and sex. RAGE protein expression and its localization were determined by Western Blot and immunocytochemistry (ICC) analysis, total soluble RAGE (sRAGE) and MCP-1 plasma levels by ELISA.
Results: RAGE, NF-kB, and NRF2 genes mRNA expression in PBMCs did not show variation between groups. RAGE protein was lower in OB and OB-IR groups; RAGE was located predominantly on the cell-surface in the OB-IR group compared to the HS group (22% vs 9.5%, P<0.001). OB-IR group showed lower sRAGE plasma levels, and correlated negatively with HOMA-IR, ALT parameters (r= -0.374, r= -0.429, respectively), and positively with NFE2L2 mRNA (r= 0.540) P<0.05.
Conclusion: In this study, OB-IR subjects did not reflect significant differences in gene expression; however, correlations detected between sRAGE, biochemical parameters, and NRF2, besides the predominant RAGE distribution on the cell membrane in PBMC could be evidence of the early phase of the inflammatory cascade and the subsequent damage in specific tissues in subjects with OB-IR.
Keywords: AGER protein human; Insulin resistance; Obesity; Oxidative stress; Receptor for advanced - glycation end products.
Conflict of interest statement
None declared.
Figures
Similar articles
-
Association of the Gly82Ser polymorphism in the receptor for advanced glycation end products (RAGE) gene with circulating levels of soluble RAGE and inflammatory markers in nondiabetic and nonobese Koreans.Metabolism. 2007 Feb;56(2):199-205. doi: 10.1016/j.metabol.2006.09.013. Metabolism. 2007. PMID: 17224333
-
Age-Influenced Receptors of Advanced Glycation End Product Overexpression Associated With Osteogenic Differentiation Impairment in Patients With Type 2 Diabetes.Front Endocrinol (Lausanne). 2021 Aug 26;12:726182. doi: 10.3389/fendo.2021.726182. eCollection 2021. Front Endocrinol (Lausanne). 2021. PMID: 34512554 Free PMC article.
-
Soluble Receptor for Advanced Glycation End Products and Its Correlation with Vascular Damage in Adolescents with Obesity.Horm Res Paediatr. 2019;92(1):28-35. doi: 10.1159/000501718. Epub 2019 Aug 14. Horm Res Paediatr. 2019. PMID: 31412337 Clinical Trial.
-
Low levels of serum soluble receptors for advanced glycation end products, biomarkers for disease state: myth or reality.Int J Angiol. 2014 Mar;23(1):11-6. doi: 10.1055/s-0033-1363423. Int J Angiol. 2014. PMID: 24627612 Free PMC article. Review.
-
Relationship of Advanced Glycation End Products With Cardiovascular Disease in Menopausal Women.Reprod Sci. 2015 Jul;22(7):774-82. doi: 10.1177/1933719114549845. Epub 2014 Sep 16. Reprod Sci. 2015. PMID: 25228634 Free PMC article. Review.
Cited by
-
Correlation and Diagnostic Value of Serum RBP4 and sRAGE and the Condition of Patients with Chronic Kidney Disease.Evid Based Complement Alternat Med. 2021 Oct 27;2021:6166528. doi: 10.1155/2021/6166528. eCollection 2021. Evid Based Complement Alternat Med. 2021. Retraction in: Evid Based Complement Alternat Med. 2023 Jun 21;2023:9897427. doi: 10.1155/2023/9897427. PMID: 34745291 Free PMC article. Retracted.
-
RAGE engagement by SARS-CoV-2 enables monocyte infection and underlies COVID-19 severity.Cell Rep Med. 2023 Nov 21;4(11):101266. doi: 10.1016/j.xcrm.2023.101266. Epub 2023 Nov 8. Cell Rep Med. 2023. PMID: 37944530 Free PMC article.
-
The Role of JNk Signaling Pathway in Obesity-Driven Insulin Resistance.Diabetes Metab Syndr Obes. 2020 Apr 29;13:1399-1406. doi: 10.2147/DMSO.S236127. eCollection 2020. Diabetes Metab Syndr Obes. 2020. PMID: 32425571 Free PMC article. Review.
-
Implications of receptor for advanced glycation end products for progression from obesity to diabetes and from diabetes to cancer.World J Diabetes. 2023 Jul 15;14(7):977-994. doi: 10.4239/wjd.v14.i7.977. World J Diabetes. 2023. PMID: 37547586 Free PMC article. Review.
-
Receptors of Advanced Glycation End Product (RAGE) Suppression Associated With a Preserved Osteogenic Differentiation in Patients With Prediabetes.Front Endocrinol (Lausanne). 2022 Feb 14;13:799872. doi: 10.3389/fendo.2022.799872. eCollection 2022. Front Endocrinol (Lausanne). 2022. PMID: 35237235 Free PMC article.
References
-
- World Health Organization (WHO) Obesity: preventing and managing the global epidemic. [ (accessed on December 2018)]. Available online: http://www.who.int/topics/obesity/en/
-
- Hernández M, Rivera J, Shamah T, Cuevas L, Gómez L, Gaona E, García D, et al. Encuesta Nacional de Salud y Nutrición de Medio Camino (ENSANUT MC 2016) [(accessed on December 2018)]. Available online: http://ensanut.insp.mx/ensanut2016/descarga_bases.php#.WoyFH-ejnIU.
-
- De Mello VDF, Kolehmainen M, Pulkkinen L, Schwab U, Mager U, Laaksonen DE, et al. Downregulation of genes involved in NFκB activation in peripheral blood mononuclear cells after weight loss is associated with the improvement of insulin sensitivity in individuals with the metabolic syndrome: The GENOBIN study. Diabetologia. 2008;51:2060–2067. - PubMed
LinkOut - more resources
Full Text Sources
Research Materials
Miscellaneous